
ABSTRACT
Stray light in single-monochromator Brewer instruments increases the uncertainty of solar ultraviolet spectral irradiance measurements and ozone retrievals. To study how spectral irradiance within and outside the measurement ranges of the instruments affects stray light, two Brewer MKII instruments were characterized for the level of in- and out-of-range stray light at multiple laser wavelengths. In addition, several solar-blind filters utilized in single-monochromator Brewers to limit out-of-range stray light were characterized for spectral and spatial transmittances. Finally, the measurement results were used to simulate the effect of stray light and stray light correction on spectral irradiance and ozone measurements at different wavelength regions. The effect of stray light from wavelengths above 340 nm was found to be negligible compared with other sources of uncertainty. On the other hand, contributions from wavelengths between 325 and 340 nm can form a significant portion of the overall stray light of the instrument, with 325 nm being the upper limit of the nominal measurement range of the instrument.
RÉSUMÉ
[Traduit par la rédaction] La lumière parasite à l'intériur du Brewer à monochromateur simple augmente l’incertitude des mesures d’éclairement énergétique spectral dans l'ultraviolet solaire et de l'inversion de la colonne d'ozone. Afin d’étudier de quelle façon l’éclairement énergétique spectral, à l’intérieur et à l’extérieur de la gamme spectrale de mesure de l’instrument, affecte la lumière parasite, nous caractérisons deux Brewer MKII selon le niveau de lumière parasite (dans leur gamme spectrale de mesure et hors de celle-ci) à plusieurs longueurs d’onde avec un laser. De plus, nous caractérisons, selon leurs transmittances spectrales et spatiales, plusieurs filtres solaires appliqués aux Brewer à monochromateur simple afin de limiter la lumière parasite hors de la gamme spectrale de mesure. Finalement, nous utilisons ces mesures pour simuler l’effet de la lumière parasite (et de la correction de celle-ci) sur l’éclairement énergétique spectral et sur la mesure de la colonne d'ozone pour diverses régions spectrales. L’effet de la lumière parasite de longueur d’onde supérieure à 340 nm reste négligeable en comparaison aux autres sources d’incertitude. En revanche, la contribution de la lumière parasite de longueur d’onde entre 325 et 340 nm peut former une portion considérable de la lumière parasite totale pour l’instrument, 325 nm étant la limite supérieure de la gamme de mesure nominale de l’instrument.
KEYWORDS:
1 Introduction
The Brewer spectrophotometer, commercialized in the 1980s, is an automated instrument for measuring ozone (O3) and sulphur dioxide (SO2) concentrations in the atmosphere (Kerr, McElroy, & Olafson, Citation1981; Kerr, McElroy, & Wardle, Citation1987; Kerr, McElroy, Wardle, Olafson, & Evans, Citation1985). The instrument can also be used for spectral measurements of the global solar ultraviolet (UV) irradiance at ground level (Bais, Citation1997; Bais, Zerefos, & McElroy, Citation1996; Fioletov, Kerr, & Wardle, Citation1997; Kerr & McElroy, Citation1993). There are two major ground-based global ozone monitoring networks; one consists of the older manually operated Dobson instuments (Basher, Citation1985; Dobson, Citation1931), and the other consists of Brewer spectrophotometers (de Backer & de Muer, Citation1991; Kerr, Asbridge, & Evans, Citation1988). Over 200 Brewer instruments have been produced as of 2014, with the majority still in operation (Kipp & Zonen, Citation2017). They provide important information about the recovery of the ozone layer (de Backer & de Muer, Citation1991; Eleftheratos et al., Citation2015; Fioletov, McArthur, Kerr, & Wardle, Citation2001), which became a major concern after the discovery of ozone depletion (Farman, Gardiner, & Shanklin, Citation1985; Molina & Rowland, Citation1974; Prather & Watson, Citation1990; Solomon, Citation1999; World Meteorological Organization, Citation2014). The ozone layer affects the amount of UV radiation reaching the surface of the Earth. Because of the various environmental (UNEP, Citation2017) and health effects, such as sunburn, various forms of skin cancer (de Gruijl, Citation1999; Lucas, McMichael, Smith, & Armstrong, Citation2006), and vitamin D synthesis (Webb, Citation2006), related to UV radiation, continuous monitoring of solar UV spectral irradiance at ground level is vital (Eleftheratos et al., Citation2015; Fioletov et al., Citation2001; Gantner, Winkler, & Köhler, Citation2000; Kerr & McElroy, Citation1993; Zerefos, Bais, Meleti, & Ziomas, Citation1995).
The Brewer spectrophotometer has undergone several iterations over the years. The global network of Brewer instruments consists mostly of single-monochromator Brewer MKII and MKIV instruments and double-monochromator Brewer MKIII instruments. Although the Brewer MKIII instrument is the only model still in production, the existing single-monochromator instruments remain an important fraction of the network, constituting approximately 70% of the instruments in the International Ozone Services Inc. (Citation2017) list that tracks Brewer calibrations carried out by International Ozone Services. The higher level of stray light—the measured signal at one wavelength being affected by radiation at other wavelengths—in the single-monochromator instruments increases the uncertainty of UV spectral irradiance measurements when compared with the double-monochromator instruments (Bais et al., Citation1996; Fioletov et al., Citation1997; Gröbner et al., Citation2006; Kerr & McElroy, Citation1993; Lantz et al., Citation2002). This effect is largest at short UV wavelengths where the spectral irradiance level is low compared with the level of potential stray light contribution. Stray light also affects ozone retrieval (Karppinen et al., Citation2015; Kerr, Citation2002; Kiedron, Disterhoft, & Lantz, Citation2008), which in Brewer spectrophotometers is based on the ratios of signals at four wavelengths between approximately 310 and 320 nm (Kerr et al., Citation1985). The effect is enhanced at long slant paths (i.e., when the solar zenith angle is high due to the latitude of the measurement site or the time of the measurement) because the increased ozone absorption decreases the short wavelength portion of the solar UV irradiance at ground level.
Several methods for stray light correction in single-monochromator Brewers have been proposed and studied. A straightforward method for stray light correction subtracts the signal level at the lowest measureable wavelengths, around 290 nm, from the measured spectral irradiance at all wavelengths (Bais et al., Citation1996; Kerr & McElroy, Citation1993; Lantz et al., Citation2002). This method relies on the assumption that the amount of stray light does not change with wavelength. A more sophisticated method measures the slit function of the instrument at some wavelength, typically at the wavelength of 325 nm of a helium-cadmium (HeCd) laser, and performs a deconvolution of the measured spectrum with the slit function (Fioletov, Kerr, Wardle, & Wu, Citation2000; Karppinen et al., Citation2015; Kerr, Citation2002; Petropavlovskikh et al., Citation2011). In this method, the slit function is assumed to retain its shape at different radiation wavelengths. Different authors use different wavelength ranges for the stray light correction, with termination wavelengths ranging from 325 to 340 nm on the long wavelength side. Comparisons of the solar UV spectral irradiance results of single-monochromator Brewers with those of double-monochromator instruments show that although the performance of the single-monochromator instruments at short wavelengths is significantly improved by the stray light correction, there are still differences in the readings of the different instrument types, especially at short UV wavelengths (Bais et al., Citation1996; Fioletov et al., Citation2000).
Stray light studies so far have focused on the radiation in the in-range region of the instrument (i.e., the wavelength range covered by the mechanical movement of the monochromator, nominally between 290 and 325 nm for the Brewer MKII and between 287 and 363 nm for the Brewer MKIV as listed in the instrument manuals (SCI-TEC Instruments Inc., Citation1999a, Citation1999b)). It should be noted that by carrying out the spectral measurement in multiple parts using different exit slits of the instrument, the measurement range can be extended to a degree, at least to 338 nm with the Brewer MKII. Measurements and corrections in the out-of-range wavelength region are more difficult to carry out in practice because the spectral responsivity of the instrument and the spectral irradiance level cannot be measured by the Brewer instrument at these wavelengths. Because the single-monochromator instruments are equipped with bandpass filters that block radiation at the out-of-band wavelengths, the out-of-range contribution has typically been expected to be negligible. However, considering the high solar irradiance level in the visible wavelength region compared with the irradiance level in the shorter UV region; possible degradation of the bandpass filter, which includes a hygroscopic nickel sulphate (NiSO4(H2O)6) element that may exhibit structural changes with humidity; and the effects of the transition band between the pass- and stopbands of the filter the possibility of stray light contribution from out-of-range radiation cannot be fully ignored.
This study presents the results of slit function measurements for two Brewer MKII instruments at several laser wavelengths. The instruments were also characterized for stray light at several out-of-range wavelengths. To further investigate the out-of-range properties of the instruments, several bandpass filters—both new and used—were characterized separately for spectral transmittance properties in the wavelength range from 200 to 850 nm. In addition, the spatial non-uniformities of the filters were characterized in order to determine the quality and possible degradation of the filters. Finally, the instrument and filter characterization results were used to simulate the stray light properties of single-monochromator Brewers in order to find out how different wavelength regions contribute to the overall stray light at UV wavelengths, and how this affects the ozone retrieval.
2 Structure of the Brewer instrument
A brief description of the structure and operating principles of the Brewer instrument, as it pertains to stray light characteristics, is given in this section. The Brewer MKII is used as the basis for this description because both the instruments characterized in the study were of this type. The differences between the instrument models are briefly described at the end of the section. For a more thorough description of the instruments, refer to the instruction manuals (Kipp & Zonen, Citation2015; SCI-TEC Instruments Inc., Citation1999a, Citation1999b).
shows the schematic overview of the optics of the Brewer MKII spectrophotometer. The instrument has three user-selectable inputs: direct input, global input, and calibration lamp input (not shown). The input is selected by turning the zenith angle prism to the corresponding position. The zenith angle prism is also used to adjust the zenith angle of the direct input, and the azimuth angle is adjusted by rotating the instrument on its tripod. The global input is equipped with a polytetrafluoroethylene (PTFE)-based UV diffuser that collects radiation from the entire hemisphere. The adjustable iris diaphragm placed at the focal point between two focusing lenses is used to adjust the field-of-view in the direct measurement mode. The two filter wheels of the foreoptics contain film polarizers, a quartz diffuser for use in measurements with the direct input and the calibration lamp, neutral density (ND) filters for attenuating the signal, an opaque disk for blocking the radiation, and empty spaces for situations for which no adjustments to the radiation field are required. (SCI-TEC Instruments Inc., Citation1999a)
Fig. 1 Simplified schematic drawing of the Brewer MKII spectrophotometer. The size of the exit slit and slit mask assembly is exaggerated for illustration purposes. In the Brewer MKIV, the fixed solar-blind filter is replaced by a filter wheel. The colouring of the radiation is for illustration purposes only and is not indicative of the wavelength range of the instrument.
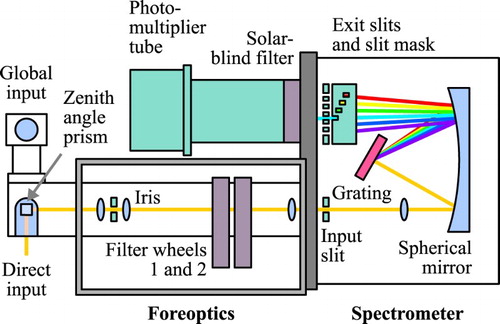
Behind the filter wheel, a plano-convex lens focuses the radiation onto the fixed input slit of the monochromator. The radiation passes through a correction lens and is collimated with the spherical mirror on the surface of the holographic diffraction grating. In spectral measurements, the grating is rotated using a motorized rotation stage, while in ozone measurement the grating position is stationary. In both measurement modes, the second diffraction order is directed via the spherical mirror to the exit slit mask assembly. The exit slit assembly has six openings, and the cylindrical slit mask has eight positions, one for each slit, as well as positions for dark signal measurement and for measurement through two slits simultaneously. In ozone measurements, the discrete wavelengths are selected by turning the slit mask while the grating remains stationary (SCI-TEC Instruments Inc., Citation1999a).
A Fabry lens located behind the exit slit focuses the radiation on the cathode of the photomultiplier tube (PMT) of the instrument. In the Brewer MKII, a solar-blind filter, consisting of an NiSO4 element sandwiched between two UG-11 glass filters, is fixed between the exit slit and the PMT to block radiation at wavelengths longer than about 325 nm. Because the radiation is not focused on the surface of the filter, radiation passing through different exit slits hits different parts of the filter (SCI-TEC Instruments Inc., Citation1999a).
The Brewer MKIV is capable of performing nitrogen dioxide (NO2) retrieval because it has a different grating and filter configuration than the Brewer MKII. The grating of the Brewer MKIV is used in the third diffraction order in ozone retrievals and the second diffraction order in NO2 retrievals. Instead of a fixed solar-blind filter, the Brewer MKIV has a filter wheel behind the exit slit that has a visible-light-blocking UG-11 filter, an NiSO4/UG-11 filter for ozone retrieval, and a UV blocking BG-12 filter for NO2 retrieval (SCI-TEC Instruments Inc., Citation1999b). The Brewer MKIII is used in the first diffraction order in the UV (Kipp & Zonen, Citation2015). The instrument does not feature bandwidth limiting filters behind the exit slit because the double-monochromator provides enough stray light rejection for UV measurements and ozone retrievals.
3 Stray light measurements
a Measurement Setup for Characterization of the Brewer MKII #037
The stray light properties of the Brewer MKII #037 spectrophotometer of the Finnish Meteorological Institute (FMI) were measured using the setup at Aalto University shown in . In order to study the stray light at several wavelengths, three lasers were used: an HeCd laser (wavelengths 325 and 442 nm); a diode laser (405 nm); and a krypton-argon (KrAr) laser (476, 488, 514, 521, 531, 568, and 647 nm). The stability of the laser power was monitored using a beam sampler and a photodiode. The optical power level of each laser line was measured by placing a reference detector, a pyroelectric radiometer, in front of the laser beam before and after each Brewer measurement.
Fig. 2 Measurement setup at Aalto University for the out-of-range stray light characterization of the FMI’s Brewer MKII spectrophotometer.
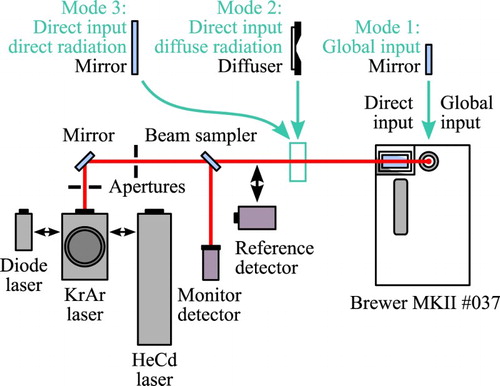
Three measurement geometries were used in the stray light characterization. In measurement mode 1, the laser beam was directed at the centre of the global diffuser input of the Brewer instrument perpendicular to the surface using a mirror placed on top of the instrument. In mode 2, an auxiliary transmitting diffuser plate was placed in front of the laser beam, and the direct input of the Brewer instrument was aimed at the illuminated spot on the opposite side of the diffuser. In mode 3, the laser beam was aimed at the direct port of the Brewer instrument using a mirror. In the third measurement mode, the internal diffuser of the filter wheel of the Brewer foreoptics (see ) was utilized. Measurements were carried out with all three lasers in mode 1, but in modes 2 and 3 only the HeCd laser at 325 and 442 nm wavelengths was utilized. This was done because of time limitations and, in the case of mode 3, because alignment of the laser beam and the direct input of the instrument could only be achieved with help of the in-range wavelength. In each out-of-range measurement, the wavelength range was scanned from 290 to 327 nm in 1 nm steps. The slit function at 325 nm was scanned in three parts using different slits to cover a wider wavelength range than would be possible with a single slit. Slit 1 of the slit mask was used for the short wavelength side (290–323 nm) and slit 5 for the long wavelength side (327–338 nm). Additionally, the region around the peak of the slit function (323–327 nm) was measured in 0.05 nm wavelengths steps, with an internal ND filter of the filter wheel of the Brewer foreoptics attenuating the signal.
b Measurement Setup for Characterization of the Brewer MKII #030
The stray light properties of the Brewer MKII #030 spectrophotometer of the Deutscher Wetterdienst were measured at the Physikalisch-Technische Bundesanstalt (PTB) tunable laser facility (Winter et al., Citation2014) using the setup shown in . A frequency-doubled and frequency-tripled mode-locked titanium-sapphire laser (120 fs pulses at 80 MHz repetition rate) formed a radiation source tuneable in the UV and visible wavelength ranges used for the measurements. The bandwidth of the radiation source was approximately 1.3 nm in the UV region. The output power of the laser system was attenuated, according to the needs of the instrument, using an ND filter. The radiation was directed to an integrating sphere placed on top of the global port of the Brewer instrument via a liquid light guide. A photodiode with known spectral responsivity placed in one of the ports of the integrating sphere was used to monitor the signal level.
Fig. 3 Measurement setup of PTB facility for the out-of-range stray light characterization of the Brewer MKII spectrophotometer of DWD.
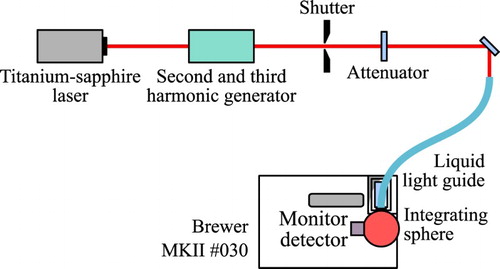
The measurements were carried out using several in-range (295, 310, and 320 nm) and out-of-range (330, 338, 350, 400, and 500 nm) wavelengths. To make sure that the fluorescence of the integrating sphere did not affect the stray light characterization of the Brewer instrument, measurements at 310 nm were repeated with the laser beam irradiating the global port directly, without the use of the integrating sphere.
c Measurement Results
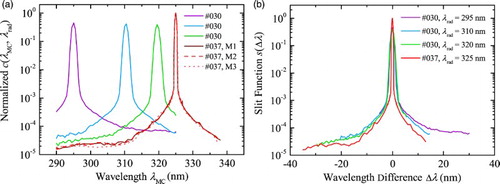
a shows the readings of the spectrophotometers studied as a function of monochromator wavelength
measured at discrete in-range radiation wavelengths
. To account for the differences in bandwidths of the sources in the two characterization setups and to enable direct comparison of the stray light suppression properties (i.e., the out-of-band regions of the slit functions), the integrals of counts around the measured peaks were used as the basis of the normalization. The curves were then scaled such that the peak value for instrument #037 results at
nm was unity.
Fig. 4 (a) Normalized measured counts and (b) slit functions of the Brewer MKII spectrophotometers #030 and #037 at different radiation wavelengths and, in the case of #037, at different measurement modes (see ).
The measured counts can be expressed as(1) where
is the responsivity of the instrument,
is the integration time,
is the spectral irradiance level of the radiation, and
is the slit function of the instrument. The slit function has a value of one at
(0 nm) and typically decreases as the wavelength difference
increases. To simplify the analysis, in Eq. (1), the slit function is assumed to retain its shape at different radiation wavelengths. Because some wavelength-dependent changes in the out-of-band regions of the slit functions are visible in , further measurements and wavelength-dependent slit function analysis should be carried out in the future, in order to determine the effect of this phenomenon on the stray light correction.
b shows the slit functions measured at different in-range radiation wavelengths
. The slit functions are normalized using a scheme similar to the one described for a. The peaks of the slit functions of Brewer #030 appear wider than those of the Brewer #037 because of the wider bandwidth of the source used in the stray light characterizations of the Brewer #030. Outside the centre regions (out-of-band) of the slit functions, the signal levels of the two instruments are of similar magnitude. The shape of the long wavelength tails of the Brewer #030 also varies depending on the source wavelength, with a difference of about
at
nm between the radiation wavelengths of
nm and
nm. This difference can be caused by changes in the dispersive properties of the grating at different wavelengths.
illustrates how radiation at several fixed wavelengths entering the instruments affects the readings at different monochromator grating positions corresponding to . To express the effect of radiation at different wavelengths on the signal at a fixed monochromator position
, the following stray light function can be used:
(2) where the division by
normalizes the value to one when
. The last part of the equation can be used when there are measurement data at a monochromator position
for a given radiation wavelength
. When
is multiplied by the spectral irradiance
of the source and integrated over the spectral responsivity range of the instrument, the cumulative effect of radiation at a given monochromator wavelength
can be determined.
When is assumed to retain its shape at different radiation wavelengths
, the in-range measurements of at discrete radiation wavelengths
can be used to estimate the effect of radiation at an arbitrary wavelength
on the signal at monochromator position
, as
(3) The equation is derived by considering the level of
—originally measured at
—at a distance
from the peak, shifting the function so that the peak is at
, and taking into account the instrument responsivities at different wavelengths.
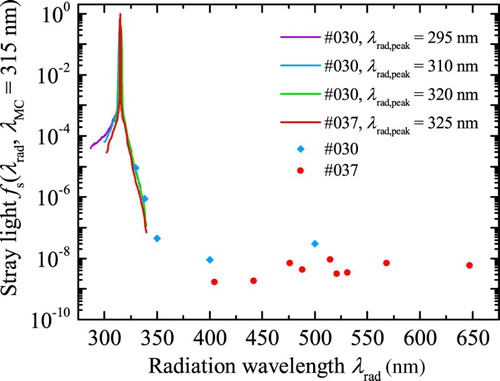
shows the stray light of the Brewer spectrophotometer as a function of radiation wavelength at a fixed monochromator wavelength of
nm. This wavelength was chosen because it is in the middle of the wavelength region of interest for ozone measurements. The continuous parts of the figure were calculated with Eq. (3) based on the slit function measurements of . The spectral responsivity of Brewer #037—measured up to about 340 nm in Karppinen et al. (Citation2015)—was used as the responsivity for both instruments. In reality, the stray light functions are affected by the potential differences in spectral responsivities. The discrete points at longer wavelengths were derived from Eq. (2) based on the out-of-range measurements of the instruments. Some increase in signal level compared with the noise-floor of the measurement was observed in the measurement at 330 nm because this wavelength was still within the transition band of the solar-blind filter of the Brewer instruments. All the measurements at out-of-range wavelengths from 338 nm up to 647 nm were noise-limited (i.e., no signal above the dark signal level was observed in the scanning range of the instruments). Therefore, the standard deviation of the measurement noise was used as the worst-case estimate of the reading
(315 nm,
), and, in reality, the stray light levels are likely to be significantly lower than the discrete values above 338 nm. The observed variation in out-of-range stray light levels was caused by the differences in the laser power levels at each wavelength.
Fig. 5 Stray light of the Brewer spectrophotometer at a fixed monochromator position of nm as a function of the radiation wavelength. The data points at out-of-range wavelengths are estimated from the measurements that were noise limited and should be treated as worst-case estimates only.
4 Solar-blind filter characterization
To further analyze the out-of-range stray light properties of the single-monochromator Brewer instruments, the transmittances of the visible light blocking solar-blind filters were measured as a function of both wavelength and position. One unused and three used filters were studied for this purpose.
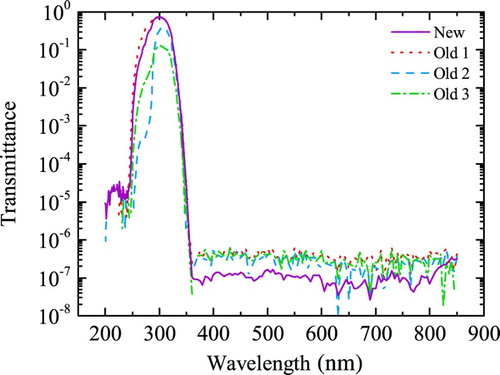
The spectral transmittances of the filters are presented in . The transmittances were measured using a commercial spectrophotometer, PerkinElmer Lambda 900. To increase the signal-to-noise ratio in the stopband of the instrument, the wavelength range between 340 and 850 nm was measured in cascade mode, where the transmittance of the filter under study was compared with that of an ND filter with a known transmittance of approximately 1%. Because of this, the noise floor is about two orders of magnitude smaller in the long wavelength stopband than in the short wavelength stopband. Although the spectral transmittances in the passbands of the filters differed noticeably, no stopband leaks above the noise floor of the measurement—between about 10−7 and 10−6 depending on the measurement—were detected for wavelengths above 360 nm for any of the filters.
Fig. 6 Spectral transmittances of four solar-blind filters of Brewer spectrophotometers.
The spatial transmittances of the filters were measured in the laser setup designed for characterizing optical components (Vaskuri, Kärhä, Heikkilä, & Ikonen, Citation2015). An HeCd laser at a wavelength of 325 nm was used as the radiation source. The 1/e2 diameter of the beam was 1.6 mm. The filter under study was mounted on an XY-translator, and the area of the filter was scanned along two perpendicular axes at 0.5 mm intervals. An integrating sphere with a photodiode was used to measure radiation that was transmitted through the filter.
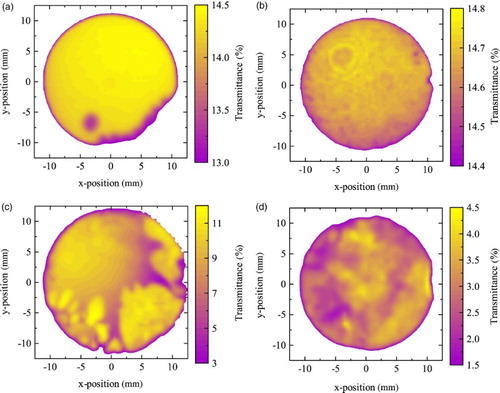
The results of the spatial transmittance measurements are shown in . As can be seen in a the transmittance of the unused filter is relatively uniform in the centre region of the filter, with a standard deviation of 0.36% in the mm2 square around the centre of the filter. The drop in transmittance of about 10% compared with the centre is likely caused by non-uniformity in the NiSO4 structure within the filter assembly because the surfaces of the UG-11 elements had no visible defects that could explain the drop in transmittance. One of the used filters exhibits relatively good spatial uniformity (b), with a standard deviation of 0.17% in the centre region and no significant defects in the entire region of the filter. The other two used filters exhibit significant spatial non-uniformities, as seen in c and d, with standard deviations of 14% and 13%, respectively, in the centre region of the filter. Again, because the surfaces of the UG-11 elements are visually relatively uniform, it is likely that the non-uniformity is the result of changes in the density of the NiSO4 within the filter structure.
Fig. 7 Spatial transmittances of solar-blind filters of single-monochromator Brewer spectroradiometers. Note the different colour scales between the different filters: (a) new, (b) old 1, (c) old 2, and (d) old 3.
Changes in the uniformity of the solar-blind filter are unlikely to cause issues as long as the output of the system is monitored regularly using the internal standard lamp of the instrument and deviations in the results are detected and interpreted properly. If the density of the NiSO4 is very low at the centre region of the filter, the stopband blocking will mostly depend on the properties of the UG-11 filters. This decreases the stopband blocking overall. In addition, UG-11 filters have a secondary passband at around 720 nm. Although this leak is unlikely to cause noticeable stray light with PMTs that are sensitive up to about 650 nm, problems may arise if the instrument is retrofitted with a PMT that is sensitive at longer wavelengths. Furthermore, if there are large gradients in the transmittance profile in the centre region of the filter, then any changes in the location of the illuminated spot on the filter, such as poor mechanical stability, movement caused by thermal expansion, or, in case of the Brewer MKIV, poor repeatability of the positioning of the filter wheel, could lead to increased measurement uncertainty. These types of issues are detected in standard lamp tests as increased variability of the results.
5 Analyzing the effect of out-of-range stray light
The out-of-range stray light properties of the Brewer spectrophotometer were analyzed based on the results of the slit function and the solar-blind filter transmittance measurements. Because the spectral responsivity of Brewer MKII instruments can be determined directly in a limited wavelength range—between approximately 290 and 340 nm—the spectral responsivity of the instrument was assumed to consist of the transmittance of the solar-blind filter (filter “new” of ) and the nominal spectral responsivity of a type of PMT used in a portion of Brewer MKII instruments, including Brewer #037 (ET Enterprises, Citation2010). The nominal spectral responsivity of the PMT was highest at about 350 nm and dropped to 1% and below above 600 nm. Because the spectral responsivity of the PMT was relatively flat around the passband of the instrument, the overall shape of the spectral responsivity was largely defined by the transmittance of the filter. The effect of other optical components on the spectral responsivity was ignored in this simplified analysis. The slit function of the instrument
was assumed to have the shape of the slit function of measured at 325 nm, with a constant base level of
outside the peak region. The slit function was assumed to retain its shape at all radiation wavelengths. The spectral irradiance of the calibration source
was assumed to be that of a typical incandescent lamp.
For the simulation, the direct solar spectral irradiances at different solar zenith angles
were obtained using the radiative transfer library libRadtran (Mayer & Kylling, Citation2005) with the “sdisort solver” (Dahlback & Stamnes, Citation1991; Stamnes, Tsay, Wiscombe, & Jayaweera, Citation1988) and Bass and Paur (Citation1985) ozone absorption cross-sections. Atmospheric temperature and pressure, as well as air and trace gas density profiles were assumed to be those of the US Standard model of Anderson, Clough, Kneizys, Chetwynd, and Shettle (Citation1986) with total ozone column (TOC) of about 340 Dobson Units (DU). The extraterrestrial solar spectral irradiance was a combination of Atlas data (Woods et al., Citation1996), from 200 to 420 nm, and Kurucz (Citation1995) data (referred to as Modtran data in libRadtran) from 420 to 800 nm.
The measured spectral irradiance in the presence of stray light was calculated as
(4) where the spectral irradiances of both sources are weighted by the responsivity of the instrument and convolved with the slit function
. It should be noted that this analysis ignores the potential signal contributions from other diffraction orders of the grating (e.g., the first-order diffraction of 580–680 nm overlapping with the measurement range of the Brewer MKII operated in the second diffraction order).
The correction of stray light was simulated by calculating the convolution of Eq. (4) for both sources only for wavelengths that were outside the wavelength range of the correction (i.e., above the cutoff wavelength ). The resulting stray light contributions were then summed to the ideal weighted spectral irradiances below
, and above the cutoff wavelength, the convolution results were used directly. The stray-light-corrected spectral irradiance was then calculated from the ratio of the data of the two sources similar to Eq. (4). This type of calculation ignores the uncertainties associated with deconvolution analysis carried out on the real measurement data using an imperfect estimate of the slit scattering function (i.e., the only source of error in the simulated correction comes from the limited wavelength range of the deconvolution).
shows the simulated effect of the cutoff wavelength of the stray light correction on the direct solar spectral irradiances determined from the single-monochromator Brewer measurements. In a and b, the solar zenith angle was
, which corresponds to an air mass factor of approximately 1.6. In c and d, the corresponding values were
and an air mass factor of approximately 3.8. In addition to the effect of cutoff wavelength, the effect of imperfections in the slit function determination was also tested by calculating the stray light correction with the assumption that the base level of
was
, as opposed to
, for the case of
nm. The somewhat non-intuitive feature whereby the spectral irradiances with no stray light correction were below the ideal solar spectral irradiance in certain wavelength regions is explained by the fact that stray light also affects the measurement of the calibration source. The noise-like features in the relative errors of the measurements with no stray light correction and with a correction up to
nm (b and d), are caused by the smoothing of the sharp features of the spectra during the convolution. This effect is not present below
in this simulation because the deconvolution is ideal. To reduce the noisiness and to increase the readability of b and d, both the measured and the ideal spectra were convolved with the centre part of the slit function (full-width at half maximum of about 0.55 nm) of the instrument.
Fig. 8 Simulated effect of the cutoff wavelength of stray light correction on the result of the spectral acquisition at different solar zenith angles (a) θs = 50°, (b) θs = 50°, relative error, (c) θs = 75°, (d) θs = 75°, relative error. In the case of error, the base level of the slit function was assumed to be
during the correction, as opposed to
.
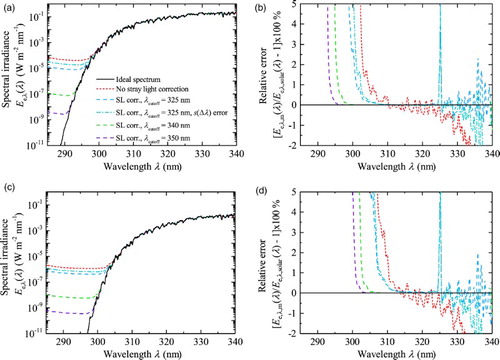
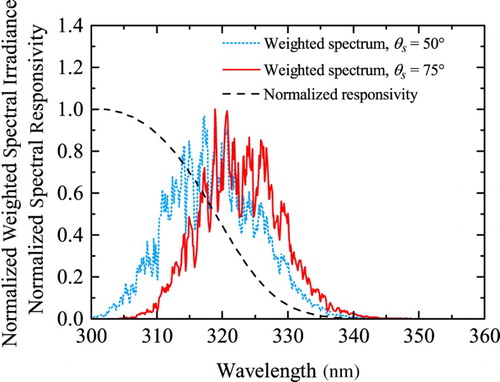
It is evident from that increasing the wavelength range of the stray light correction continuously reduces the error associated with stray light. Stray light errors are still significant at low wavelengths and high solar zenith angles if only wavelengths up to the nominal edge of the measurement range of the instrument, 325 nm, are considered. The reason for this behaviour is illustrated in , which shows the normalized spectral irradiances at two solar zenith angles weighted by the instrument responsivity. A significant part of the weighted spectral irradiance lies at wavelengths above 325 nm—20% and 37% at and
, respectively—thus contributing to the residual stray light if the correction is not extended to higher wavelengths. When more of the short wavelength radiation is absorbed by the ozone content, for example, due to a larger solar zenith angle, a greater portion of the weighted spectral irradiance will reside at wavelengths above 325 nm, thus increasing the residual stray light. On the other hand, only a small portion of the weighted irradiance lies beyond 340 nm—0.2% and 0.5% at
and
, respectively—which means that extending the stray light correction beyond this wavelength is unlikely to meaningfully decrease the overall uncertainty of the measurement because other sources of uncertainty, such as imperfections in the deconvolution and poor signal-to-noise ratio, start to dominate.
Fig. 9 Direct solar spectral irradiances at different solar zenith angles weighted by the simulated responsivity of the Brewer MKII instrument.
The effect of stray light on the ozone retrieval was studied by calculating the TOC values from the simulated spectra of as well as similarly produced spectra at and
using the four-wavelength method commonly utilized in Brewer ozone retrievals (Kerr et al., Citation1981). In the analysis, the ozone absorption and Rayleigh scattering coefficients, as well as the solar spectral irradiances were first convolved with the centre part of the measured slit function of the Brewer instrument. The relative errors in TOC retrieval compared with ideal retrieval are shown in for solar zenith angles of 50°, 75°, 80°, and 85°.
Table 1. Relative error in TOC retrieval compared with the ideal case at different solar zenith angles and cutoff wavelengths for stray light correction. Also included are the cases for which the stray light is left uncorrected and the case when there is an error in slit function determination (i.e., the base level of  was assumed to be , as opposed to ).
6 Conclusions
The stray light properties of two Brewer MKII instruments, #030 and #037, were characterized at both in- and out-of-range wavelengths, using measurement setups based on a tunable laser and multiple discrete lasers, respectively. No stray light above the noise floor of the measurements was observed at any of the tested radiation wavelengths above 338 nm. Some differences were observed in the out-of-band regions of the slit functions between different instruments and at different wavelengths.
Additionally, several band-limiting solar-blind filters were characterized for spectral and spatial transmittances. No leaks were found in the stopband of the filters. Significant spatial non-uniformities were discovered in some of the filters—both old and new ones—with standard deviations in the mm2 centre region reaching 14%, suggesting variations in the NiSO4 density within the filter. A decrease in the NiSO4 within the centre region of the filter can lead to degradation in the stopband blocking of the filter.
The effect of different wavelength regions on the overall stray light of Brewer MKII instruments was studied by simulations. In the simplified model of the Brewer, the spectral responsivity was constructed from the measured spectral transmittance of the solar-blind filter and the responsivity of a typical PMT. The slit function was constructed from the previously measured slit function with an assumption that a constant base-level of compared with the peak value is maintained at the far regions. Based on the simulations, the out-of-range stray light from wavelengths above 340 nm is unlikely to cause issues in UV measurements in practice because other sources of uncertainty will dominate the residual stray light contribution. On the other hand, the simulations also show that a considerable portion of the stray light will remain uncorrected if the correction is carried out only up to the nominal edge of the measurement range of the instrument, which is 325 nm, as specified in the instrument manual (SCI-TEC Instruments Inc., Citation1999a).
The effect of stray light on the ozone retrieval was simulated by calculating the TOC values with the four-wavelength method used by the Brewer instrument using the simulated spectral irradiances as the input. As an example, at the specific simulation conditions and with a solar zenith angle of , the relative errors compared with the ozone values calculated from the ideal spectrum were −1.6%, −0.3%, and −0.004% for retrieved spectra with no correction, and with corrections up to
nm and
nm, respectively. In general, the relative error in ozone retrieval caused by stray light increases with longer slant paths because the portion of short wavelength UV decreases due to increased ozone absorption.
While the out-of-range stray light from wavelengths beyond 340 nm is unlikely to affect the UV measurement and ozone retrieval results in practice, it is recommended that the stray light in the transition band beyond the nominal edge of the measurement range of 325 nm be considered and corrected for. To account for the contribution from the transition band in some deconvolution-based stray light correction methods in which the analysis is extended only up to a wavelength of 325 nm, additional stray light removal steps, such as subtracting the signal level at the lowest measurable wavelengths from the signal at all wavelengths, are utilized (Fioletov et al., Citation2000; Kerr, Citation2002). Nevertheless, because the signal can be measured up to at least 338 nm using a single-monochromator Brewer, an adequate stray light correction in the transition band may also be possible using a purely deconvolution-based method, when a sufficiently wide wavelength range is utilized, provided that the signal-to-noise ratio remains high enough for the determination of spectral irradiance and instrument responsivity beyond 325 nm. It should be noted that, in addition to the wavelength range over which the correction is calculated, the quality of the stray light correction is also affected by the quality of the slit function and instrument spectral responsivity characterizations. Moreover, the shape of the slit function may change at different radiation wavelengths as indicated by the laser-based characterizations of this study. The effect of this wavelength dependence on the deconvolution needs to be studied further. The findings suggest that future slit function characterization setups of single-monochromator Brewer instruments should provide several monochromatic lines within pass- and transition bands of the instruments (i.e., wavelengths below about 360 nm) with one or more high-intensity lines at longer wavelengths to test the quality of the solar-blind filter. If this type of setup can be made portable (e.g., by using diode lasers or compact monochromator systems) several Brewer instruments could be characterized during field campaigns and the results compared. The recommended interval between subsequent stray light characterizations depends on the long-term stability of the stray light properties of the instruments.
Acknowledgements
The authors would like to thank Juan Ramón Moreta of AEMET for providing a used solar-blind filter for the characterization.
Disclosure Statement
No potential conflict of interest was reported by the authors.
ORCID
T. Pulli http://orcid.org/0000-0003-1416-2257
Additional information
Funding
References
- Anderson, G., Clough, S., Kneizys, F., Chetwynd, J., & Shettle, E. (1986). AFGL atmospheric constituent profiles (0–120 km) (Tech. Rep. No. AFGL-TR-86-0110). Air Force Geophys. Lab., Hanscom Air Force Base, Massachusetts, USA.
- Bais, A. F. (1997). Absolute spectral measurements of direct solar ultraviolet irradiance with a Brewer spectrophotometer. Applied Optics, 36(21), 5199–5204. doi: 10.1364/AO.36.005199
- Bais, A. F., Zerefos, C. S., & McElroy, C. T. (1996). Solar UVB measurements with the double- and single-monochromator Brewer ozone spectrophotometers. Geophysical Research Letters, 23(8), 833–836. doi: 10.1029/96GL00842
- Basher, R. E. (1985). Review of the Dobson spectrophotometer and its accuracy. In C. Zerefos, & A. Ghazi (Eds.), Atmospheric ozone, Proc. of the quadrennial ozone symposium, Halkidiki, Greece, 3–7 September, 1984 (pp. 387–391). Dordrecht, Holland: Reidel Publishing Company.
- Bass, A. M., & Paur, R. J. (1985). The ultraviolet cross-sections of ozone: I. The measurements. In C. Zerefos, & A. Ghazi (Eds.), Atmospheric ozone, Proc. of the quadrennial ozone symposium, Halkidiki, Greece, 3–7 September, 1984 (pp. 606–610). Dordrecht, Holland: Reidel Publishing Company.
- Dahlback, A., & Stamnes, K. (1991). A new spherical model for computing the radiation field available for photolysis and heating at twilight. Planetary and Space Science, 39(5), 671–683. doi: 10.1016/0032-0633(91)90061-E
- de Backer, H., & de Muer, D. (1991). Intercomparison of total ozone data measured with Dobson and Brewer ozone spectrophotometers at Uccle (Belgium) from January 1984 to March 1991, including zenith sky observations. Journal of Geophysical Research, 96(D11), 20711–20719. doi: 10.1029/91JD02159
- de Gruijl, F. (1999). Skin cancer and solar UV radiation. European Journal of Cancer, 35(14), 2003–2009. doi: 10.1016/S0959-8049(99)00283-X
- Dobson, G. M. B. (1931). A photoelectric spectrophotometer for measuring the amount of atmospheric ozone. Proceedings of the Physical Society, 43(3), 324–339. doi: 10.1088/0959-5309/43/3/308
- Eleftheratos, K., Kazadzis, S., Zerefos, C. S., Tourpali, K., Meleti, C., Balis, D., … Karhu, J. M. (2015). Ozone and spectroradiometric UV changes in the past 20 years over high latitudes. Atmosphere-Ocean, 53(1), 117–125. doi: 10.1080/07055900.2014.919897
- ET Enterprises. (2010). 29 mm (1.13”) photomultiplier - 9125B series data sheet. Issue 9. Retrieved from https://my.et-enterprises.com/pdf/9125B.pdf
- Farman, J. C., Gardiner, B. G., & Shanklin, J. D. (1985). Large losses of total ozone in Antarctica reveal seasonal ClOx/NOx interaction. Nature, 315, 207–210. doi: 10.1038/315207a0
- Fioletov, V. E., Kerr, J. B., & Wardle, D. I. (1997). The relationship between total ozone and spectral UV irradiance from Brewer observations and its use for derivation of total ozone from UV measurements. Geophysical Research Letters, 24(23), 2997–3000. doi: 10.1029/97GL53153
- Fioletov, V. E., Kerr, J. B., Wardle, D. I., & Wu, E. (2000). Correction of stray light for the Brewer single monochromator. In R. D. Bojkov, & K. Shibasaki (Eds.), Proc. of the quadrennial ozone symposium, Sapporo, Japan, 3–8 July, 2000 (pp. 369–370).
- Fioletov, V. E., McArthur, L. J. B., Kerr, J. B., & Wardle, D. I. (2001). Long-term variations of UV-B irradiance over Canada estimated from Brewer observations and derived from ozone and pyranometer measurements. Journal of Geophysical Research: Atmospheres, 106(D19), 23009–23027. doi: 10.1029/2001JD000367
- Gantner, L., Winkler, P., & Köhler, U. (2000). A method to derive long-term time series and trends of UV-B radiation (1968–1997) from observations at Hohenpeissenberg (Bavaria). Journal of Geophysical Research: Atmospheres, 105(D4), 4879–4888. doi: 10.1029/1999JD900907
- Gröbner, J., Blumthaler, M., Kazadzis, S., Bais, A., Webb, A., Schreder, J., … Rembges, D. (2006). Quality assurance of spectral solar UV measurements: Results from 25 UV monitoring sites in Europe, 2002 to 2004. Metrologia, 43, S66–S71. doi: 10.1088/0026-1394/43/2/S14
- International Ozone Services Inc. (2017). Calibrations. Retrieved from http://www.io3.ca/calibrations
- Karppinen, T., Redondas, A., García, R. D., Lakkala, K., McElroy, C. T., & Kyrö, E. (2015). Compensating for the effects of stray light in single-monochromator Brewer spectrophotometer ozone retrieval. Atmosphere-Ocean, 53(1), 66–73. doi: 10.1080/07055900.2013.871499
- Kerr, J. B. (2002). New methodology for deriving total ozone and other atmospheric variables from Brewer spectrophotometer direct sun spectra. Journal of Geophysical Research: Atmospheres, 107(D23), ACH 22-1–ACH 22-17. doi: 10.1029/2001JD001227
- Kerr, J. B., Asbridge, I. A., & Evans, W. F. J. (1988). Intercomparison of total ozone measured by the Brewer and Dobson spectrophotometers at Toronto. Journal of Geophysical Research, 93(D9), 11129–11140. doi: 10.1029/JD093iD09p11129
- Kerr, J. B., & McElroy, C. T. (1993). Evidence for large upward trends of ultraviolet-B radiation linked to ozone depletion. Science, 262(5136), 1032–1034. doi: 10.1126/science.262.5136.1032
- Kerr, J. B., McElroy, C. T., & Olafson, R. A. (1981). Measurements of ozone with the Brewer ozone spectrophotometer. In J. London (Ed.), Proc. of the quadrennial ozone symposium, Boulder, Colorado, USA, 4–9 August 1980 (pp. 74–79). Boulder, CO: NCAR.
- Kerr, J. B., McElroy, C. T., & Wardle, D. I. (1987). Grating ozone spectrophotometer. (U.S. Patent: 4 652 761 A).
- Kerr, J. B., McElroy, C. T., Wardle, D. I., Olafson, R. A., & Evans, W. F. J. (1985). The automated Brewer spectrophotometer. In C. S. Zerefos, & A. Ghazi (Eds.), Atmospheric ozone, Proc. of the quadrennial ozone symposium, Halkidiki, Greece, 3–7 September 1984 (pp. 396–401). Dordrecht, Holland: Reidel Publishing Company.
- Kiedron, P., Disterhoft, P., & Lantz, K. (2008). Stray light correction (Tech. Rep.). NOAA-EPA Brewer Network. Retrieved from http://www.esrl.nova.gov/gmd/neubrew/docs/StrayLightCorrection.pdf
- Kipp & Zonen. (2015). BREWER MKIII spectrophotometer operator’s manual. Revision F, Delft, Netherlands.
- Kipp & Zonen. (2017). Brewer spectrophotometer. Retrieved from http://kippzonen-brewer.com
- Kurucz, R. L. (1995). The solar irradiance by computation. In G. P. Anderson, R. H. Picard, & J. H. Chetwyn (Eds.), Proc. of the 17th annual review conference on atmospheric transmission models, Phillips Laboratory/Geophysics Directorate, Massachusetts, USA, 7 June, 1994 (pp. 333–334), Virginia, US: Defense Technical Information Center.
- Lantz, K., Disterhoft, P., Early, E., Thompson, A., DeLuisi, J., Berndt, J., … Beaubien, A. (2002). The 1997 North American interagency intercomparison of ultraviolet spectroradiometers including narrowband filter radiometers. Journal of Research of the National Institute of Standards and Technology, 107(1), 19–62. doi: 10.6028/jres.107.006
- Lucas, R., McMichael, T., Smith, W., & Armstrong, B. (2006). Solar ultraviolet radiation: Global burden of disease from solar ultraviolet radiation. In A. Prüss-Üstün, H. Zeeb, C. Mathers, & M. Repachol (Eds.), Environmental burden of disease series.
- Mayer, B., & Kylling, A. (2005). Technical note: The libRadtran software package for radiative transfer calculations - description and examples of use. Atmospheric Chemistry and Physics, 5, 1855–1877. doi: 10.5194/acp-5-1855-2005
- Molina, M. J., & Rowland, F. S. (1974). Stratospheric sink for chlorofluoromethanes: Chlorine atom-catalysed destruction of ozone. Nature, 249, 810–812. doi: 10.1038/249810a0
- Petropavlovskikh, I., Evans, R., McConville, G., Oltmans, S., Quincy, D., Lantz, K., … Flynn, L. (2011). Sensitivity of Dobson and Brewer Umkehr ozone profile retrievals to ozone cross-sections and stray light effects. Atmospheric Measurement Techniques, 4, 1841–1853. doi: 10.5194/amt-4-1841-2011
- Prather, M. J., & Watson, R. (1990). Stratospheric ozone depletion and future levels of atmospheric chlorine and bromine. Nature, 344, 729–734. doi: 10.1038/344729a0
- SCI-TEC Instruments Inc. (1999a). BREWER MKII spectrophotometer operator’s manual. Revision A, Saskatoon, Canada.
- SCI-TEC Instruments Inc. (1999b). BREWER MKIV spectrophotometer operator’s manual. Revision B, Saskatoon, Canada.
- Solomon, S. (1999). Stratospheric ozone depletion: A review of concepts and history. Reviews of Geophysics, 37(3), 275–316. doi: 10.1029/1999RG900008
- Stamnes, K., Tsay, S.-C., Wiscombe, W., & Jayaweera, K. (1988). Numerically stable algorithm for discrete-ordinate-method radiative transfer in multiple scattering and emitting layered media. Applied Optics, 27(12), 2502–2509. doi: 10.1364/AO.27.002502
- UNEP. (2017). Environmental effects of ozone depletion and its interactions with climate change: Progress report, 2016. Photochemical & Photobiological Sciences, 16, 107–145. doi: 10.1039/C7PP90001E
- Vaskuri, A., Kärhä, P., Heikkilä, A., & Ikonen, E. (2015). High-resolution setup for measuring wavelength sensitivity of photoyellowing of translucent materials. Review of Scientific Instruments, 86, 103103-1–103103-8. doi: 10.1063/1.4931682
- Webb, A. (2006). Who, what, where and when—influences on cutaneous vitamin D synthesis. Progress in Biophysics and Molecular Biology, 92, 17–25. doi: 10.1016/j.pbiomolbio.2006.02.004
- Winter, S., Fey, T., Kröger, I., Friedrich, D., Ladner, K., Ortel, B., … Witt, F. (2014). Design, realization and uncertainty analysis of a laser-based primary calibration facility for solar cells at PTB. Measurement, 51, 457–463. doi: 10.1016/j.measurement.2013.12.001
- Woods, T. N., Prinz, D. K., Rottman, G. J., London, J., Crane, P. C., Cebula, R. P., … Reiser, P. A. (1996). Validation of the UARS solar ultraviolet irradiances: Comparison with the ATLAS 1 and 2 measurements. Journal of Geophysical Research: Atmospheres, 101(D6), 9541–9569. doi: 10.1029/96JD00225
- World Meteorological Organization. (2014). Scientific assessment of ozone depletion. Geneva, Switzerland: World Meteorological Organization (WMO).
- Zerefos, C. S., Bais, A. F., Meleti, C., & Ziomas, I. C. (1995). A note on the recent increase of solar UV-B radiation over northern middle latitudes. Geophysical Research Letters, 22(10), 1245–1247. doi: 10.1029/95GL01187