
ABSTRACT
Climate changes over China from the present (1996–2005) to the future (2046–2055) under Representative Concentration Pathways 4.5 (RCP4.5) and Representative Concentration Pathways 8.5 (RCP8.5) scenarios are projected using the Weather Research and Forecasting (WRF) model, version 3.7.1. The WRF model was driven by the Global 6-Hourly Bias-corrected Coupled Model Intercomparison Project, Phase 5 (CMIP5), Community Earth System Model dataset over China with a resolution of 30 km. The results demonstrate that WRF downscaling generally simulates more reliable spatial distributions of surface air temperature and precipitation in China with higher spatial pattern correlations and closer in magnitude to the Community Climate System Model, version 4.0, simulation results, especially near mountain ranges. The WRF projections for temperature and precipitation for the future under the two emission scenarios are compared with the present simulation. Generally stronger warming, both in mean temperature and extreme statistics, is produced by WRF-RCP8.5 than by WRF-RCP4.5. The projections for precipitation changes are more varied with season and region for both scenarios.
RÉSUMÉ
[Traduit par la rédaction] Nous étudions les changements climatiques touchant la Chine, du présent (1996–2005) au futur (2046–2055), selon les versions 4.5 et 8.5 des profils représentatifs d’évolution de concentration, ou RCP4.5 et RCP8.5, et à l’aide de la version 3.7.1 du modèle Weather Research and Forecasting (WRF). Le modèle WRF est piloté par des données mondiales aux 6 heures, corrigées pour le biais. Celles-ci proviennent du modèle du système terrestre communautaire de la cinquième phase du projet d’intercomparaison des modèles couplés (CMIP5). La grille couvre la Chine avec une résolution de 30 km. Les résultats démontrent que la mise à l’échelle inférieure du WRF simule généralement bien, en Chine, la répartition spatiale en surface de la température de l’air et des précipitations. Les corrélations spatiales sont plus fortes et les intensités correspondent davantage aux simulations de la version 4.0 du modèle du système terrestre communautaire, notamment près des chaînes de montagnes. Nous comparons, selon les deux scénarios d’émission, les projections du WRF pour la température et les précipitations futures avec les simulations du présent. Généralement, le WRF-RCP8.5 produit un réchauffement plus intense que le WRF-RCP4.5, tant pour les températures moyennes qu’extrêmes. La projection des précipitations varie davantage avec les saisons et les régions, selon les deux scénarios.
1 Introduction
China is one of the largest countries in the world and a major emitter of greenhouse gases (Piao et al., Citation2010). Because of the variety of fragile ecosystems, large population and economy, and intensive human activity in this region, climate change in China is of critical importance (Bao, Feng, & Wang, Citation2015; Fan, Ma, Yang, Han, & Mahmood, Citation2015; Fan, Ma, Yang, Han, Mahmood, & Zheng, Citation2015; Gao, Xue, Peng, Kang, & Waliser, Citation2011; Yu, Sun, Chen, & Xiang, Citation2015); for example, changes in land cover play an important role in land-surface interactions (Chen, Li, et al., Citation2016; Mahmood et al., Citation2014). Previous studies have shown that China experienced strong warming over the past five decades (Ding et al., Citation2007; Wei & Chen, Citation2009), and the mean temperature has increased by 1.2°C since 1960 (Piao et al., Citation2010). As for future projections, the warming trend will continue; China’s average temperature is estimated to increase by a further 1°–5°C by 2100 (Meehl, et al., Citation2007). Global warming will lead to unprecedented future climate change (Liu, Gao, & Liang, Citation2013). Many studies show that precipitation extremes are very sensitive to a warmer climate (Held & Soden, Citation2006; Karl, Knight, & Plummer, Citation1995; Liu et al., Citation2017; Wood, Lettenmaier, & Palmer, Citation1997), and extreme weather, such as heatwaves, drought, and flooding, will become more frequent under a warmer climate (Chen, Citation2013; Li et al., Citation2017; Sun, Citation2014; Sun, Wang, Yuan, & Chen, Citation2010). Because of China’s vast territory and complex terrain, regional differences in climate change are significant and need to be assessed in detail.
General circulation models (GCMs) provide the basis of our capacity to simulate, understand, and predict climate variability and change, including temperature and precipitation extremes (Meehl, et al., Citation2007). However, because of the coarse resolution of GCMs, which are typically 100 to 300 km (Taylor, Stouffer, & Meehl, Citation2012), it is difficult to represent regional climate processes in GCMs. Although GCMs may capture large-scale circulations reasonably well, they also produce regional biases in summer rainfall distributions (Kang et al., Citation2002; Liang, Wang, & Samel, Citation2001; Wang, Liang, & Samel, Citation2011; Zhou & Li, Citation2002), as well as surface air temperature spatial distributions (Zhou & Yu, Citation2006). The biases will limit the credibility of GCM future climate change projections at regional scales. Dynamical downscaling using GCM output is widely used to drive regional climate models (RCMs) because of their skill enhancement over GCMs due to their higher resolution and better representation of physical processes (e.g., Gao, Xu, Zhao, Pal, & Giorgi, Citation2006; Han & Roads, Citation2004; Liang et al., Citation2012, Liang, Li, Dai, & Kunkel, Citation2004; Liang, Li, Kunkel, Ting, & Wang, Citation2004).
Like all GCMs, the Community Earth System Model (CESM) contains regional scale biases because of its coarse spatial resolution and limited representation of some physical processes. Transmission of biases from GCMs to RCMs through the lower and lateral boundaries may degrade the interior regional scale climate simulation. Such biases can adversely affect the dynamical downscaling process and contribute to uncertainty. To remedy these biases, it is common to bias correct climate model outputs before using them to drive regional scale models like the Weather Research and Forecasting model (WRF; e.g., Done, PaiMazumder, Towler, & Kishtawal, Citation2015; Rasmussen et al., Citation2011; Xu & Yang, Citation2012).
Bias correction for CESM output can reduce the propagation of known biases into RCMs, which can degrade the dynamical downscaling process, as well as contribute to and complicate the uncertainty in regional climate projection. Without bias correction, most earlier dynamical downscaling simulations directly based on the Coupled Model Intercomparison Project, Phase 3 (CMIP3) or Phase 5 (CMIP5) outputs demonstrated that China is at risk from heavy rainfall, heatwaves, and drought (Su, Gemmer, & Jiang, Citation2008; Wei & Chen, Citation2009; Zhai, Zhang, Wan, & Pan, Citation2005). Large uncertainty in future projections of precipitation by the Intergovernmental Panel on Climate Change climate models necessitates bias corrections for the global climate model output before dynamical downscaling to obtain better regional climate projections.
The aim of this study is to enhance the understanding of climate change on a regional scale by using the regional WRF climate model to investigate climate change impacts in China and improve the representation of subgrid-scale processes by GCMs. We used the WRF model to dynamically downscale future climate projections from CESM after bias corrections under two future emission (representative concentration pathway (RCP)) scenarios. In Section 2, the details of the data and methodology are described. Section 3 systematically evaluates the performance of the downscaled outputs on the estimation of climate extremes over China, then the estimates for the future changes in temperature and precipitation extremes are determined. Section 4 discusses and summarizes the results.
2 Data and method
a Model configuration
This study chooses a widely used regional climate model WRF, version 3.7.1, to dynamically downscale GCM outputs. The WRF model can simulate weather systems with spatial scales ranging from a few metres to thousands of kilometres and is suitable for both operational forecasting and atmospheric research (Skamarock & Klemp, Citation2008). The physical parameterization schemes in the WRF model are as follows: the Advanced Research WRF (ARW) version of WRF, the Noah land-surface model (Chen & Dudhia, Citation2001), the new Kain-Fritsch convective parameterization scheme (Kain, Citation2004), the WRF single-moment 6-class (WSM6) microphysics scheme (Hong & Lim, Citation2006), the Yonsei University counter-gradient boundary layer turbulence transfer scheme (Hong, Noh, & Dudhia, Citation2006), and the community atmospheric model radiative transfer scheme (Collins et al., Citation2004). All the physical parameterization schemes are the same as in Chen, Li, et al. (Citation2016). The model domain covers continental China and its surrounding areas. The centre of the domain is located at 37°N, 102.5°E with northern and southern boundaries at 55°N and 15°N, respectively. The horizontal resolution is 30 km with 175 grid points in the east–west direction and 151 grid points in the north–south direction. The top of the model is set at 50 hPa with 37 vertical atmospheric levels (). The time step is set to 180 s in order to match the spatial resolution. The spatial resolution in this study has been adopted in many previous studies that employ WRF climate downscaling over China (e.g., Chen, Ma, et al., Citation2016), which have shown that the WRF model with such spatial resolution is able to capture the land–atmosphere interactions over China. The lateral boundary and initial conditions of the simulations are from the global 6-hourly bias-corrected CMIP5 CESM (Bruyère, Done, Holland, & Fredrick, Citation2014) dataset, which is generated based on output from the Community Climate System Model, version 4.0 (CCSM4), ensemble member #6, for each scenario in the CMIP5 archive. Compared with other CMIP5 GCMs, CESM performs best in terms of simulating observed temperature and precipitation at the global scale (Knutti & Sedlacek, Citation2013) and also performs well in simulating climate variability in China (Chen & Frauenfeld, Citation2014). Therefore, it likely provides relatively robust boundary conditions for the WRF regional climate model. Because of their coarse resolution and limited representation of certain physical processes (Chen & Frauenfeld, Citation2014), GCMs contain biases at the regional scale that will affect the quality of the dynamical downscaling. In the Monaghan et al. (2014) dataset, the European Centre for Medium-range Weather Forecasts (ECMWF)’s Interim Reanalysis (ERA-Interim; Dee et al., Citation2011) was used for bias correction, for which the bias-corrected CESM output is generated by summing the 1981–2005 average 6-hourly annual cycle from ERA-Interim with a 6-hourly perturbation term from CESM (Bruyère et al., Citation2014). The variables that are bias-corrected include lower boundary conditions, such as surface temperature, pressure, sea surface temperature, sea-ice concentration, boundary layer wind, and lateral boundary conditions, such as upper-level winds, temperature, and geopotential heights. In this study, we conducted three 11-year experiments to investigate the impact of climate change on regional scale temperature and precipitation in China: the historical run (1995–2005, denoted as WRF-HIS); the RCP4.5 scenario run (2045–2055, denoted as WRF-RCP4.5); and the RCP8.5 scenario run (2045–2055, denoted as WRF-RCP8.5). The first year of each period (1995 or 2045) is considered a spin-up period and only the 10-year results are analyzed.
Fig. 1 The WRF model domain and topography (m). The eight sub-regions used in the analysis are identified (1: western part of Northwest China; 2: eastern part of Northwest China; 3: North China; 4: Northeast China; 5: Tibetan Plateau; 6: Southwest China; 7: Yangtze River Valley (middle and lower); 8: South China (includes Hainan and Taiwan islands)).
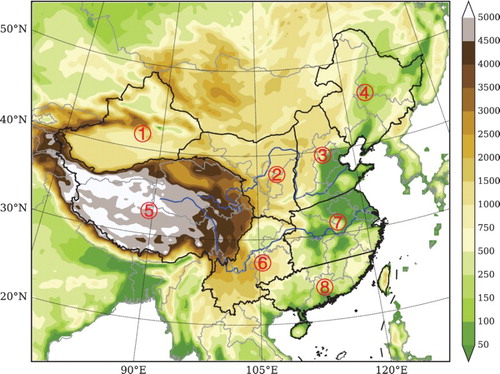
To facilitate the discussion of regional differences in the simulations, we divide China into eight sub-regions. shows the eight sub-regions: the western part of Northwest China, the eastern part of Northwest China, North China, Northeast China, the Tibetan Plateau (TP), Southwest China, the Yangtze River Valley (middle and lower), and South China (including Hainan and Taiwan islands), for which a detailed analysis of the results will be presented. In , the Sichuan Basin is in the northern part of Southwest China east of the TP, and Yunnan Province is the lower plateau southeast of the TP. Southeast China includes the southern part of the Yangtze River Valley (sub-region 7) and South China. The Hetao area is near the northeast corner of sub-region 2.
b Observational data and selection of extreme climate indices
Twelve indices for climate extremes were used in this study; their definitions and expansions are given in . These indices are taken from the dictionary of the Commission for Climatology (CCl) of the World Meteorological Organization's (WMO) World Climate Data and Monitoring Programme, the Climate Variability and Predictability (CLIVAR) Programme of the World Climate Research Programme, and the Joint WMO-Intergovernmental Oceanographic Commission, Commission for Oceanography and Marine Meteorology (JCOMM) Expert Team on Climate Change Detection and Indices. Precise definitions of the full list of indices are available at http://www.climdex.org/indices.html The observational data are from Xie et al. (Citation2007) and Xu et al. (Citation2009) for precipitation and surface air temperature, respectively. Both datasets have a resolution of 0.5° × 0.5° (latitude, longitude).
Table 1. Definitions and units of the 12 climate extreme indices used in this study (see http://www.climdex.org/indices.html).
3 Results
a Evaluation of WRF downscaling
The performance of WRF downscaling was first evaluated by comparing the results from WRF-HIS with the observed temperature and precipitation (denoted as OBS). shows the spatial distributions of 1996–2005 seasonal mean surface air temperature over China from OBS, CCSM4, and WRF-HIS; OBS shows that the surface air temperature decreases from south to north over China in all four seasons, with a warm centre in southeast China and a cold centre in the TP. In general, both WRF-HIS and CCSM4 exhibit good spatial agreement with the observed climatology of seasonal surface air temperature. However, CCSM4 fails to capture regional scale details. As shows, CCSM4 has a warm-cold-warm bias belt pattern over Northwest China that closely follows the mountain ranges, which indicates that CCSM4 fails to reproduce the real topography-induced temperature distribution pattern (Liu et al., Citation2013). The WRF-HIS alleviated these terrain-following biases with relatively evenly distributed biases. Cold biases over the TP and Northeast China, especially in winter and spring, are produced by CCSM4 and enhanced by WRF-HIS. The cold bias in cold seasons in the TP may be a result of the inadequate representation of snow cover in the land-surface model in CCSM4 and WRF, which produces a larger albedo than observed (Gao, Xu, & Chen, Citation2015). The CCSM4 simulates cold biases centred over Sichuan Basin accompanied by a warm bias along the eastern edge of the TP during all seasons, which is similar to the results of Liu et al. (Citation2013). This cold-warm bias pattern is successfully removed by WRF-HIS. Over the low-elevation areas of China, WRF-HIS alleviates the biases in CCSM4 due to small-scale topography (e.g., over the hilly regions in southern China) and produces the biases more uniformly.
Fig. 2 Spatial distribution of seasonal mean surface air temperature (°C) averaged during the 1996–2005 period as observed (OBS) and as simulated by CCSM4 and downscaled by WRF: (a) OBS (MAM), (b) CCSM4 (MAM), (c) WRF (MAM), (d) OBS (JJA), (e) CCSM4 (JJA), (f) WRF (JJA), (g) OBS (SON), (h) CCSM4 (SON), (i) WRF (SON), (j) OBS (DJF), (k) CCSM4 (DJF), and (l) WRF (DJF), where MAM is March, April, and May; JJA is June, July, and August; SON is September, October, and November; and DJF is December, January, and February.
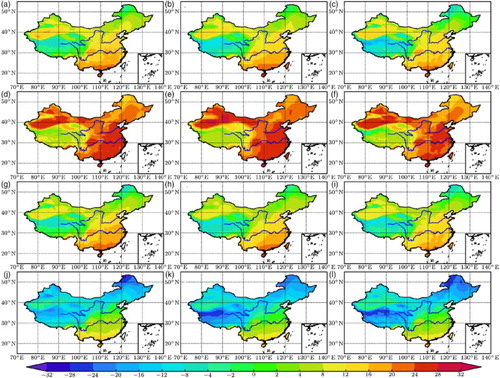
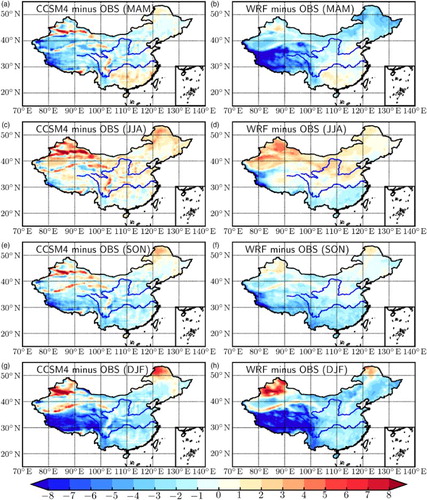
Fig. 3 Spatial distribution of seasonal mean surface air temperature bias (°C) averaged during the 1996–2005 period as simulated by CCSM4 and downscaled by WRF.
compares the spatial distributions of 1996–2005 seasonal mean precipitation over China from OBS, CCSM4, and WRF-HIS. In OBS the precipitation amounts are larger over southeast China and decrease northwestward into the interior of the Eurasian continent. Northwest China has the lowest precipitation amounts, especially during spring, autumn, and winter. Precipitation centres in southeast China during winter expand in area and increase in amount during spring. Enhanced precipitation during summer covers most of the eastern part of China because of the East Asian summer monsoon. As the summer monsoon ends, precipitation dwindles in autumn. Both CCSM4 and WRF-HIS successfully capture the general pattern of the OBS precipitation. However, for spring, CCSM4 simulates the southeast precipitation centre over South China and the Yangtze River Valley with a northward shift and overestimates the precipitation over the north of the Yangtze River, while underestimating precipitation over the southern coastal regions compared with OBS, indicating that CCSM4 cannot capture the dominant coastal precipitation mechanism in spring (Carbone & Li, Citation2015; Li & Carbone, Citation2015). The WRF-HIS successfully reproduces the precipitation peak in southeast China. Both CCSM4 and WRF-HIS overestimate precipitation amounts north of the Yellow River in spring. For summer, the CCSM4 simulation produces a false precipitation centre over the eastern edge of the TP and low precipitation in the Sichuan Basin, while the WRF-HIS simulation improves on CCSM4 in these regions and captures the spatial pattern around Sichuan Basin more realistically. Both CCSM4 and WRF-HIS overestimate the precipitation amount in Northeast and North China in summer. In autumn, CCSM4 still simulates a precipitation centre over the western part of the Sichuan Basin, while WRF-HIS successfully eliminates this high precipitation bias. In winter the WRF-HIS simulates the precipitation pattern and amount in southeast China better than CCSM4. Much stronger precipitation than in OBS is simulated by CCSM4 at the southeastern edge of the TP for all four seasons, which may be attributed to topographic effects. The Himalayas are much lower in the GCMs because of their coarse resolution, so precipitation can penetrate into the TP (Gao et al., Citation2008). Due to its finer resolution, more detailed precipitation features can be captured by WRF-HIS that are much closer to OBS. In addition, WRF-HIS has higher spatial pattern correlation coefficients compared with CCSM4 (). shows the annual cycles of the precipitation bias ratio (BR) relative to OBS as simulated by CCSM4 and WRF-HIS over the eight sub-regions shown in . BR is defined as(1) where
is the precipitation simulated by CCSM4 and WRF-HIS, and
is the observed precipitation. Both CCSM4 and WRF-HIS reasonably simulate the annual cycle of precipitation over the Yangtze River Basin and South China, with BR within the range −0.5 to 0.6 throughout the entire year. For most months, both CCSM4 and WRF-HIS overestimate precipitation over all China, but the BR is relatively small during summer, high in spring, and reaches its highest value in winter, especially in the TP. The WRF-HIS has smaller wet biases over the western part of Northwest China, the eastern part of Northwest China, and the TP, which indicates that the WRF-HIS improves precipitation over these three sub-regions where major mountain ranges exist. The main wet biases occur in North China, Northeast China, and Southwest China during winter and spring (c, d, and f).
Fig. 4 Spatial distribution of seasonal mean daily precipitation (mm d−1) averaged during the 1996–2005 period as observed (OBS) and simulated by CCSM4 and downscaled by WRF: (a) OBS (MAM), (b) CCSM4 (MAM), (c) WRF (MAM), (d) OBS (JJA), (e) CCSM4 (JJA), (f) WRF (JJA), (g) OBS (SON), (h) CCSM4 (SON), (i) WRF (SON), (j) OBS (DJF), (k) CCSM4 (DJF), and (l) WRF (DJF).
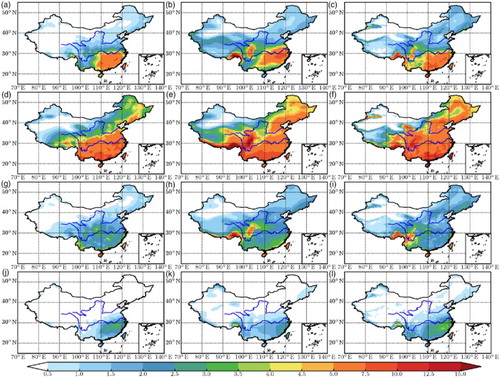
Fig. 5 Annual cycles of precipitation bias ratios (relative to observations) during the 1996–2005 period simulated by CCSM4 and downscaled by WRF averaged over the eight sub-regions in .
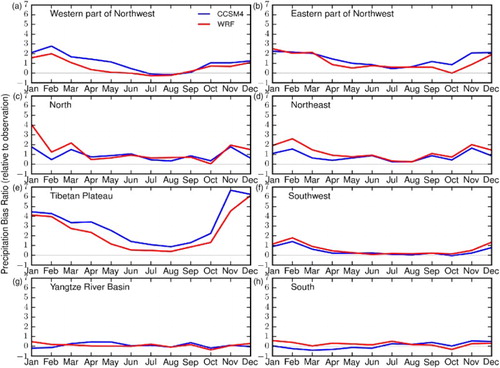
Table 2. Climatological seasonal spatial pattern correlation coefficients between observations and CCSM4, observations and WRF, CCSM4 and WRF for precipitation and surface air temperature during the 1996–2005 period.
illustrates the seasonal spatial pattern correlation coefficients for surface air temperature and precipitation among OBS, CCSM4, and WRF-HIS. For surface air temperature, the correlation coefficients between WRF-HIS and OBS are higher than with CCSM4 and OBS. For precipitation, compared with CCSM4 and OBS, the correlation coefficients between WRF-HIS and OBS are higher during all seasons. The correlation coefficients between CCSM4 and OBS are higher in winter and spring than in summer autumn, while the correlation coefficients between WRF-HIS and OBS are higher in spring and winter. Both WRF-HIS and CCSM4 have the poorest correlation coefficients with OBS during autumn when there are large positive biases in precipitation in Southwest China.
b Future temperature changes
The surface temperature distributions over China for the RCP4.5 and RCP8.5 scenarios simulated by WRF during the 2046–2055 period are compared with the historical run for the 1996–2005 period. presents the WRF-projected changes in surface air temperature over China under the RCP4.5 and RCP8.5 scenarios relative to the historical run. Both WRF-RCP4.5 and WRF-RCP8.5 project that the surface air temperature will increase throughout much of China in all four seasons. Because of higher greenhouse gas emissions and radiative forcing for RCP8.5, the magnitude of warming for WRF-RCP8.5 is greater than for WRF-RCP4.5.
Fig. 6 Spatial distribution of projected seasonal (MAM, JJA, SON, and DJF) mean surface air temperature differences (°C) (between the 2046–2055 and 1996–2005 averages) under RCP4.5 and RCP8.5 simulated by CCSM4 and downscaled by WRF.
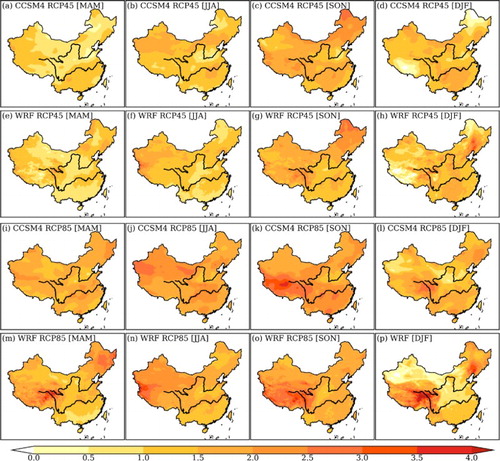
Under both RCP4.5 and RCP8.5 scenarios, there are significant regional differences in terms of projected temperature increase for each season. Under RCP4.5, the magnitude of the warming in spring is the lowest of all the seasons. During summer, the WRF simulation projects a higher temperature increase in Northwest China and the southern part of Northeast China. During autumn, the largest warming occurs over the TP and Northeast China. The WRF simulation projects higher temperature increases in winter over the eastern TP.
Under RCP8.5, during spring, the WRF projects the largest warming over the eastern TP and Northeast China. In summer, the WRF projects a larger magnitude of warming over the western part of the TP, whereas in autumn, the largest warming occurs over the eastern part of the TP. During winter, the WRF projects the most significant warming over the TP and Northeast China. The temperature increases are also larger in South China than in North China in winter. In spring, the temperature increases are smaller in South China than in North China.
There are some noticeable differences between the CCSM4 and WRF simulations shown in . Compared with the CCSM4 simulation, the WRF projection under RCP4.5 produces greater warming in the southern part of Northeast China in winter and a smaller temperature increase in South China. Under RCP8.5, the WRF increases the magnitude of the warming over the eastern edge of the TP in both winter and spring.
c Future precipitation changes
Unlike the general increase in temperature, the changes in precipitation for the 2046–2055 period relative to the historical 1996–2005 period are more varied among regions. The projected changes in precipitation over China simulated by the WRF for the RCP4.5 and RCP8.5 scenarios are compared in . The WRF-RCP4.5 projects generally wetter conditions over Northeast China year-round; it also projects wetter conditions over the middle and lower reaches of the Yellow River Basin during spring and autumn and slightly drier conditions during winter. For regions south of the Yangtze River, the WRF-RCP4.5 projects mainly drier conditions during all seasons, especially summer. The northern Xinjiang is wetter during spring and summer but drier during autumn and winter; the southern Xinjiang is wetter during all seasons, with scattered dry spots in some local regions. The TP is drier during autumn and wetter during the other seasons.
Fig. 7 Spatial distribution of projected seasonal (MAM, JJA, SON, and DJF) mean precipitation change (%) (differences between the averages during the 2046–2055 period and the 1996–2005 period relative to averages during the 1996–2005 period) under RCP4.5 and RCP8.5 simulated by CCSM4 and downscaled by WRF.
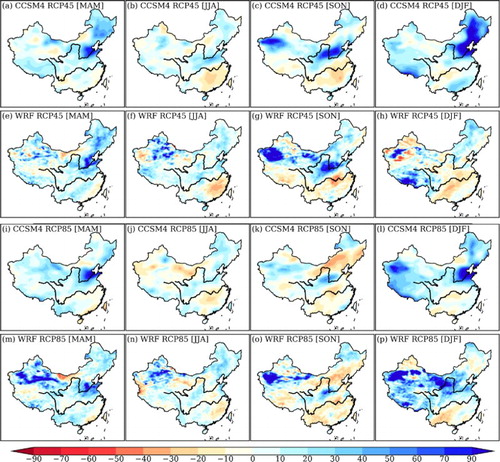
Generally, the WRF-RCP8.5 and WRF-RCP4.5 projections for precipitation changes are similar. In the WRF-RCP8.5 projection, the wet trend in Xinjiang is enhanced, especially during spring and winter. Wetter conditions are also projected by WRF-RCP8.5 in the eastern part of Northwest and North China in winter with slightly drier conditions over North China during autumn.
The main difference between WRF-RCP4.5 and CCSM4 is found in the winter precipitation: in Northeast China, WRF’s projection is drier than CCSM4; over the TP, WRF’s projection is wetter. Under RCP8.5, during spring and autumn, WRF’s projection is wetter in Northwest China (Xinjiang); during winter WRF is drier than CCSM4 in North China and wetter than CCSM4 in the eastern part of Northwest China.
d Climate extremes
and show the projected changes in extreme temperature indices over China under the RCP4.5 and RCP8.5 scenarios. The future changes are defined by the difference between the future period average (2046–2055) and the historical period average (1996–2005). A smaller increase in TX90p and TP90p is produced by WRF than by CCSM4 simulations in regions south of the Yangtze River for both RCP4.5 and RCP8.5. The WRF also simulates larger decreases than CCSM4 in TX10p and TN10p over the TP under RCP8.5. For WRF simulations, both TX90p and TN90p will increase under the two scenarios. Under the RCP4.5 scenario, the annual TX90p mainly increases over Xinjiang (4.46%), North China (4.36%), the Yangtze River Valley (5.36%), and South China (4.30%), while the increases in TX90p over the other regions are below 4% (). Generally, the magnitude of the increases is larger under RCP8.5 than RCP4.5 (). Both scenarios project decreases in TX10p and TN10p. The regions with the largest decreases are in Southwest China and the TP under RCP4.5 (f and h). Additionally, a significantly larger decrease in TX10p and TN10p occurs over the TP under RCP8.5 (n and p).
Fig. 8 Spatial distributions of future changes of annual (a), (e), (i), and (m) TX90p (%); (b), (f), (j), and (n) TX10p (%); (c), (g), (k), and (o) TN90p (%); and (d), (h), (l), and (p) TN10p (%) under the (a)–(h) RCP4.5 and (i)–(p) RCP8.5 emission scenarios for the 2046–2055 period relative to the historical run for the 1996–2005 period; crosses indicate changes significant at the p = 0.05 level based on a Student’s t-test. CCSM4 results are in the 1st (a)–(d) and 3rd (i)–(l) rows. WRF results are in the 2nd (e)–(h) and 4th (m)–(p) rows.
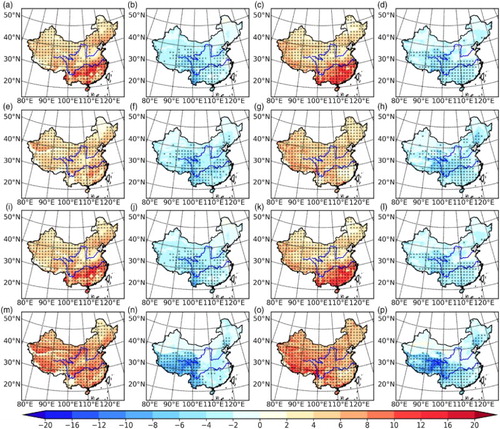
Fig. 9 Spatial distributions of future changes in annual (a), (e), (i), and (m) FD (days); (b), (f), (j), and (n) SU (days); (c), (g), (k), and (o) ID (days); and (d), (h), (l), and (p) TR (days) under the (a)–(h) RCP4.5 and (l)–(p) RCP8.5 emission scenarios for the 2046–2055 period relative to the historical run for the 1996–2005 period; crosses indicate changes significant at the p = 0.05 level based on a Student’s t-test. CCSM4 results are in the 1st (a)–(d) and 3rd (i)–(l) rows. WRF results are in the 2nd (e)–(h) and 4th (m)–(p) rows.
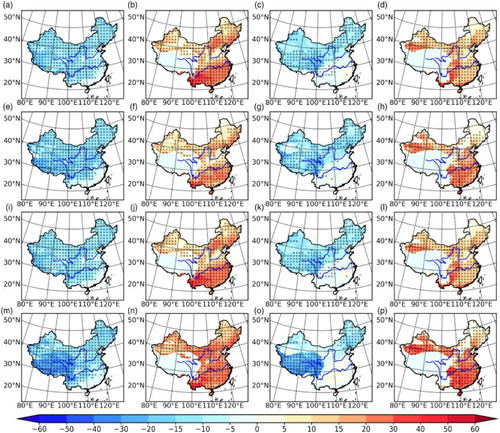
Table 3. Future changes in annual mean temperature climate extreme indices (Tx90p, Tx10p, Tn90p, and Tn10p) under RCP4.5 and RCP8.5 emission scenarios for the 2046–2055 period relative to the 1996–2005 period for eight regions of China (see ).
shows the spatial distributions of future changes in annual FD, SU, ID, and TR under RCP4.5 and RCP8.5 emission scenarios. Compared with CCSM4, WRF simulates larger decreases in FD and ID over the TP for RCP8.5. The WRF also produces a larger increase in TR than CCSM4 over South China and Northwest China under both RCP4.5 and RCP8.5. Though the spatial distribution of these variables is similar for both scenarios, the magnitudes of the changes are generally larger for RCP8.5. The FD will decrease over China under the two scenarios, with larger decreases to the north of the Yangtze River. The largest decrease occurs in the TP with a minor decrease in southeast China (e and m). The ID mainly decreases over the TP and Northeast China and increases slightly in South China (g and o). In most of China except the TP, SU will increase under both scenarios (). Compared with RCP4.5, a significantly larger increase in SU for RCP8.5 occurs over North China and the southern part of Northeast China. Except for the TP, TR will increase over China and Yunnan province to the southeast of the TP. The larger increases in TR occur over Northwest China and south of the Yellow River for both scenarios (h and p, ).
Table 4. Future changes in annual mean temperature climate extreme indices (FD, SU, ID, and TR) under RCP4.5 and RCP8.5 emission scenarios for the 2046–2055 period relative to the 1996–2005 period for eight regions of China (see ).
shows the spatial distributions of changes in annual R95p, Rx5day, R10mm, and CDD under the RCP4.5 and RCP8.5 emission scenarios. These results are in general agreement with CMIP5 projections (Zhou, Wen, Xu, Song, & Zhang, Citation2014). Compared with the CCSM4 simulation, WRF provides more detailed patterns for the changes in R95p, Rx5day, R10mm, and CDD. There are several differences between the projections of CCSM4 and WRF. In South China, R95p and RX5day decrease in CCSM4 simulations and increase in WRF simulations under both RCP4.5 and RCP8.5. In North China, WRF produces a smaller increase in R10mm than CCSM4; WRF also produces a larger decrease in CDD than CCSM4 over Northwest China.
Fig. 10 Spatial distributions of future changes in annual (a), (e), (i), and (m) R95p (days); (b), (f), (j), and (n) Rx5day (mm); (c), (g), (k), and (o) R10mm (days); and (d), (h), (l), and (p) CDD (days) under the (a)–(h) RCP4.5 and (i)–(p) RCP8.5 emission scenarios for the 2046–2055 period relative to the historical run for the 1996–2005 period; crosses indicate changes significant at the p = 0.05 level based on a Student’s t-test. CCSM4 results are in the 1st (a)–(d) and 3rd (i)–(l) rows. WRF results are in 2nd (e)–(h) and 4th (m)–(p) rows.
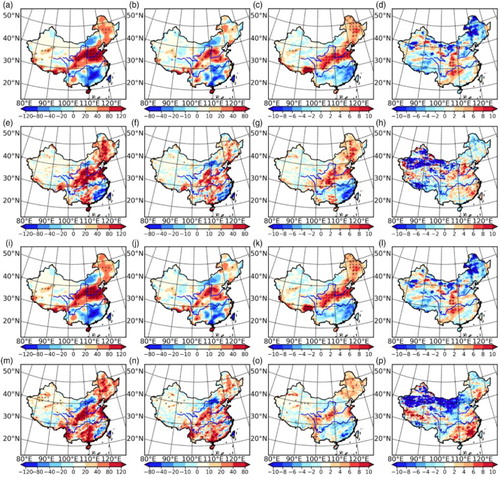
As shown in , R95p is projected to increase over most of eastern China except southeast China in the WRF simulations under both RCP4.5 and RCP8.5 scenarios. There are also some small patches of decrease in R95p in the Yangtze River basin and around the top of the Hetao area (where the Yellow River turns eastward from northward in central northern China). The Rx5day has the same spatial distribution as R95p, which means that under both scenarios regions where extreme precipitation frequency increases also correspond to regions where extreme precipitation amounts increase. The WRF-RCP4.5 projects that R10mm will increase north of the Yangtze River and in parts of Southwest China, and R10mm will decrease in southeast China. A similar pattern of R10mm is produced by WRF-RCP8.5 and WRF-RCP4.5 except WRF-RCP4.5 shows a slight decrease in North China and a smaller decrease in southeast China. CDD is projected to decrease in most areas of Northwest China and to increase in South China and North China under WRF-RCP4.5. For WRF-RCP8.5, the decrease in Northwest China extends further eastward to North China, and the magnitude of the increase in southeast China is greater.
summarizes the precipitation climate extreme indices for WRF under the two scenarios. Under RCP4.5, R95p increased the most in northern China (sub-regions 2, 3, and 4) and the TP (sub-region 5). The increases in R95p under RCP8.5 are smaller in the north (sub-regions 2, 3, and 4) and larger in southern China (sub-regions 6, 7, and 8). Both the Yangtze River Valley and South China become drier in summer and autumn () under both RCP4.5 and RCP8.5, which is consistent with the R10mm decreases and CDD increases.
TABLE 5. Future changes in annual mean precipitation climate extreme indices under RCP4.5 and RCP8.5 emission scenarios for the 2046–2055 period relative to the 1996–2005 period for eight regions of China (see ).
4 Discussion and conclusions
In this study, the regional WRF climate model was used to dynamically downscale the bias-corrected CMIP5 model output of CCSM4 over China for the present (1996–2005) and future (2046–2055) under two scenarios (RCP4.5 and RCP8.5). The performance of WRF was evaluated by comparing the simulated present climate with observations. The results demonstrate that the WRF model, which has a finer resolution and more comprehensive physics representation to better resolve regional climate processes, simulates the historical temperature and precipitation distributions more realistically than CCSM4. The WRF-HIS simulates more reasonable spatial patterns of surface air temperature in China by successfully reducing the warm-cold-warm bias belt pattern with evenly distributed biases in Northwest China. By removing CCSM4’s cold biases centred over the Sichuan Basin and warm bias along the east edge of the TP for all seasons, the WRF produced higher spatial pattern correlations with observations. The WRF also intensifies the cold bias over the TP and Northeast China compared with CCSM4 during winter and spring, which shows the need to improve the representation of snow cover processes in the WRF and CCSM4. Over eastern China, the WRF-HIS produces biases more uniformly. Both CCSM4 and WRF-HIS reproduce the decreasing precipitation pattern from southeast to northwest successfully. However, WRF-HIS shows significant improvement over CCSM4 in Northwest China and the TP in terms of annual cycles of regional mean precipitation because the finer grid spacing resolves the mountain ranges better. The WRF-HIS reduces the wet bias of a high precipitation area simulated by CCSM4 over the western area of the Sichuan Basin in all four seasons.
For surface air temperature, WRF-RCP4.5 and WRF-RCP8.5 project similar spatial patterns with systematic warming over all China during all seasons. The magnitude of the warming under RCP8.5 is larger than under RCP4.5, as expected. Under RCP4.5, the warming magnitude is lowest in spring. During summer, there is a higher temperature increase in Northwest China and the southern part of Northeast China. Temperature increases are higher over the eastern TP in autumn and winter under RCP4.5. Under RCP8.5, the WRF projects the most significant warming over the TP and Northeast China during winter and spring. In summer, the WRF projects a larger magnitude of warming over the western part of the TP, whereas in autumn, the largest warming occurs over the eastern part of the TP. Temperature increases are also larger (smaller) in South China than in North China in winter (spring) for RCP8.5. For the temperature extreme statistics, our results show decreases in cold extremes and increases in warm extremes in a future warmer world. The TX90p and TN90p are projected to have larger increases under RCP8.5 than RCP4.5 but smaller decreases in TN10p and TX10p under RCP8.5.
Downscaling by the WRF reveals much larger regional variability in precipitation change both in terms of mean precipitation and extreme statistics. For the mean precipitation change under WRF-RCP4.5, the most significant increase occurs in the northern part of China in spring and autumn and a decrease in southern China for summer through winter. Under WRF-RCP8.5, the main differences from RCP4.5 are much drier conditions in North China in autumn and wetter conditions in North China and eastern Northwest China in winter. The proportion of heavy precipitation in terms of R95p and RX5day is projected to increase in most of eastern China except in some parts of southeast China where minor decreases in R95p and RX5day occur for both emission scenarios. Increases in R10mm are found in the north, while decreases occur in the south. Consistent with the R10mm distribution, CDD increases in the south and decreases in the north.
Disclosure statement
No potential conflict of interest was reported by the authors.
Additional information
Funding
References
- Bao, J. W., Feng, J. M., & Wang, Y. L. (2015). Dynamical downscaling simulation and future projection of precipitation over China. Journal of Geophysical Research: Atmospheres, 120(16), 8227–8243. doi: 10.1002/2015jd023275
- Bruyère, C. L., Done, J. M., Holland, G. J., & Fredrick, S. (2014). Bias corrections of global models for regional climate simulations of high-impact weather. Climate Dynamics, 43, 1847–1856. doi: 10.1007/s00382-013-2011-6
- Carbone, R. E., & Li, Y. P. (2015). Tropical oceanic rainfall and sea surface temperature structure: Parsing causation from correlation in the MJO. Journal of the Atmospheric Sciences, 72(7), 2703–2718. doi: 10.1175/Jas-D-14-0226.1
- Chen, F., & Dudhia, J. (2001). Coupling an advanced land surface–hydrology model with the Penn State–NCAR MM5 modeling system. Part I: Model implementation and sensitivity. Monthly Weather Review, 129, 569–585. doi: 10.1175/1520-0493(2001)129<0569:CAALSH>2.0.CO;2
- Chen, H. P. (2013). Projected change in extreme rainfall events in China by the end of the 21st century using CMIP5 models. Chinese Science Bulletin, 58(12), 1462–1472. doi: 10.1007/s11434-012-5612-2
- Chen, L., & Frauenfeld, O. W. (2014). Surface air temperature changes over the twentieth and twenty-first centuries in China simulated by 20 CMIP5 models. Journal of Climate, 27(11), 3920–3937. doi: 10.1175/JCLI-D-13-00465.1
- Chen, L., & Frauenfeld, O. W. (2016). Impacts of urbanization on future climate in China. Climate Dynamics, 47(1), 345–357. doi: 10.1007/s00382-015-2840-6
- Chen, L., Li, Y. P., Chen, F., Barr, A., Barlage, M., & Wan, B. C. (2016). The incorporation of an organic soil layer in the Noah-MP land surface model and its evaluation over a boreal aspen forest. Atmospheric Chemistry and Physics, 16(13), 8375–8387. doi: 10.5194/acp-16-8375-2016
- Chen, L., Ma, Z., Mahmood, R., Zhao, T., Li, Z., & Li, Y. (2016). Recent land cover changes and sensitivity of the model simulations to various land cover datasets for China. Meteorology and Atmospheric Physics, 129(4), 395–408. doi: 10.1007/s00703-016-0478-5
- Collins, W., Rasch, P. J., Boville, B. A., Hack, J. J., McCaa, J. R., Williamson, D. L., & Dai, Y. (2004). Description of the NCAR Community Atmosphere Model (CAM 3.0). NCAR Technical Note NCAR/TN-464 + STR, doi:10.5065/D63N21CH.
- Dee, D. P., Uppala, S. M., Simmons, A. J., Berrisford, P., Poli, P., Kobayashi, S., … Vitart, F. (2011). The ERA-Interim reanalysis: Configuration and performance of the data assimilation system. Quarterly Journal of the Royal Meteorological Society, 137, 553–597. doi: 10.1002/qj.828
- Ding, Y. H., Ren, G. Y., Zhao, Z. C., Xu, Y., Luo, Y., Li, Q. P., & Zhang, J. (2007). Detection, causes and projection of climate change over China: An overview of recent progress. Advances in Atmospheric Sciences, 24(6), 954–971. doi: 10.1007/s00376-007-0954-4
- Done, J. M., PaiMazumder, D., Towler, E., & Kishtawal, C. M. (2015). Modeling high-impact weather and climate: Lessons from a tropical cyclone perspective. Climatic Change, 129(3-4), 381–395. doi: 10.1007/s10584-013-0954-6
- Fan, X., Ma, Z., Yang, Q., Han, Y., & Mahmood, R. (2015). Land use/land cover changes and regional climate over the Loess Plateau during 2001-2009. Part II: Interrelationship from observations. Climatic Change, 129(3), 441–455. doi: 10.1007/s10584-014-1068-5
- Fan, X., Ma, Z., Yang, Q., Han, Y., Mahmood, R., & Zheng, Z. (2015). Land use/land cover changes and regional climate over the Loess Plateau during 2001-2009. Part I: Observational evidence. Climatic Change, 129(3), 427–440. doi: 10.1007/s10584-014-1069-4
- Gao, X., Shi, Y., Song, R., Giorgi, F., Wang, Y., & Zhang, D. (2008). Reduction of future monsoon precipitation over China: Comparison between a high resolution RCM simulation and the driving GCM. Meteorology and Atmospheric Physics, 100(1-4), 73–86. doi: 10.1007/s00703-008-0296-5
- Gao, X., Xu, Y., Zhao, Z., Pal, J. S., & Giorgi, F. (2006). On the role of resolution and topography in the simulation of East Asia precipitation. Theoretical and Applied Climatology, 86(1-4), 173–185. doi: 10.1007/s00704-005-0214-4
- Gao, Y., Xu, J., & Chen, D. (2015). Evaluation of WRF mesoscale climate simulations over the Tibetan Plateau during 1979–2011. Journal of Climate, 28(7), 2823–2841. doi: 10.1175/JCLI-D-14-00300.1
- Gao, Y., Xue, Y., Peng, W., Kang, H., & Waliser, D. (2011). Assessment of dynamic downscaling of the extreme rainfall over East Asia using a regional climate model. Advances in Atmospheric Sciences, 28(5), 1077–1098. doi: 10.1007/s00376-010-0039-7
- Han, J., & Roads, J. O. (2004). U.S. Climate sensitivity simulated with the NCEP regional spectral model. Climatic Change, 62, 115–154. doi: 10.1023/B:CLIM.0000013675.66917.15
- Held, I. M., & Soden, B. J. (2006). Robust responses of the hydrological cycle to global warming. Journal of Climate, 19(21), 5686–5699. doi: 10.1175/Jcli3990.1
- Hong, S., & Lim, J. (2006). The WRF single-moment 6-class microphysics scheme (WSM6). Journal of the Korean Meteorological Society, 42, 129–151.
- Hong, S., Noh, Y., & Dudhia, J. (2006). A new vertical diffusion package with an explicit treatment of entrainment processes. Monthly Weather Review, 134, 2318–2341. doi: 10.1175/MWR3199.1
- Kain, J. S. (2004). The Kain–Fritsch convective parameterization: An update. Journal of Applied Meteorology, 43, 170–181. doi: 10.1175/1520-0450(2004)043<0170:TKCPAU>2.0.CO;2
- Kang, I. S., Jin, K., Wang, B., Lau, K. M., Shukla, J., Krishnamurthy, V., & Liu, Y. (2002). Intercomparison of the climatological variations of Asian summer monsoon precipitation simulated by 10 GCMs. Climate Dynamics, 19(5-6), 383–395. doi: 10.1007/s00382-002-0245-9
- Karl, T. R., Knight, R. W., & Plummer, N. (1995). Trends in high-frequency climate variability in the 20th-century. Nature, 377(6546), 217–220. doi: 10.1038/377217a0
- Knutti, R., & Sedlacek, J. (2013). Robustness and uncertainties in the new CMIP5 climate model projections. Nature Climate Change, 3, 369–373. doi: 10.1038/nclimate1716
- Li, Y. P., & Carbone, R. E. (2015). Offshore propagation of coastal precipitation. Journal of the Atmospheric Sciences, 72(12), 4553–4568. doi: 10.1175/Jas-D-15-0104.1
- Li, Y. P., Szeto, K., Stewart, R., Theriault, J., Chen, L., Kochtubajda, B., … Kurkute, S. (2017). The June 2013 Alberta catastrophic flooding: Water vapor transport analysis by WRF simulation. Journal of Hydrometeorology. 18, 2057–2078. doi: 10.1175/JHM-D-15-0176.1
- Liang, X. Z., Li, L., Dai, A., & Kunkel, K. E. (2004). Regional climate model simulation of summer precipitation diurnal cycle over the United States. Geophysical Research Letters, 31, L24208. doi:10.1029/2004GL0210054 doi: 10.1029/2004GL021054
- Liang, X. Z., Li, L., Kunkel, K. E., Ting, M., & Wang, J. X. L. (2004). Regional climate model simulation of U.S. precipitation during 1982–2002. Part I: Annual cycle. Journal of Climate, 17, 3510–3529. doi: 10.1175/1520-0442(2004)017<3510:RCMSOU>2.0.CO;2
- Liang, X. Z., Wang, W. C., & Samel, A. N. (2001). Biases in AMIP model simulations of the east China monsoon system. Climate Dynamics, 17(4), 291–304. doi: 10.1007/s003820000136
- Liang, X. Z., Xu, M., Yuan, X., Ling, T., Choi, H. I., Zhang, F., … Michalakes, J. (2012). Regional Climate-Weather Research and Forecasting model (CWRF). Bulletin of the American Meteorological Society, 93, 1363–1387. doi: 10.1175/BAMS-D-11-00180.1
- Liu, C. H., Ikeda, K., Rasmussen, R., Barlage, M., Newman, A. J., Prein, A. F., … Yates, D. (2017). Continental-scale convection-permitting modeling of the current and future climate of North America. Climate Dynamics, 49(1-2), 71–95. doi: 10.1007/s00382-016-3327-9
- Liu, S. Y., Gao, W., & Liang, X. Z. (2013). A regional climate model downscaling projection of China future climate change. Climate Dynamics, 41(7-8), 1871–1884. doi: 10.1007/s00382-012-1632-5
- Mahmood, R., Pielke, Sr., R. A., Hubbard, K. G., Niyogi, D., Dirmeyer, P., McAlpine, C., … Fall, S. (2014). Land cover changes and their biogeophysical effects on climate. International Journal of Climatology, 34, 929–953. doi: 10.1002/joc.3736
- Meehl, G. A., Stocker, T. F., Collins, W. D., Friedlingstein, P., Gaye, A. T., Gregory, J. M., … Zhao, Z.-C. (2007). Global climate projections. In S. Solomon, D. Qin, M. Manning, Z. Chen, M. Marquis, K. B. Averyt, M. Tignor, & H. L. Miller (Eds.), Climate change 2007: The physical science basis. Contribution of Working Group I to the Fourth Assessment Report of the Intergovernmental Panel on Climate Change. Cambridge, UK: Cambridge University Press.
- Piao, S. L., Ciais, P., Huang, Y., Shen, Z. H., Peng, S. S., Li, J. S., … Fang, J. Y. (2010). The impacts of climate change on water resources and agriculture in China. Nature, 467(7311), 43–51. doi: 10.1038/nature09364
- Rasmussen, R., Liu, C., Ikeda, K., Gochis, D., Yates, D., Chen, F., … Gutmann, E. (2011). High-resolution coupled climate runoff simulations of seasonal snowfall over Colorado: A process study of current and warmer climate. Journal of Climate, 24, 3015–3048. doi: 10.1175/2010JCLI3985.1
- Skamarock, W. C., & Klemp, J. B. (2008). A time-split nonhydrostatic atmospheric model for weather research and forecasting applications. Journal of Computational Physics, 227(7), 3465–3485. doi: 10.1016/j.jcp.2007.01.037
- Su, B., Gemmer, M., & Jiang, T. (2008). Spatial and temporal variation of extreme precipitation over the Yangtze River Basin. Quaternary International, 186, 22–31. doi: 10.1016/j.quaint.2007.09.001
- Sun, J. Q. (2014). Record-breaking SST over mid-North Atlantic and extreme high temperature over the Jianghuai-Jiangnan region of China in 2013. Chinese Science Bulletin, 59(27), 3465–3470. doi: 10.1007/s11434-014-0425-0
- Sun, J. Q., Wang, H. J., Yuan, W., & Chen, H. P. (2010). Spatial-temporal features of intense snowfall events in China and their possible change. Journal of Geophysical Research, 115, D16110. doi: 10.1029/2009JD013541
- Taylor, K. E., Stouffer, R. J., & Meehl, G. A. (2012). An overview of CMIP5 and the experiment design. Bulletin of the American Meteorological Society, 93(4), 485–498. doi: 10.1175/Bams-D-11-00094.1
- Wang, C. H., Liang, X. Z., & Samel, A. N. (2011). AMIP GCM simulations of precipitation variability over the Yangtze River Valley. Journal of Climate, 24(8), 2116–2133. doi: 10.1175/2011jcli3631.1
- Wei, K., & Chen, W. (2009). Climatology and trends of high temperature extremes across China in summer. Atmospheric and Oceanic Science Letters, 2, 153–158. doi: 10.1080/16742834.2009.11446795
- Wood, A. W., Lettenmaier, D. P., & Palmer, R. N. (1997). Assessing climate change implications for water resources planning. Climatic Change, 37(1), 203–228. doi: 10.1023/A:1005380706253
- Xie, P. P., Yatagai, A., Chen, M. Y., Hayasaka, T., Fukushima, Y., Liu, C. M., & Yang, S. (2007). A gauge-based analysis of daily precipitation over East Asia. Journal of Hydrometeorology, 8(3), 607–626. doi: 10.1175/Jhm583.1
- Xu, Y., Gao, X. J., Shen, Y., Xu, C. H., Shi, Y., & Giorgi, F. (2009). A daily temperature dataset over China and its application in validating a RCM simulation. Advances in Atmospheric Sciences, 26(4), 763–772. doi: 10.1007/s00376-009-9029-z
- Xu, Z., & Yang, Z. L. (2012). An improved dynamical downscaling method with GCM bias corrections and its validation with 30 years of climate simulations. Journal of Climate, 25, 6271–6286. doi: 10.1175/JCLI-D-12-00005.1
- Yu, E. T., Sun, J. Q., Chen, H. P., & Xiang, W. L. (2015). Evaluation of a high-resolution historical simulation over China: Climatology and extremes. Climate Dynamics, 45(7-8), 2013–2031. doi: 10.1007/s00382-014-2452-6
- Zhai, P. M., Zhang, X. B., Wan, H., & Pan, X. H. (2005). Trends in total precipitation and frequency of daily precipitation extremes over China. Journal of Climate, 18(7), 1096–1108. doi: 10.1175/Jcli-3318.1
- Zhou, B., Wen, Q. H., Xu, Y., Song, L., & Zhang, X. (2014). Projected changes in temperature and precipitation extremes in China by the CMIP5 multimodel ensembles. Journal of Climate, 27(17), 6591–6611. doi: 10.1175/JCLI-D-13-00761.1
- Zhou, T. J., & Li, Z. X. (2002). Simulation of the East Asian summer monsoon using a variable resolution atmospheric GCM. Climate Dynamics, 19(2), 167–180. doi: 10.1007/s00382-001-0214-8
- Zhou, T. J., & Yu, R. C. (2006). Twentieth-century surface air temperature over China and the globe simulated by coupled climate models. Journal of Climate, 19(22), 5843–5858. doi: 10.1175/Jcli3952.1