
Abstract
Charcoal rot of soybean [Glycine max (L.) Merr.] caused by Macrophomina phaseolina is a disease of economic significance throughout the world. The effects of potassium (K) and phosphorus (P) fertilizer on disease development are unknown. Therefore, two separate trials were conducted in the field during 2008, 2009 and 2010 at Jackson and Milan, TN, USA to evaluate the effects of K and P on severity of charcoal rot. Rates of K (0, 45, 90, 134 and 179 kg K2O ha−1) and P (0, 22, 45, 67 and 90 kg P2O5 ha−1) were used, with a sixth rate ranging from 0–22 for P and 0–37 for K equal to the recommended K or P fertilizer application based on annual soil testing. The colony forming units of M. phaseolina in soil indicated no significant response for any P treatments in five of six location-by-year and for K applications in all six location-by-year environments. Similarly, no significant response in tissue CFU for all P and K treatments in all six location-by-year environments was observed, indicating that the treatments had minor effects. The significant effects detected in the ANOVA were primarily due to major effects from year and location. The results showed that increasing the K and P application rates over both the recommended rate and control (0 kg ha−1) did not affect severity of charcoal rot. The overall trends for many of the variables at both locations based on the slopes of the regression data were very weak, and the standard errors often were equal or larger than the observed slope and the R2 values were very low. This study demonstrates that M. phaseolina populations were not significantly impacted by P and K applications in no-till soils and were not sensitive to routine P and K fertilizer application based on soil testing.
Résumé
La pourriture charbonneuse du soja (Glycine max [L.] Merr.), causée par Macrophomina phaseolina, est une maladie importante sur le plan économique, et ce, partout dans le monde. Les effets du potassium (K) et du phosphore (P) sur le développement de la maladie sont inconnus. Par conséquent, deux essais distincts ont été menés au champ en 2008, 2009 et 2010 à Jackson et Milan au Tennessee, aux États-Unis, pour évaluer les effets du K et du P sur la gravité de la pourriture charbonneuse. Des doses de K (0, 45, 90, 134 et 179 kg K2O ha−1) et de P (0, 22, 45, 67 et 90 kg P2O5 ha−1) ont été utilisées, avec la sixième variant de 0 à 22 pour le P et de 0 à 37 pour le K, jusqu’à hauteur des doses d’application recommandées de K et de P en fonction des analyses de sol annuelles. Les unités de Macrophomina phaseolina formant des colonies dans le sol n’ont affiché aucune réaction importante aux traitements au P à cinq des six endroits choisis annuellement ni aux applications de K aux six endroits choisis annuellement. Similairement, aucune réaction manifeste n’a été observée dans les unités formant des colonies des tissus, et ce, à tous les traitements au P et au K aux six endroits choisis annuellement, indiquant que les résultats consécutifs aux traitements étaient pour le moins modestes. Les effets notables détectés par analyse de la variance découlaient principalement des effets majeurs relatifs à l’année et à l’endroit. Les résultats ont démontré que l’augmentation des doses d’application du K et du P par rapport à la dose recommandée et au témoin (0 kg ha−1) n’a pas influencé la gravité de la pourriture charbonneuse. Aux deux endroits, les tendances générales pour plusieurs des variables, basées sur les pentes des données de régression, étaient très faibles, les erreurs-types étaient souvent égales ou plus grandes que la pente observée et les valeurs de R2 étaient très basses. Cette étude démontre que les populations de M. phaseolina n’étaient pas particulièrement influencées par les applications de P et de K dans les sols cultivés par semis direct et qu’elles n’étaient pas sensibles aux applications courantes de P et de K basées sur les analyses de sol.
Introduction
Fertilizer usage is a prime determinant of yield and profitability for many crops and is an aspect of production that can be manipulated by the farmer (Farina & Channon Citation1988). Phosphate (P2O5) and potash (K2O) are the most widely used fertilizer materials on soybean. It is generally accepted that phosphorus (P) and potassium (K) are important elements in a complete and balanced fertility programme that can improve crop health and reduce the incidence and severity of many crop diseases. Where K and/or P nutrition is inadequate, there is potential for crops to be more susceptible to disease (Prabhu et al. Citation2007a, Citation2007b). Phosphorus and potassium fertilizers were applied to about 37% of the soybean acreage in Tennessee, USA alone. The average application rates were 54 kg P2O5−1 ha and 88 kg K2O−1 ha for the 2012 crop year (USDA-NASS Citation2012), with total applications of 598 and 997 million kg of phosphate and potash on soybean, respectively.
Charcoal rot of soybean [Glycine max (L.) Merr.] caused by Macrophomina phaseolina (Tassi) Goid. is a disease of economic significance (Smith & Carvil Citation1997). It has been reported to cause losses in the north central USA (ElAraby et al. Citation2003; Birrenkott et al. Citation1984; Yang & Navi Citation2005) and southern USA, as well as in tropical and subtropical regions of the world (Smith & Carvil Citation1997). Most commercial soybean varieties that are available to growers are susceptible to charcoal rot, with disease incidence ranging from 50 to 100% (Mengistu et al. Citation2013). When severe, charcoal rot can reduce yield and seed quality significantly (Smith & Carvil Citation1997; Yang & Navi Citation2005). Symptoms of charcoal rot are usually greater on plants stressed by high heat and drought, especially when drought occurs during the reproductive stages of growth. According to Mengistu et al. (Citation2011), the combination of stress and the presence of M. phaseolina caused much higher yield loss on soybeans than drought.
The effects of manipulation of fertilizer levels to reduce or increase the incidence and severity of plant diseases have been reported (Huber et al. Citation1968; Trolldenier Citation1969; Huber Citation1976, Citation1980a, Citation1980b, Citation1981; Graham Citation1983; Huber & Arny Citation1985). Some diseases caused by Cercospora spp., for example, appeared to increase in severity with increased nitrogen (N) fertilization but there was a decrease in severity with increased K fertilization (Tyner Citation1947; Huber Citation1981; Huber & Arny Citation1985). An increase in Sigatoka disease (caused by Mycosphaerella musicola Meredith) of banana (Musa acuminate Colla) is favoured by high levels of N (Wang Citation1966). Studies on brown leaf spot (Cercospora oryzae Sutton & Pons) of rice (Oryza sativa sativa Hochst. ex Steud) showed an increase in disease with increasing N and K rates (Uexkuell V Citation1966). Increased levels of grey leaf spot (GLS) of corn are found in response to increased N levels, whereas K and P have little or no significant effect on GLS development (Smith Citation1989; Okori et al. Citation2004). This may have been due to high residual K and P levels on the trial sites (Smith Citation1989). In contrast, Carrera & Grybauskas (Citation1992) found that increasing levels of N had no effect on GLS.
However, there is very little direct evidence pertaining to the role of P and K or soil fertility on development of charcoal rot on soybean. Rosenbrock (Citation1986) in his unpublished study and Wyllie (Citation1988) reported that in 112 commercial soybean fields in Missouri, there was the possibility of a statistical relationship between P and K levels and microsclerotial numbers but the data were inconclusive. Zimmerman (Citation1986) investigated the role of P and K on microsclerotial numbers of M. phaseolina in pure culture and in naturally infested soil and compared his findings with the influence of the same factors on growth of Fusarium oxysporum Schlecht and Rhizoctonia solani Kuhn (AG4), two ubiquitous competitive fungi. His studies revealed that M. phaseolina was capable of a 9-fold greater growth compared with F. oxysporum and R. solani in nutrient-depleted conditions (minimal P and K) at temperatures of 32–33°C and was comparatively insensitive to changes in pH. The data suggest that M. phaseolina is a nutrient scavenger. This may give the fungus a competitive edge under conditions of reduced nutrient availability in naturally infested soils, especially at higher soil temperatures. When soil was amended with various rates of P and K and microsclerotia numbers were determined, no direct linear effect of P and K was noticed (Zimmerman Citation1986).
Although there is a large volume of literature on the relationship of both K and P on plant diseases, there are few quantitative data available on their effects on severity of charcoal rot of soybean. In a previous study (Mengistu et al. Citation2007), the correlation between disease severity based on visual symptoms from lower stems and root and colony forming units (CFU) was reported to be significant. The study suggested that CFU in soybean stem and root tissues could be used as a measure of disease severity when precise quantitative measurement of treatment effects are needed. The objective of this study was therefore to determine the effects of varying application rates of P and K under field conditions on disease severity by assessing M. phaseolina infection of soybean and CFU levels.
Materials and methods
Field plot design and treatments
Field trials were conducted at the University of Tennessee’s Research and Education Centers at Jackson and Milan, TN, USA from 2008 to 2010 to evaluate the effects of K and P rates on population density of M. phaseolina under a no-tillage system. The soil at Jackson was a Memphis silt loam and the soil at Milan was a Dexter loam. The experimental fields had a history of charcoal rot and the CFU in soil was 45 and 55 g−1 of soil for Jackson and Milan locations, respectively. The fields had been under continuous no-till management without irrigation for over 10 years prior to experiment initiation. The previous crop was soybean in 2006 and 2007, and corn in 2005 at Jackson. The previous crop was soybean in 2003, 2005, 2006 and 2007 while corn was planted in 2004 at Milan.
Two separate nutrient tests were established: A P trial was conducted with six rates replicated four times in a randomized complete block design at Jackson and Milan during 2008–2010. Phosphorus was applied at rates of 0, 22, 45, 67 and 90 kg P2O5 ha−1. The sixth P fertilizer rate was determined by soil testing every year at each location and using the recommended P fertilizer rate (Savoy & Joines Citation2009). Based on the recommendation, 22, 0 and 10 kg ha−1 for Milan and 15, 0 and 0 kg ha−1 for Jackson were applied in 2008, 2009 and 2010, respectively. The P fertilizer was uniformly applied on the soil surface by hand as triple superphosphate (0N-45P2O5-0K2O) to all the plots of the test as needed for each year at each location.
A K trial was conducted in a randomized complete block design with six K rate treatments and four replicates at Jackson and Milan from 2008 to 2010. The K treatments included 0, 45, 90, 134 and 179 kg K2O ha−1. Soil was tested every year at each location using the recommended K fertilizer rate (Savoy & Joines Citation2009) and determined the recommended sixth K rate of 37, 0 and 37 kg ha−1 at Milan and 0, 0 and 0 kg ha−1 at Jackson in 2008, 2009 and 2010, respectively. Muriate of potash (0N-0P2O5-60K2O) was used as the K source for all the K applied treatments, which was surface broadcast applied uniformly by hand.
For both P and K experiments, treatments were applied in the same plot for each location each year. Each plot was 9.1 m long and 3.0 m wide. Soybean ‘Pioneer 94M80’ (Accelerated Yield TechnologyTM, AYTTM) a late maturity group IV cultivar, susceptible to charcoal rot (unpublished data) was planted in no-till plots with 76-cm row spacing at both locations in all 3 years. The seeding rate was approximately 346 000 seeds ha−1 at both locations for each year. The planting dates were 6 May 2008, 12 May 2009 and 6 May 2010 at Jackson and 23 May 2008, 20 May 2009 and 13 May 2010 at Milan. The insects, weeds and diseases were managed according to the University of Tennessee Extension recommendation (https://utextension.tennessee.edu/publications/Documents/PB1608.pdf. Accessed on 27.10.2014). The daily rainfall and air temperature were recorded during the entire growing season each year at both locations.
Disease assessments
Five plants were randomly sampled from each plot within a row at physiological maturity (R7.5) (Fehr et al. Citation1971) for determination of CFU from soil, and lower stems and root tissues. The R7.5 growth stage is when 50% of physiologically mature pods are seen on a single sampled plant. Each plant sample was carefully uprooted with soil adhering to it. Soil was removed from the roots of each plant and separated. Each plant sample from each plot was then thoroughly washed and rinsed in water to remove excess soil and air dried as previously described (Mengistu et al. Citation2008). The lower stems below the cotyledonary node with roots were bulked and coarsely ground in a Thomas Model 4 Wiley Mill (Thomas Scientific, Swedesboro, NJ) fitted with a 1-mm mesh screen. The mill was thoroughly cleaned between samples. The samples were then stored in sealed plastic vials at 4°C until use. For each sample, 5 mg of ground tissue was mixed in a Waring blender with 100 mL of 0.525% NaOCl for 3 min.
The soil samples were used to determine CFU population in soil using protocols described by Mengistu et al. (Citation2008). Colony forming units was determined by taking a 5-g subsample, grinding it with a mortar and pestle, and passing through a 600-μm pore sieve. A 1-g subsample was homogenized in a Waring blender with 100 mL of 0.525% NaOCL for 1 min.
The triturates recovered from each root and stem tissues and soil were separately added to 100 mL of potato dextrose agar (PDA, Difco Laboratories, MI) that had been autoclaved, cooled to 60°C, and amended with rifampicin (100 mg litre−1) and tergitol (0.1 mL) (Smith & Carvil Citation1997; Mengistu et al. Citation2007). Each sample was distributed evenly into five Petri dishes. After 3 days of incubation at 30°C, the CFU of M. phaseolina were counted and the number was expressed as CFU per gram of tissue or soil. Identification of M. phaseolina colonies was based on characteristically grey to black colonies with microsclerotia (Mengistu et al. Citation2015b).
Data analysis
Two-way analysis of variance (ANOVA) using a general linear mixed model was performed on each test using SAS (SAS v. 9.3, Institute, Cary, NC) and JMP (JMP v. 11, Cary, NC). In the first ANOVA, treatments were used as a classification effect and treatment means were compared using Fisher’s least significant difference. The MIXED procedure of SAS was performed where the fixed effects included the main treatments and all the interactions. The random effects, each nested in location, are block (rep), rep-by-year, rep-by-year-by-treatment, rep-by-treatment, rep-by-location-by-treatment and rep-by-location-by-year. In the second ANOVA, treatments were modelled as a linear trend and differences between treatments were tested by F-test for significance of slope. In this analysis, since location had no effect and was not significantly different, data from each year and nutrient for the two locations were combined and ANOVA was run on the combined data with sources involving locations modelled as random effects.
Results
Air temperature and precipitation data for the growing season were obtained from six environments (two locations and three years) from April to October (). These weather data were recorded at the Research and Education Center in Jackson and in Milan, TN, which is part of the National Climatic Data Center of the National Oceanic and Atmospheric Administration (NOAA). Crop water deficits, resulting from hot and dry conditions during the growing season, generally develop in June through to early September. According to Mengistu et al. (Citation2013), these are critical months for M. phaseolina infection and disease severity. Weather conditions during the cropping seasons provided favourable conditions for the development of charcoal rot which was evident by the severe disease in plots each year at both locations. Temperatures in 2008 and 2010 in particular were higher than in 2009, with the greatest temperatures in 2010 at both locations. In 2010 in Jackson, maximum temperatures during reproductive stages (June to September) reached 36°C, 36°C, 38°C and 36°C, respectively, while in Milan the maximum temperatures reached 37°C, 36°C, 38°C and 36°C, respectively. Precipitation was greater in 2009 and 2010 than in 2008 at both locations. The driest year was recorded in 2008 at both locations.
Fig. 1 Maximum air temperatures and precipitation for the months of April through October for 2008 to 2010 at Jackson and Milan, TN. The set of numbers in the x-axis indicates the monthly total precipitation.
Analysis of variance showed that year and location had a significant effect (P < 0.05) on tissue CFU from P treatment, while year, location, year-by-location interaction had a significant effect (P < 0.05) on soil CFU from P treatment (). Since the analysis of variance indicated that there was a significant (P < 0.05) year-by-location interaction for soil CFU, data from each year are presented separately (). The effects of year and location showed that with the exception of 2008, soil CFU values at Milan for P treatment were significantly higher (P ≤ 0.05) than soil CFU values in Jackson in 2009 and 2010. However, analysis of variance for K showed that only year had a significant effect (P < 0.05) on tissue CFU in Jackson but no significant effect on soil CFU or any interaction was detected.
Table 1. Probability of greater values of F resulting from Type III tests of fixed effects P and K from colony forming units (CFU) of Macrophomina phaseolina and soil from soybean tissue from two locations (Milan and Jackson, TN, USA) during 2008, 2009 and 2010 obtained from SAS PROC MIXED analysis.
Table 2. Location-by-year interaction on soil colony forming units (CFU) from soybean grown in Jackson and Milan, TN, USA in 2008, 2009 and 2010.
When the effect of different rates of P treatment on soil CFU across years and locations were combined, the data on rate showed the highest CFU was detected with 22 kg ha−1 application; however, the 22 kg ha−1 application was not the highest rate. There was no consistency for a linear increase or decrease in CFU with increased P application rates ().
Fig. 2 (Colour online) Trends of phosphorus (expressed as P2O5) and potassium fertilizer (expressed as K2O) on CFU g−1 of tissue (A and B) and soil (C and D) at Jackson (filled circles and solid lines) and Milan (open circles and dashed lines); filled and open circles are actual CFUs; dashed and solid lines are regression lines. Phosphorus was applied at six rates: 0, 22, 45, 67 and 90 kg P2O5 ha−1; and K was applied at six rates: 0, 45, 90, 134 and 179 kg K2O ha−1 with the sixth level applied for both equal to the recommended fertilizer application rate based on annual soil P and K testing in 2008, 2009 and 2010 at Jackson and Milan, TN, USA.
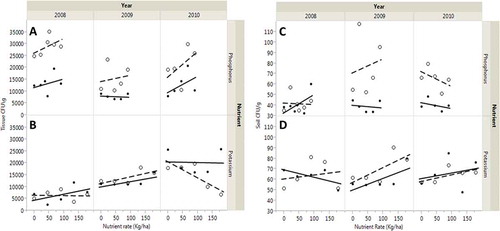
The relationship between treatment levels and CFU was further examined using a linear regression analysis model. Colony forming units of M. phaseolina for 24 disease trends across the different rates of P and K on data collected from 2008 to 2010 in Jackson and Milan, TN is shown in . For each year × location × nutrient combination, there are 12 trends each for tissue CFU and soil CFU for P and K application rates. Even though tissue CFU as a function of K rates showed a positive slope at both Jackson and Milan in 2009, none of the trends was significant with increased K rate. In fact, increasing rate of K resulted in a negative slope in Milan in 2008 and 2010. The F-test for soil CFU showed only one significant positive slope for P in 2009 (P ≤ 0.03) but not in any of the other years. The change in the level of CFU with different rates of P and K is further clarified in and . The significant effects detected in the ANOVA were primarily due to year and location effects. The trends for many of the variables at both locations based on the slopes of the regression data are very weak and the standard errors were often equal to or larger than the observed slope and the R2 values.
Table 3. Effect of phosphorus and potassium fertilizer rates on colony forming units per gram of M. phaseolina from tissue and soil at Jackson and Milan, TN, USA in 2008 through 2010.
Discussion
There was no indication that the temperature and/or precipitation or their combination have impacted the response of charcoal rot to P or K. Overall, application of P or K did not have a significant impact on populations of M. phaseolina. For P application, there were seven instances where there was an increase in disease severity with increasing P rate and five instances where there was a decrease. Likewise, K application resulted in eight instances where there was an increase in disease severity and four instances where there was a decrease with increasing K rate, indicating that tissue and soil populations were not significantly impacted by P and K applications. It appears that tissue CFU levels are more strongly impacted than soil CFU levels and the soil populations are substantially lower than in the tissue. This is not too unexpected based on earlier findings by Mengistu et al. (Citation2008) that the CFU from tissues was greater than in soil. Furthermore, the significant effects of tissue CFU detected in the ANOVA were primarily due to year and location effects.
If these fertilizer applications were having an impact on the population of M. phaseolina, this trend would be expected to become stronger with subsequent applications because the same treatments were applied to the same spot in the field each year. Based on our data however, P and K do not appear to impact tissue or soil CFU levels. Thus our data indicate that there was no direct correlation of tissue or soil CFU with increased fertilizer rates.
In other studies (Kozaka Citation1965) the application of P fertilizer to manage rice blast disease is generally not effective except in the presence of a high supply of nitrogen. The effects of K and P, whether positive or negative on fungal, bacterial, virus and nematode diseases have been documented in earlier reviews (Huber Citation1980a; Huber & Arny Citation1985). For many diseases, K and P deficient plants are more susceptible than plants with adequate levels of these elements (Huber & Arny Citation1985). Our data on the contrary indicated that increased levels of K and P did not impact the population of M. phaseolina. Rate of K and P applications did not enhance or reduce the severity of charcoal rot across the 3 years and locations. In most cases, treatments that did not receive P or K for 3 years resulted in a similar disease severity level as treatments that received continuous higher rates of P and K. This is in agreement with other findings that K fertilization did not reduce Verticillium wilt of cotton (caused by Verticillium dahlia Kleb) in soils naturally high in K (Presley & Dick Citation1951). This is also in agreement with findings by Zimmerman (Citation1986) that there was no direct linear effect of P and K on charcoal rot severity when soil was amended with various concentrations of P and K and microsclerotia. In only one of six trials was the soil population of M. phaseolina significantly impacted by P application.
All fertilizer applications were surface applied in a no-tillage system and therefore may not have been as effective as in a conventional system with incorporation. In no-till systems, both P and K accumulate at or near the soil surface with limited vertical movement through the soil profile. This reduces or eliminates any uptake by crops and is often aggravated by the likelihood of dry conditions near the soil surface during the crop season (Karathanasis & Wells Citation1990; Guertal et al. Citation1991). Increased residue coverage increases water infiltration and soil moisture but reduces soil temperature at shallow depths (Kaspar et al. Citation1990). These conditions may result in no increase or decrease in disease severity of charcoal rot since these nutrients may either not be absorbed or unavailable to the soybean plants to have an effect on disease.
Although only one genotype was used in these tests, Fageria et al. (Citation1990) reported that some genotypes are more efficient than others in K or P uptake, and their greater efficiency may contribute to their increased disease resistance. In our study, CFU level was high at both high and low rates for the two nutrients as well as in the control treatment indicating the potential damage of charcoal rot in both high and low yielding production environments. Inoculum density of M. phaseolina increases in soils planted continuously to susceptible soybean cultivars (Mengistu et al. Citation2015b). Charcoal rot has the capability to attack a wide range of plants, including economic crops that are commonly rotated with soybean such as corn (Zea mays L.). Therefore, understanding the importance of nutrient levels under such conditions may have implications in disease management strategies and needs further study. Appropriate management practices can improve the uptake of K and P by plants and subsequently increase crop production (Prabhu et al. Citation2007a). However, the mechanisms explaining the stimulatory or inhibitory effects of K and P nutrition on the severity of charcoal rot remain largely unknown and require further investigation. The current strategy for managing charcoal rot is to maintain plant vigour by avoiding excessive seeding rates and the use of proper fertilization that ensures vigorous, rapidly growing plants. While such management is still important in promoting plant growth, our finding suggests that K and P fertilizer was not beneficial in reducing the severity of charcoal rot under a no-till system. Although genetic resistance would be the most sustainable control strategy, resistant commercial soybean cultivars are currently unavailable. However, several soybean breeding lines and germplasms that have moderate resistance to charcoal rot have been released (Paris et al. Citation2006; Mengistu et al. 2015a). Public and private soybean breeders are currently working in transferring the charcoal rot resistance into high yielding soybean cultivars with a potential for commercial resistant cultivar to be available (Arelli et al. Citation2006) in the near future. The finding from this research however, showed that increasing the K and P application rates did not result in any consistent increase or decrease in disease severity of charcoal rot. There was no repeatable, consistent effect of P or K on observed M. phaseolina CFU in soil or plant tissue analysed across locations and years thus indicating that P and K has no effect on charcoal rot. It appears that charcoal rot severity depended mainly on environmental factors such as variation of precipitation and drought and less on P and K availability, especially when nutrients level in soil is adequate. Soybean producers should still apply P and K based on crop need without regard to potential effects of charcoal rot severity.
Acknowledgements
The authors thank Mrs Debbie Boykin, USDA-ARS South East Area Statistician for her assistance in data analysis, Robert Sharp, James McClure, Jason Williams, and James Warren for high quality fieldwork; Jason Deffenbaugh, Jamie Jordan and Tara Sydboten for laboratory analysis of the colony forming units.
Additional information
Funding
References
- Arelli PR, Young LD, Mengistu A. 2006. Registration of high yielding and multiple disease-resistant soybean germplasm JTN-5503. Crop Sci. 46:2723–2724.
- Birrenkott GL, Mengistu A, Grau CR. 1984. First report of charcoal rot caused by Macrophomina phaseolina on soybeans in Wisconsin. Plant Dis. 68:628.
- Carrera LM, Grybauskas A. 1992. Effect of planting dates and plant density on the development of gray leaf spot on corn. Phytopathology. 82:718–719.
- ElAraby ME, Kurle JE, Stetina SR. 2003. First report of charcoal rot (Macrophomina phaseolina) on soybean in Minnesota. Plant Dis. 87:202.
- Fageria NK, Baligar VC, Edwards DG. 1990. Soil plant nutrition relationship at low pH stress. In: Baligar VC, Duncan RR, editors. Enhancing nutrient use efficiency: role of crops. San Diego (CA): Academic Press; p. 475–507.
- Farina MPW, Channon P. 1988. Acid sub-soil amelioration: I. A comparison of several mechanical procedures. J Soil Sci Soc Am. 52:169–175.
- Fehr WR, Caviness CE, Burmood DT, Pennington JS. 1971. Stage of development descriptions for soybeans, Glycine max (L.) Merrill. Crop Sci. 11:929–931.
- Graham RD. 1983. The role of plant nutrition in resistance to pathogenic diseases with special reference to trace elements. Adv Bot Res. 10:221–276.
- Guertal EA, Eckert DJ, Traina SJ, Logan TJ. 1991. Differential phosphorus retention in soil profiles under no-till crop production. Soil Sci Soc Am J. 55:410–413.
- Huber DM. 1976. Plant diseases. In: Lapedes DN, editor. Yearbook of science and technology. New York (NY): McGraw-Hill; p. 325–327.
- Huber DM. 1980a. The role of nutrients in resistance of plants to disease. In: Rechcigl M, editor. Series in nutrition in food. Palm Beach (FL): CRC Press; p. 381–406.
- Huber DM. 1980b. The role of nutrition in defense. In: Horsfall JG, Cowling EB, editors. Plant disease – an advanced treatise: how plants defend themselves. New York (NY): Academic Press; p. 381–406.
- Huber DM. 1981. The use of fertilizers and organic amendments in the control of plant disease. In: Pimental D, editor. Handbook of pest management in agriculture. Palm Beach (FL): CRC Press; p. 357–394.
- Huber DM, Arny DC. 1985. Interaction of potassium with plant disease. In: Munson RD, editor. Potassium in agriculture. Madison (WI): ASA Press; p. 467–488.
- Huber DM, Painter CG, McKay HC, Peterson DL. 1968. Effects of nitrogen on fertilization on take-all of winter wheat. Phytopathology. 58:1470–1472.
- Karathanasis AD, Wells KL. 1990. Conservation tillage effects on the potassium status of some Kentucky soils. Soil Sci Soc Am J. 54:800–806.
- Kaspar TC, Erbach DC, Cruse RM. 1990. Corn response to seed-row residue removal. Soil Sci Soc Am J. 54:1112–1117.
- Kozaka T. 1965. Control of rice blast by cultivation practices in Japan. In: Rice blast disease. Baltimore (MD): Proceedings of the Symposium of the International Research Institute. Johns Hopkins University Press; p. 421–440.
- Mengistu A, Arelli P, Bond J, Nelson R, Rupe J, Shannon G, Wrather A. 2013. Identification of soybean accessions resistant to Macrophomina phaseolina by field screening and laboratory validation. Plant Health Progress. doi:10.1094/PHP-2013-0318-01-RS
- Mengistu A, Ray JD, Smith JR, Paris RL. 2007. Charcoal rot disease assessments of soybean genotypes using a colony forming unit index. Crop Sci. 47:2453–2461.
- Mengistu A, Reddy NK, Zablotowicz MR, Wrather JA. 2008. Propagule densities of Macrophomina phaseolina in soybean tissue and soil as affected by tillage, cover crop, and herbicides. Plant Health Progress. doi:10.1094/PHP-2009-0130-01RS
- Mengistu A, Smith JR, Paris RL, Gillen AM. 2015b. Notice of release of soybean lines DT98-7553, DT99-16864, and DT99-17554 with resistance to charcoal rot. Announcement of germplasm release, P.0048.14. Stoneville (MS): United States Department of Agriculture, Agricultural Research Service, Crop Genetics Research Unit.
- Mengistu A, Smith JR, Ray JD, Bellaloui N. 2011. Seasonal progress of charcoal rot and its impact on soybean productivity. Plant Dis. 95:1159–1166.
- Mengistu A, Wrather A, Rupe JC. 2015b. Charcoal rot. In: Hartman GL, Rupe JC, Sikora EF, Domier LL, Davies JA, Steffey KL, editors. Compendium of soybean diseases. St. Paul (MN): APS Press; p. 67–69.
- Okori P, Rubaihayo PR, Adipala E, Dixelius C. 2004. Interactive effects of host, pathogen and mineral nutrition on grey leaf spot epidemics in Uganda. Eur J Plant Pathol. 110:119–128.
- Paris RL, Mengistu A, Tyler JM, Smith JR. 2006. Registration of soybean germplasm line ‘DT97-4290ʹ, a moderately resistant line to charcoal rot. Crop Sci. 46:2324–2325.
- Prabhu AS, Fageria NK, Huber DM, Berni RF, Rodrigues FA. 2007a. Phosphorus and plant disease. In: Datnoff LE, Elmer WH, Huber DM, editors. Mineral nutrition and plant disease. St. Paul (MN): APS Press; p. 45–55.
- Prabhu AS, Fageria NK, Huber DM, Rodrigues FA. 2007b. Potassium and plant disease. In: Datnoff LE, Elmer WH, Huber DM, editors. Mineral nutrition and plant disease. St. Paul (MN): APS Press; p. 57–78.
- Presley JT, Dick JB. 1951. Fertilizer and weather affect Verticillium wilt. Miss Farm Res. 14:1–6.
- Rosenbrock S. 1986. Factors affecting populations of Macrophomina in Missouri soil [M.S. Thesis]. University of Missouri, Columbia, MO.
- Savoy HJ, Joines D. 2009. Lime and fertilizer recommendations for the various crops of Tennessee. Agronomic crops: Chapter II [Internet]. [ cited 2014 Jul 14]. Available from: http://soilplantandpest.utk.edu/pdffiles/soiltestandfertrecom/chap2-agronomic_mar2009.pdf
- Smith GS, Carvil ON. 1997. Field screening of commercial and experimental soybean cultivars for their reaction to Macrophomina phaseolina. Plant Dis. 81:363–368.
- Smith, KL. 1989. Epidemiology of grey leaf spot of field corn (Zea mays L) caused by Cercospora zeae-maydis Tejon and Daniels. Ph.D. Thesis, University of Maryland, College Park, MD, USA.
- Trolldenier G. 1969. Cereal diseases and plant nutrition. Potash Rev. 34:1–16.
- Tyner MT. 1947. The relation of corn yields to leaf nitrogen, phosphorus and potassium content. Soil Sci Soc Amer Proc. 11:317–323.
- Uexkuell V. 1966. Rice diseases and potassium deficiency. Better Crops Plant Food. 53:28–35.
- USDA_NASS. 2012. 2012 Soybeans and Wheat Chemical Use. [Internet]. [ cited 2015 Apr 13]. Available from:http://quickstats.nass.usda.gov/results/1C9BC69F-F69F-31DF-9BC0-FE600DD59A5F#30F5C1A2-E56C-36B7-BF66-C50C372794A2.
- Wang HC. 1966. Studies on Cercospora leaf spot of banana II. In: Disease incidence of banana Cercospora leaf spot and distribution of its ascigerous stage. Plant Prot Bull Dep Agric; Taiwan 8, 485–502.
- Wyllie TD. 1988. Charcoal rot of soybean_Current status. In: Wyllie TD, Scott DH, editors. Soybean diseases of the North Central Region. St. Paul (MN): APS Press; p. 106–113.
- Yang XB, Navi SS. 2005. First report of charcoal rot epidemics caused by Macrophomina phaseolina in soybean in Iowa. Plant Dis. 89:526.
- Zimmerman S. 1986. Effects of phosphorus and potassium on the growth and behavior of Macrophomina phaseolina (Tassi) Goid. In axenic culture and amended natural soil [M.S. Thesis]. Columbia (MO): University of Missouri.