
Abstract
Corynespora cassiicola is an important plant pathogen with a wide host range. We investigated pathogenic and genetic variation among 69 C. cassiicola isolates from 16 hosts in China. Based on the inter-primer binding sites (iPBS)-retrotransposons, we selected five iPBS primers to analyse the genetic variability of these isolates. All isolates were clustered in two genetic clades (IG1 and IG2). Forty-four C. cassiicola isolates were selected from the collection to investigate their pathogenic profiles. Based on the results of the pathogenicity analysis, these 44 isolates were divided into two pathogenicity groups (PG1 and PG2). A correlation between the genetic and pathogenicity groups was observed in the phylogenetic tree obtained with the iPBS markers, whereas the isolates from rubber tree were clustered in an independent clade. A total of 72 bands were observed, of which 68 were polymorphic (94.44%). The Nei’s genetic identity index of the 16 host populations varied from 0.5035 to 0.9661. The mean Nei’s gene diversity index (H = 0.3042) and the mean Shannon’s information index (I = 0.4598) at the species level were higher than at the population level, suggesting that the genetic diversity within the populations was greater than among the populations. The Nei’s GST (0.7895) and gene flow (0.1333) showed more considerable genetic differentiation among populations and few gene exchanges. The pathogenicity and molecular marker analyses revealed there was a high level of genetic differentiation and diversity in the C. cassiicola isolates studied.
Résumé
Corynespora cassiicola est un important agent pathogène des plantes qui possède une vaste gamme d’hôtes. Nous avons étudié les variations pathogéniques et génétiques chez 69 isolats de C. cassiicola provenant de 16 hôtes en Chine. En se basant sur les sites de fixation interamorces (SFI)-rétrotransposons, nous avons sélectionné cinq amorces SFI pour analyser la variabilité génétique de ces isolats. Tous les isolats étaient groupés en deux variantes génétiques (IG1 et IG2). De la collection, 44 isolats de C. cassiicola ont été choisis pour en étudier les profiles pathogéniques. En se basant sur les résultats de l’analyse de pathogénicité, ces 44 isolats ont été divisés en deux groupes de pathogénicité (PG1 et PG2). Dans l’arbre phylogénétique obtenu à partir des marqueurs SFI, nous avons observé une corrélation entre les groupes génétiques et de pathogénicité, alors que les isolats provenant de l’hévéa étaient groupés en une variante indépendante. En tout, 72 bandes ont été observées, parmi lesquelles 68 étaient polymorphes (94.44%). L’indice d’identité génétique de Nei des 16 populations hôtes variait de 0.5035 à 0.9661. L’indice moyen de diversité génétique de Nei (H = 0.3042) et l’indice moyen d’information de Shannon (I = 0.4598) étaient plus élevés au niveau de l’espèce que de la population, suggérant que la diversité génétique au sein des populations était plus grande qu’entre les populations. Le GST de Nei (0.7895) et le flux génétique (0.1333) ont affiché une plus grande différenciation génétique parmi les populations et peu d’échanges de gènes. Les analyses de pathogénicité et des marqueurs moléculaires ont révélé qu’il y avait un fort taux de différentiation et de diversité génétique chez les isolats de C. cassiicola étudiés.
Introduction
Corynespora cassiicola (Berk. & Curt.) Wei causes leaf spots and rots on leaves, stems, roots and fruits of a large number of host plants from tropical and subtropical countries (Farr & Rossman, Citation2018). In addition, the pathogen causes significant losses in yield of cucumber, tomato and other crops (Silva et al., Citation1995). The fungus has been isolated from symptomatic plant tissues and classified as a pathogen (Blazquez, Citation1972), but it also has been identified as a saprophyte from decaying matter or as an endophyte from non-symptomatic tissues (Photita et al., Citation2003; Déon et al., Citation2012).
Genetic variability within C. cassiicola was limited largely to rubber tree isolates from different origins (Silva et al., Citation2003; Romruensukharom et al., Citation2005; Qi et al., Citation2009). In most cases, there were no clear correlations between the genetic branches and the characteristics of the isolates, such as geographic origin, pathogenicity or conidial morphology. However, in Malaysia, two races of C. cassiicola from rubber tree were identified based on their pathogenicity profiles and ISSR analyses (Nghia et al., Citation2008). In China, 22 isolates from different hosts were tested, and ISSR clusters were found to be correlated with the original host (Qi et al., Citation2011). Based on phylogenetic analysis of the combined data of four gene regions (ITS, ga4, caa5 and act1), 135 isolates of C. cassiicola were classified into six genetic branches, in accordance with their pathogenicity profiles, host plants and growth rate (Dixon et al., Citation2009). Pathogenicity profiles and multigene analyses (based on the sequences of β-tubulin, EF-1α, calmodulin and actin genes) supported the lack of pathogenic diversity of C. cassiicola isolates in Japan (Shimomoto et al., Citation2011). Recently, a classification based on cassiicolin gene diversity was proposed, in which there was an approximate relationship between toxin classes and the phylogenetic clades (Déon et al., Citation2014).
Retrotransposons are abundant mobile elements which have been found in the genome of eukaryotes. They are categorized into two classes: long terminal repeat (LTR) and non-long-terminal-repeat (non-LTR) (Kumar et al., Citation1997). Moreover, a new universal DNA fingerprinting method based on the inter-primer binding sites (iPBS) has been developed, and applied to the animal and plant kingdoms (Kalendar et al., Citation2010). In addition, this technology also has been applied to investigate the genetic variation of fungal isolates at both the intra- and inter-species levels (Pourmahdi & Taheri, Citation2015; Özer et al., Citation2016).
To date, iPBS-retrotransposons have not been used to investigate the genetic diversity of C. cassiicola isolated from different hosts in China. Therefore, the objectives of this study were to: (i) evaluate the genetic diversity of C. cassiicola from China using retrotransposon elements in the C. cassiicola genome, and (ii) investigate the correlation between the pathogenicity profiles and genetic variation of isolates.
Materials and methods
Fungal isolates
Corynespora cassiicola isolates were collected from 16 hosts and 15 regions in 2005–2016 (). The lesioned tissues were cut into 3-mm2 sections and surface-sterilized with 75% ethanol for 30 s. The leaf tissues were washed in sterile distilled water three times, plated on potato dextrose agar (PDA) and cultured at 27°C (12/12 h light/dark photoperiod) for 5 days. All isolates were purified by single-conidium isolation (Nasehi et al., Citation2016).
Table 1. Isolates of Corynespora cassiicola used in the study.
DNA extractions
Isolates were cultured in Petri dishes containing 20 mL potato dextrose agar (PDA), and the cultures were incubated for 5 days (12/12 h light/dark photoperiod) at 27°C. Pieces of colonized PDA were collected using an inoculation needle and placed in an Erlenmeyer flask (250 mL) containing 100 mL of potato dextrose broth (PDB), followed by incubation at 27°C (12/12 h light/dark photoperiod, rotating speed 120 r min−1) for 7 days. Mycelium was collected, and genomic DNA was extracted using a modified CTAB method (Groenewald et al., Citation2006). Total DNA was dissolved in 50 μL of ddH2O and the concentration was determined using a Nano Drop 2000 spectrophotometer (Thermo Scientific, Shanghai, China).
iPBS analyses
To analyse the genetic variability in C. cassiicola isolates, five iPBS primers were selected from 89 primers (Klandar et al., Citation2010; Özer et al., Citation2016) (), which produced the strongest, clearest, the most reproducible and polymorphic bands in the preliminary screening tests. PCR analysis was performed in a 25 μL reaction mixture containing 30 ng DNA, 2 mM dNTPs (Takara, Dalian, China), 1 unit of Taq DNA polymerase (Takara, Dalian, China), 2 mM MgCl2, and 1× PCR buffer (Tris-HCl (pH 8.3) 10 mM, KCl 50 mM) (Takara, Dalian, China). The PCR protocol utilized was as follows: initial denaturation at 95°C for 3 min, 30 cycles at 95°C for 15 s, 51–53°C for 1 min, and 68°C for 1 min, and final extension at 72°C for 5 min. All PCR products were separated on 2% agarose gels with 1× TAE buffer at 100 V for 2 h. All iPBS reactions were performed at least twice to ensure reproducibility. The DNA marker BL5000 (Biomed, Beijing, China) was used as a molecular weight marker. Blank controls are not shown in the electrophoresis images, but also were included.
Table 2. Primers used in the iPBS analyses.
Data analyses
Only clear, intense and reproducible amplified iPBS bands were analysed. Each fragment was treated as a unit character and normalized as a binary code 1 or 0 for presence or absence, respectively. A phenogram was constructed using the Dice’s coefficient and the unweighted pair-group method with arithmetic mean (UPGMA) methods with the NTSYS-PC software v. 2.10e (Rohlf, Citation2002). The dendrogram was rebuilt 1000 times by repeated sampling with replacement to indicate the strength of the clusters.
Popgene v. 1.32 (Yeh et al., Citation1999) was used for statistical analysis of standard population data. The mean gene diversity, heterozygosity and per cent polymorphic loci were estimated for all populations. Genotypic diversity was calculated via Shannon’s information index. Differentiation among the populations was estimated by indirect estimate of the gene flow using Gst with Nm = 0.5(1−Gst)/Gst (McDermott & McDonald, Citation1993).
Pathogenicity tests
Of the 69 C. cassiicola isolates used in the iPBS analyses, 44 were selected for investigation of their pathogenicity profiles. Seedlings of cucumber (Cucumis sativus L.) ‘Zhong Nong No. 6', bitter gourd (Momordica charantiai L.) ‘Da Bai’, tomato (Solanum lycopersicum L.) ‘Zhong Za No. 105', eggplant (Solanum melongena L.) ‘9318', hot pepper (Capsicum annuum L.) ‘Zhong Jiao No. 0812', bean (Phaseolus vulgaris L.) ‘Zao Man Jia’, cowpea (Vigna unguiculata L.) ‘Cui Jiang’ and lettuce (Lactuca sativa L.) ‘Da Su Sheng’ were grown in pots (pot volume was 1100 cm3) filled with seedling substrate (the substrate components included peat, perlite and vermiculite) (ShangDao®, Jinan, China) in a greenhouse at 25 ± 5°C for 5 weeks. Mycelium was scraped from 10-day-old PDA cultures and re-suspended in sterile distilled water. The spore suspensions were filtered through double layers of gauze and adjusted to 1 × 10⁵ spores mL−1. The tested plants were placed in a humidity chamber and each plant was sprayed with 15 mL of spore suspensions with a laryngeal spray (Aoxiang, Taizhou, China), ensuring that both sides of the leaves were fully covered. The control plants were sprayed with 15 mL of sterile distilled water. Fifteen plants of each species were used for the pathogenicity test for each isolate. These plants were incubated under 100% relative humidity at 25°C for 48 h, followed by growing in a greenhouse at 25 ± 5°C.
The development of disease symptoms was observed for 7 days after inoculation. Isolates were identified as pathogenic when extending lesions (lesions covered >5% of the leaf area) were observed, and as non-pathogenic when no lesions or non-expanding lesions were detected. Non-expanding lesions were classified as indicating a hypersensitive response, according to the method described by Shimomoto et al. (Citation2011).
The pathogenicity profiles of each isolate were converted to a binary character matrix. A ‘zero’ was assigned to isolates that were non-pathogenic in a given host, whereas a ‘one’ was assigned to isolates that were pathogenic in a certain host. Unweighted pair group method with arithmetic mean (UPGMA) trees were constructed by NTSYS-PC software v. 2.10e (Rohlf, Citation2002), and the internal support for nodes was estimated using bootstrap analyses with 1000 replications.
Results
Cluster analyses of iPBS data
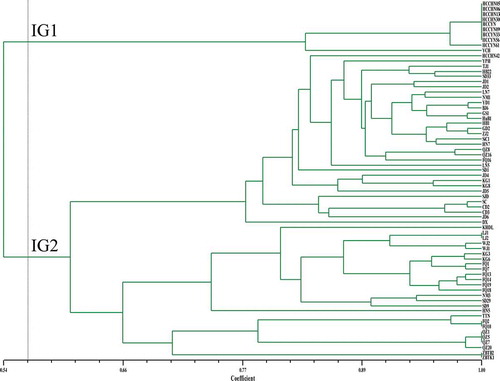
We used five primers for all isolates in the iPBS analyses. A total of 72 bands were amplified; 68 were polymorphic, and the number of polymorphic bands varied from 11 to 19 (). Further, DNA fingerprints of 69 isolates were analysed by Dice’s similarity coefficient to construct a dendrogram (). The genetic similarity coefficient of the isolates ranged from 0.54 to 1.00. The isolates were sorted into two iPBS groups (IG1 and IG2) at a threshold of genetic similarity of 0.564. IG1 included nine isolates from rubber tree and one isolate from scarlet sage, whereas IG2 encompassed 59 isolates from different hosts.
Fig. 1 A representative DNA profile of Corynespora cassiicola isolates from different hosts obtained by iPBS analysis using the iPBS primer i2395. Lanes: 1, YPH; 2, YCH; 3, SC1; 4, JD1; 5, DX; 6, KHDL; 7, TTN; 8, JD4; 9, LJ2; 10, JD2; 11, KG1; 12, KG3; 13, KG6; 14, KG8; 15, JD5; 16, JD6; 17, FQ1; 18, FQ2; 19, FQ7; 20, FQ10. M, DNA marker DL5000. The hosts of YPH, YCH, SC1, DX, KHDL, TTN and LJ2 were poinsettia (Euphorbia pulcherrima), scarlet sage (Salvia splendens), lettuce (Lactuca sativa), lilac (Syzygium aromaticum), lipstick (Aeschynanthus pulcher), crane flower (Strelitzia reginae) and hot pepper (Capsicum annuum), respectively. The host of JD1, JD2, JD4, JD5 and JD6 was cowpea (Vigna unguiculata). The host of KG1, KG3, KG6 and KG8 was bitter gourd (Momordica charantia). The host of FQ1, FQ2, FQ7 and FQ10 was tomato (Solanum lycopersicum).
Fig. 2 (Colour online) An unweighted pair group method with arithmetic mean (UPGMA) dendrogram of 69 C. cassiicola isolates obtained from Dicer’s coefficient similarity matrix using iPBS data. The vertical line is represented as a threshold line (the threshold value was 0.564). IG1 and IG2 represent two groups at the threshold value of 0.564.
Pathogenicity profiles of isolates
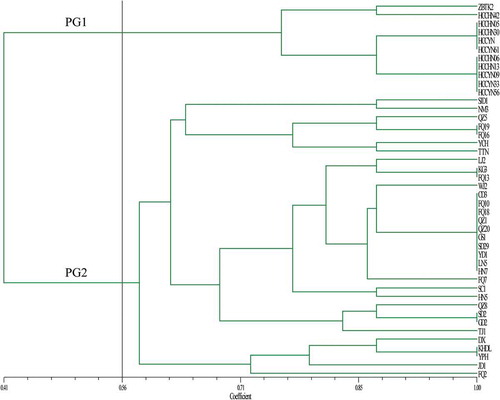
Forty-four isolates of C. cassiicola were selected for pathogenicity tests. Based on a binary matrix, the 44 isolates were divided into two pathogenicity groups (PG1 and PG2) at a threshold of coefficient of 0.56 (). PG1 consisted of 10 isolates from rubber tree and one isolate from velvet plant (Gynura bicolor), HCCHN42 was pathogenic to tomato. In addition, four isolates (HCCHN05, HCCHN30, HCCYN and HCCYN61) were pathogenic to eggplant (). PG2 included 33 isolates from various hosts, TTN (from crane flower) was harmful to eggplant and lettuce, whereas FQ13 (from tomato) was pathogenic to seven vegetables (except for lettuce) (). The pathogenicity groups were associated with the genetic groups of 69 isolates, but the isolates from rubber tree always clustered in an independent clade.
Table 3. Pathogenicity profiles for 44 C. cassiicola isolates.
Fig. 3 (Colour online) The unweighted pair group method with arithmetic mean (UPGMA) dendrogram of 44 C. cassiicola isolates based on the pathogenicity profiles on eight vegetable crops: cucumber, bitter gourd, tomato, eggplant, pepper, bean, cowpea and lettuce. The vertical line is represented as a threshold line (the threshold value was 0.56). PG1 and PG2 represent two groups at a threshold value of 0.56.
Genetic variation analyses
To analyse the genetic variability of the 69 isolates, several genetic parameters were calculated by PopGene 1.32 for the 16 host populations and all isolates. We established that Nei’s genetic identity and distance were different among the 16 populations (). The genetic identity ranged from 0.5035 to 0.9661, and the genetic distance was from 0.0345 to 0.6853, indicating that there was a low degree of similarity among the different populations. The maximum genetic identity presented between the populations SC and CD, and the maximum genetic distance was detected between the populations XJ and TTN.
Table 4. Nei’s genetic identity and genetic distance of 16 populations of C. cassiicola detected by iPBS.
The genetic diversity parameters of the 16 populations and 69 isolates were calculated by POPGENE 1.32. The results demonstrated that the average value of the observed number of alleles (Na) of 16 populations was 1.1823, the average value of the effective number of alleles (Ne) was 1.1098, the average of gene diversity index (H) was 0.0617, and the average value of the Shannon’s information index (I) was 0.0966 (). At the species level, the means of Na, Ne, H and I for the 69 isolates were 1.9028, 1.5136, 0.3042 and 0.4598, respectively (). Based on Nei’s gene diversity and Shannon information index, we discovered that the genetic differentiation in the different populations was relatively high, whereas it was comparatively low within each population.
Table 5. Genetic diversity of 16 populations of C. cassiicola detected by iPBS.
Table 6. Genetic diversity among 69 isolates of C. cassiicola based on iPBS.
Discussion
Pathogenicity tests are essential in the study of the species or races of a fungus (Shimomoto et al., Citation2011). Previous studies reported that some isolates of C. cassiicola were pathogenic on a wide spectrum of hosts, whereas others were host-specific (Chee, Citation1988; Silva et al., Citation1998; Qi et al., Citation2009). For instance, in Sri Lanka, Silva et al. (Citation1998) found that isolates of C. cassiicola from rubber tree infected tomato and eggplant. In Malaysia, C. cassiicola isolates from rubber tree were host-specific (Chee, Citation1988). In the present study, several isolates from rubber tree showed pathogenicity on tomato or eggplant, but the pathogenicity profiles of 10 isolates from rubber tree revealed that they might be host-specific to some extent. Moreover, the iPBS data implied that the original host of HCCHN42 might not be rubber tree.
Eight pathogenicity profiles were detected among 28 isolates sampled from soybean (Glycine max (Linn.) Merr.), cucumber, and other hosts (Onesirosan et al., Citation1974). Dixon et al. (Citation2009) demonstrated that 16 unique pathogenicity profiles were identified within 50 isolates of C. cassiicola collected from eight hosts (basil (Ocimum basilicum L.), bean, cowpea, cucumber, soybean, sweet potato (Dioscorea esculenta (Lour.) Burkill), tomato, and papaya (Carica papaya L.)). In addition, in Japan, isolates collected from cucumber and tomato were found to be pathogenic only on their original hosts (Shimomoto et al., Citation2011). In this study, isolates from tomato showed pathogenicity to several hosts, which is similar to the results obtained by Onesirosan et al. (Citation1974) and Dixon et al. (Citation2009). Furthermore, isolates from cucumber were pathogenic to different vegetable crops. Our findings, however, are different from those obtained by Shimomoto et al. (Citation2011). Therefore, the variability in pathogenicity among the isolates from China may be greater than that among isolates from Japan.
In a previous study, iPBS-retrotransposon primers were discriminated between fungal isolates at the intra- and inter-species levels (Özer et al., Citation2016). Moreover, in Iran, the different anastomosis groups of Rhizoctonia solani were separated based on iPBS-retrotransposons (Pourmahdi & Taheri, Citation2015). In this investigation, we found that there were at least two distinct groups of C. cassiicola isolates in China, and the isolates from rubber tree were located in an independent cluster. Thus, transposons might have driven variations of the C. cassiicola genome, which might have resulted in the independent evolution of the isolates obtained from rubber tree.
The average Nei’s genetic distance of the 16 host populations was 0.3191, indicating that these populations were relatively distant from each other. The gene diversity index of the 69 isolates (H = 0.3042, ) was higher than that of the 16 populations (H = 0.0617, ), suggesting that the degree of genetic diversity at the species level was higher than at the population level. The gene differentiation coefficient (Gst) reflected the level of genetic variability among populations, and at values of Gst >0.15, the genetic differentiation between the populations was usually large (Wright, Citation1978). The strength of gene flow (Nm) between populations significantly affected the genetic differentiation of populations; at an Nm value >1, the genetic differentiation of populations caused by genetic drift was prevented by the gene flow (Hartl & Clark, Citation1997). In the present study, the Nei’s Gst (0.7895) and Nm (0.1333) values showed there was a large genetic variation between populations, and the frequency of gene exchanges among populations was low. Moreover, geographic separation (Déon et al., Citation2014), climate, and the effect of host-pathogen interactions might have accelerated the genetic differentiation of the C. cassiicola isolates. Therefore, many races of C. cassiicola from different hosts might exist (Déon et al., Citation2014).
In conclusion, the pathogenicity and iPBS data analyses confirmed the presence of pathogenic variability and genetic diversity among the isolates studied, but these data also supported the lack of pathogenic diversity among the isolates from rubber tree. The iPBS marker analysis allowed determination of the genetic diversity and population structure of C. cassiicola isolates. This knowledge may be useful to understand host specialization in this pathogen.
Acknowledgements
The authors thank Xuewen Xie for providing technical assistance in the molecular marker analysis.
Additional information
Funding
References
- Blazquez CH. 1972. Target spot of tomato. Plant Dis. 56:243–245.
- Chee KH. 1988. Studies on sporulation, pathogenicity and epidemiology of Corynespora cassiicola on Hevea brasiliensis. J Nat Rubber Res. 1:21–29.
- Déon M, Fumanal B, Gimenez S, Bieysse D, Oliveira RR, Shuib SS, Breton F, Elumalai S, Vida JB, Seguin M. 2014. Diversity of the cassiicolin gene in Corynespora cassiicola and relation with the pathogenicity in Hevea brasiliensis. Fungal Biol. 118:32–47.
- Déon M, Scomparin A, Tixier A, Mattos CRR, Leroy T, Seguin M, Roeckel-Drevet P, Pujade-Renaud V. 2012. First characterization of endophytic Corynespora cassiicola isolates with variant cassiicolin genes recovered from rubber trees in Brazil. Fungal Divers. 54:87–99.
- Dixon LJ, Schlub RL, Pernezny K, Datnoff LE. 2009. Host specialization and phylogenetic diversity of Corynespora cassiicola. Phytopathology. 99:1015–1027.
- Farr DF, Rossman AY Fungal Databases, U.S. National Fungus Collections, ARS, USDA. [ accessed Feb 4, 2018]. https://nt.ars-grin.gov/fungaldatabases/.
- Groenewald S, Noelani VDB, Marasas WFO, Viljoen A. 2006. The application of high-throughput AFLP’s in assessing genetic diversity in Fusarium oxysporum f. sp. cubense. Mycol Res. 110:297–305.
- Hartl DL, Clark AG. 1997. Principles of population genetics. 2nd ed. Sunderland (MA): Sinauer Associates.
- Kalendar R, Antonius K, Smýkal P, Schulman AH. 2010. iPBS: a universal method for DNA fingerprinting and retrotransposon isolation. Theor Appl Genet. 121:1419–1430.
- Kumar A, Pearce SR, McLean K, Harrison G, Heslop-Harrison JS, Waugh R, Flavell AJ. 1997. The Ty1-copia group of retrotransposons in plants: genomic organisation, evolution, and use as molecular markers. Genetics. 100:205–217.
- McDermott JM, McDonald BA. 1993. Gene flow in plant pathosystems. Annu Rev Phytopathol. 31:353–373.
- Nasehi A, Kadir J, Nasr-Esfahani M, Abed-Ashtiani F, Golkhandan E, Ashkani S. 2016. Identification of the new pathogen (Stemphylium lycopersici) causing leaf spot on pepino (Solanum muricatum). J Phytopathol. 164:421–426.
- Nghia NA, Kadir J, Sunderasan E, Abdullah MP, Malik A, Napis S. 2008. Morphological and inter simple sequence repeat (ISSR) markers analyses of Corynespora cassiicola isolates from rubber plantations in Malaysia. Mycopathologia. 166:189–201.
- Onesirosan PT, Arny DC, Durbin RD. 1974. Host specificity of Nigerian and North American isolates of Corynespora cassiicola. Phytopathology. 64:1364–1367.
- Özer G, Bayraktar H, Baloch FS. 2016. iPBS retrotransposons ‘A Universal Retrotransposons’ now in molecular phylogeny of fungal pathogens. Biochem Syst Ecol. 68:142–147.
- Photita W, Lumyong P, McKenzie EH, Hyde K, Lumyong S. 2003. Saprobic fungi on dead wild banana. Mycotaxon. 85:345–356.
- Pourmahdi A, Taheri P. 2015. Genetic diversity of Thanatephorus cucumeris infecting tomato in Iran. J Phytopathol. 163:19–32.
- Qi Y, Xie Y, Zhang X, Pu J, Zhang H, Huang S, Zhang H. 2009. Molecular and pathogenic variation identified among isolates of Corynespora cassiicola. Mol Biotechnol. 41:145–151.
- Qi Y-X, Zhang X, Pu -J-J, Liu X-M, Lu Y, Zhang H, Zhang H-Q, Lv Y-C, Xie Y-X. 2011. Morphological and molecular analysis of genetic variability within isolates of Corynespora cassiicola from different hosts. Eur J Plant Pathol. 130:83–95.
- Rohlf FJ. 2002. NTSYS-pc: numerical taxonomy and multivariate analysis system, version 2.10e. NewYork (NY): Exerter Software.
- Romruensukharom P, Tragoonrung S, Vanavichit A, Toojinda T. 2005. Genetic variability of Corynespora cassiicola populations in Thailand. J Rubber Res. 8:38–49.
- Shimomoto Y, Sato T, Hojo H, Morita Y, Takeuchi S, Mizumoto H, Kiba A, Hikichi Y. 2011. Pathogenic and genetic variation among isolates of Corynespora cassiicola in Japan. Plant Pathol. 60:253–260.
- Silva WP, Deverall B, Lyon B. 1998. Molecular, physiological and pathological characterization of Corynespora leaf spot fungi from rubber plantations in Sri Lanka. Plant Pathol. 47:267–277.
- Silva WP, Karunanayake EH, Wijesundera RL, Priyanka UM. 2003. Genetic variation in Corynespora cassiicola: a possible relationship between host origin and virulence. Mycol Res. 107:567–571.
- Silva WP, Multani DS, Deverall BJ, Lyon BR. 1995. RFLP and RAPD analyses in the identification and differentiation of isolates of the leaf spot fungus Corynespora cassiicola. Aust J Bot. 43:609–618.
- Wright S. 1978. Evolution and the genetics of populations: a treatise in four volumes. Vol. 4. Variability within and among natural populations. Chicago (IL): University of Chicago Press.
- Yeh FC, Yang RC, Boyle T. 1999. Popgene version 1.32: microsoft windows-based freeware for population genetic analysis. Edmonton: University of Alberta. [ accessed 2010 Sept 29]. http://www.ualberta.ca/~fyeh/popgene.download.html.