
Abstract
The population structure and genetic diversity of Pyrenophora tritici-repentis from hexaploid wheat were examined using 51 simple sequence repeat (SSR) markers designed to represent each chromosome of the pathogen. A total of 83 isolates representing races 1 and 2 of Ptr were analysed, including 35 isolates from Canada and 48 isolates from Iran. Isolates of the same two races but originating from different regions were compared in order to examine the effect of geographic origin on grouping. Most of the variation (91%) was observed within the examined populations and only 9% between populations. In addition, a moderate amount of gene flow (Nm = 2.8134) was found between populations. The average gene diversity and the percentage of polymorphic loci were estimated to be 0.2764 and 68.63%, respectively. Applying the unweighted pair group method with arithmetic mean procedure and Dice similarity coefficient revealed no obvious clustering of isolates based on race designation. In contrast, the grouping of isolates was consistent with geographic origin to some extent, with most isolates from Iran and Canada clustering separately regardless of race. These results indicate a link between geographic origin and the grouping of Ptr isolates, which could be detected by comparison of the same two races from two different regions. Previous research compared variable races, making it difficult to draw conclusions regarding the effect of geographic origin.
Résumé
La structure des populations et la diversité génétique de Pyrenophora tritici-repentis (Ptr) provenant de blé hexaploïde ont été étudiées à l’aide de 51 marqueurs des répétitions de séquences simples conçus pour représenter chaque chromosome de l’agent pathogène. En tout, 83 isolats représentant les races 1 et 2 de Ptr ont été analysés, y compris 35 isolats provenant du Canada et 48 d’Iran. Des isolats appartenant aux mêmes deux races, mais provenant de régions différentes, ont été comparés afin d’étudier l’effet de l’origine géographique sur le groupement. Presque toute la variation (91%) a été observée au sein des populations étudiées et seulement 9% entre les populations. De plus, un flux génétique modéré (Nm = 2.8134) a été décelé entre ces dernières. La diversité génétique moyenne et le pourcentage de locus polymorphes ont été estimés à 0.2764 et à 68.63%, respectivement. L’application de la méthode de classification des paires-groupes non pondérés, combinée à la moyenne arithmétique et au coefficient de Dice, n’a révélé aucun regroupement apparent d’isolats basé sur la désignation de la race. Par contre, le groupement d’isolats était, dans une certaine mesure, compatible avec l’origine géographique, la plupart des isolats d’Iran et du Canada se regroupant séparément, indépendamment de la race. Ces résultats indiquent qu’un lien existe entre l’origine géographique et le groupement des isolats de Ptr, lien qui pourrait être détecté en comparant les deux mêmes races en provenance de deux régions différentes. Les recherches précédentes comparaient des races variables, rendant difficile la formulation de conclusions relatives à l’influence de l’origine géographique.
Introduction
The homothallic ascomycete fungus Pyrenophora tritici-repentis (Died.) Drechs (anamorph: Drechslera tritici-repentis (Died.) Shoem.) causes tan spot, a destructive foliar disease of durum (Triticum durum Desf.) and bread wheat (Triticum aestivum L.). Infection by P. tritici-repentis (Ptr) reduces plant photosynthetic area, decreases seed filling and leads to a lower number and weight of seeds (De Wolf et al., Citation1998). Isolates of the fungus are grouped into races based on their virulence on a wheat differential set (Lamari et al., Citation2003, Citation2005). Eight races of Ptr have been identified to date, selectively inducing chlorosis and/or necrosis on the differential hosts. These symptoms result from the production of various necrotrophic effectors (host-specific toxins) by fungal isolates, including Ptr ToxA, Ptr ToxB and Ptr ToxC (Ciuffetti et al., Citation2010; Lamari & Strelkov, Citation2010). Ptr ToxA and Ptr ToxB are both small proteins that induce necrosis and chlorosis, respectively, on sensitive hosts. Ptr ToxC also induces chlorosis, but on different hosts than Ptr ToxB. Unlike Ptr ToxA and Ptr ToxB, Ptr ToxC does not appear to be a protein (Effertz et al., Citation2002). The necrotrophic effectors are produced differentially by the races of Ptr. Race 1 produces Ptr ToxA + Ptr ToxC, race 2 produces Ptr ToxA, race 3 produces Ptr ToxC, race 5 produces Ptr ToxB, race 6 produces Ptr ToxB + Ptr ToxC, race 7 produces Ptr ToxA + Ptr ToxB, and race 8 produces Ptr ToxA + Ptr ToxB + Ptr ToxC (Lamari et al., Citation2003). Race 4 does not produce any known effectors, and is avirulent on wheat (Lamari et al., Citation2003; Lamari & Strelkov, Citation2010).
Many studies have investigated the genetic diversity of Ptr populations and its relationship with the race designation and/or geographic origin of fungal isolates. Di Zinno et al. (Citation1997) found no significant correlation between polymorphisms revealed by random amplified polymorphic DNA (RAPD) analysis and factors such as geographic origin, virulence or toxin-producing ability. Similarly, Friesen et al. (Citation2005) reported no specific relationship between isolate grouping and race or geographic origin of Ptr, based on an amplified fragment length polymorphism (AFLP) analysis and sequence comparison of the internal transcribed spacer region (ITS) of the ribosomal DNA. Singh & Hughes (Citation2006) also found that all of the isolates they evaluated from western Canada had unique RAPD banding patterns, and that the isolates clustered into groups independent of their race designation or origin. In contrast, in another study using RAPD analysis, Aung (Citation2001) reported significant differences between Ptr ToxA-producing isolates classified as races 1 and 2, and Ptr ToxA-non-producing isolates classified as races 3, 5 and 6 of the fungus. Aboukhaddour et al. (Citation2011), in a simple sequence repeat (SSR) marker analysis of globally distributed populations of Ptr, also found that Ptr ToxA non-producing isolates clustered together and were not closely related to Ptr ToxA-producing isolates. This finding led the authors to suggest that the host-specificity imposed by the different necrotrophic effectors of Ptr could lead to differentiation among isolates. Aung (Citation2001) and Aboukhaddour et al. (Citation2011) also found that avirulent (non-pathogenic) isolates of Ptr grouped separately from all other virulent isolates, which also was reported by Leisová et al. (Citation2008). In the latter study, however, which was based on an AFLP analysis of isolates from eastern central Europe and the western hemisphere, the authors postulated that sexual reproduction and long-distance dispersal could cause genetic variability independent of race structure or geographic origin (Leisová et al., Citation2008). These and other studies suggest a fair amount of genetic diversity in Ptr, although collectively they do not offer a clear consensus as to whether or not this diversity is related to geographic origin or race designation. While some studies have reported the grouping of isolates based on the ability or inability to produce Ptr ToxA (Aung, Citation2001; Aboukhaddour et al., Citation2011), the question of the effect of isolate origin remains particularly unclear.
In an effort to improve the understanding of the influence of geographic origin on the diversity and grouping of isolates of Ptr, a collection of isolates from Iran and Canada classified as races 1 and 2 was examined by simple sequence repeat (SSR) marker analysis. Races 1 and 2 were selected for the analysis because these are the predominant races in those countries (Lamari & Strelkov, Citation2010; Aboukhaddour et al., Citation2013; Momeni et al., Citation2014), and because they both produce Ptr ToxA. Thus, the effect of race and Ptr ToxA production could be fixed, enabling a direct comparison of the influence of geographic origin for isolates from two very distinct regions. The SSR markers used were designed to represent each chromosome of the pathogen, thereby providing a better representation of the diversity of the genome of Ptr.
Materials and methods
Pyrenophora tritici-repentis isolate collection
Eighty-three isolates of Ptr were included in this study. These consisted of 48 isolates from Iran, representing 1–4 single-spore isolates from each of 28 sampled fields (Momeni et al., Citation2014), and 35 isolates from Alberta, Canada, representing 1–2 single-spore isolates from each of 30 sampled fields (Aboukhaddour et al., Citation2013). The isolates from Iran were regarded as two populations based on the province of origin: A (Golestan isolates) and B (Mazandaran isolates), while the isolates from Canada were regarded as a third population: C (). Although Golestan and Mazandaran are adjacent provinces in northern Iran, agricultural practices and crop preferences differ, as do climatic conditions. The isolates were obtained from infected wheat leaves following established protocols (Lamari & Bernier, Citation1989). Isolates of Pyrenophora teres f. teres, P. teres f. maculata (Akhavan et al., Citation2016) and Sclerotinia sclerotiorum (Ziesman et al., Citation2016) were used as outgroups for phylogenetic analysis following polymerase chain reactions (PCR).
Table 1. Geographic origin (province, country and location), population and race designation of Pyrenophora tritici-repentis isolates analysed in this study.
Extraction of genomic DNA
Fungal mycelium was grown in liquid Fries medium (Dhingra & Sinclair, Citation1986) for DNA extraction. The genomic DNA was extracted from 40 mg of freeze-dried mycelium with a Wizard® Genomic DNA Extraction Kit (Promega Corp, Madison, WI) as described by Akhavan et al. (Citation2015). The quality and quantity of the extracted DNA was determined with a NanoDrop® ND-1000 spectrophotometer (Thermo Scientific, Wilmington, DE).
SSR analysis
The approach for selecting the different SSR loci was based on Aboukhaddour et al. (Citation2011), in which loci were chosen to represent each chromosome of Ptr (Pyrenophora tritici-repentis Sequencing Project, Broad Institute (www.broadinstitute.org)). Sites of the genome with potential SSR sequences were identified with ssr.pl software (Temnykh et al., Citation2001). The length of each chromosome and each supercontig, along with the length of the motif and the estimated product size, were the main factors in selecting target sequences for primer design. The number of loci selected per chromosome was proportional to the size of each chromosome. For example, five times as many loci were selected from chromosome 1 (10.1 Mb) versus chromosome 11 (2 Mb). Primer pairs were designed with Primer 3 software (Rozen & Skaletsky, Citation2000) to amplify different single-copy SSR loci. A total of 51 primer pairs were used to amplify 51 different loci among the isolates of Ptr (Supplementary Table 1).
The PCR was performed in a 12.5 µL reaction volume that included 1.25× PCR buffer, 1.5 mM MgCl2, 0.2 mM dNTPs, 5 pmol of each forward and reverse primer, 0.6 U Taq DNA polymerase, 5 pmol M13 dye and 30 ng of template DNA. Reaction conditions included an initial denaturation at 95°C for 5 min, followed by 3 cycles at 95°C for 30 s, 50°C for 30 s and 72°C for 80 s, and 33 cycles at 94°C for 15 s, 52°C for 15 s and 72°C for 45 s. A final extension was performed at 72°C for 10 min. The PCR products were resolved by capillary electrophoresis on a 3730 DNA analyser (Applied Biosystems, Foster City, CA). The SSR allele sizes for each locus were determined by comparison with a LIZ 500 internal size standard (Applied Biosystems) using GeneMapper software v. 3.7 (Applied Biosystems) (Bogacki et al., Citation2010; Akhavan et al., Citation2016).
Data analysis
Allele frequency, the percentage of polymorphic alleles, genetic distance between populations and the amount of gene flow were calculated using POPGENE v. 1.31 (Yeh et al., Citation1999). Gene flow that is shown with Nm (Number of migrants) was calculated as Nm = 0.5(1-GST)/GST (McDermott & McDonald, Citation1993) with GST as the coefficient of gene differentiation (Nei, Citation1973). Shannon’s information index (I), which takes into account the frequency of each allele along with the total number of alleles (Sherwin et al., Citation2006; Sherwin, Citation2010), was estimated with POPGENE as a measure of gene diversity (Lewontin, Citation1972). The gene diversity of the population also was estimated using Nei’s (Citation1973) formula: H = 1 – ∑ pi2 where H is the gene diversity of the population and pi is the frequency of different alleles at a particular locus. An unrooted tree based on unweighted pair group method with arithmetic mean (UPGMA) and Nei’s genetic distance was constructed for populations of Ptr from Iran (Golestan and Mazandaran provinces) and Canada (Alberta) using POPGENE v. 1.31.
Analysis of molecular variance (AMOVA) was performed with GenAlEx 6 (Peakall & Smouse, Citation2006). PhiPT, a measure which estimates variation among individuals within populations relative to the total, was calculated as PhiPT = AP/(WP + AP), where AP is the estimated variance among populations and WP is the estimated variance within populations (Peakall & Smouse, Citation2006). Genetic distance (GD) and geographic distance (GGD) were calculated between all isolates of Ptr.
Cluster analysis was conducted with NTSYSpc 2.02e (Exeter Software, New York, NY) using the Dice similarity coefficient (Dice, Citation1945) and employing the UPGMA method. The input file was an Excel file with binary data assigning 1 for the presence and 0 for the absence of each amplified band in different alleles of each locus. Of the 86 isolates evaluated, three belonged to species other than Ptr (P. teres f. teres, P. teres f. maculata and S. sclerotiorum). Therefore, these three isolates were not used in the calculations with GenAlex 6 and POPGENE 1.31, but were used in the NTSYSpc 2.02e cluster analysis.
Results
The diversity of the Ptr isolates was assessed by SSR marker analysis. All 51 SSR loci amplified successfully, and 35 were polymorphic (). Locus 19 produced the highest number of alleles (13). The overall percentage of polymorphic loci was 68.63% (). The genetic diversity of the entire collection (Ht) was 0.2764 (). The mean genetic diversity using the Shannon’s index (I) was estimated as 0.5298 (SD = 0.5869), with the isolates from Golestan representing the most diverse population (I = 0.4604) and those from Mazandaran the least (I = 0.2963) ().
Table 2. Summary of genetic variation statistics for loci in populations of Pyrenophora tritici-repentis evaluated from Iran (Golestan and Mazandaran) and Canada (Alberta).
PhiPT was equal to 0.093 (P ≤ 0.001), with 91% of the genetic variance occurring within populations and 9% between populations. Results from the analysis of molecular variance (AMOVA) showed a significant difference among the three populations of Ptr. In the pairwise comparisons, significant genetic differentiation was detected between the populations with the exception of the two Iranian populations, for which genetic differentiation was not significant (PhiPT = 0.005, P = 0.301) ().
Table 3. Analysis of molecular variance (AMOVA) for populations of Pyrenophora tritici-repentis from Iran (Golestan and Mazandaran) and Canada (Alberta).
Genetic diversity at each locus ranged from 0 to 0.8 and was higher among isolates from Golestan than among isolates from Mazandaran or Alberta. Three populations were placed in three distinct groups based on geographic origin (). The greatest genetic distance was observed between the Ptr populations from Mazandaran and Alberta (0.1164), while the smallest genetic distance was observed between the pathogen populations from Golestan and Mazandaran (0.0171) (). Following Nei analysis (Citation1978), gene flow (Nm) was estimated as 2.8134, and the calculated Gst was equal to 0.1509 ().
Fig. 1 Unrooted tree based on unweighted pair group method with arithmetic mean (UPGMA) and Nei’s genetic distance for populations of Pyrenophora tritici-repentis from Iran (Golestan and Mazandaran) and Canada (Alberta). The tree was produced with POPGENE v. 1.31. The scale bar represents 0.1 substitutions per site.
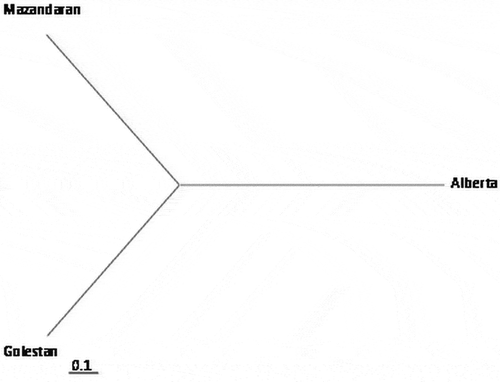
Table 4. Nei’s unbiased measures of genetic distance between populations of Pyrenophora tritici-repentis from Iran (Golestan and Mazandaran) and Canada (Alberta).
Table 5. Gene flow (Nm) and gene differentiation (Gst) estimated among pairs of three populations of Pyrenophora tritici-repentis from Iran (Golestan and Mazandaran) and Canada (Alberta).
Only in one case were identical haplotypes found among the examined isolates (isolates AB64-1 and AB64-5 from Alberta). Cluster analysis indicated that there was considerable genotypic diversity among the tested isolates. When subjected to NTYSYSpc with UPGMA cluster analysis, most of the isolates (~97%) were grouped into two main clusters (A and B), with 53% similarity using the dice coefficient, while only about 3% clustered individually ().
Fig. 2 Dendrogram constructed based on the unweighted pair group method with arithmetic mean (UPGMA) for 83 isolates of Pyrenophora tritici-repentis originating from three different regions (two provinces of Iran and one of Canada) and representing races 1 and 2 of the pathogen. The vertical lines indicate two main clusters A and B and two sub-clusters (I and II) within cluster A. The dendrogram was produced with NTSYSpc ver. 2.02e, based on Dice similarity coefficient. The three isolates at the bottom of the dendrogram represent Sclerotinia sclerotiorum (SC), Pyrenophora teres f. teres (PTT) and P. teres f. maculata (PTM), and were included as outgroups.
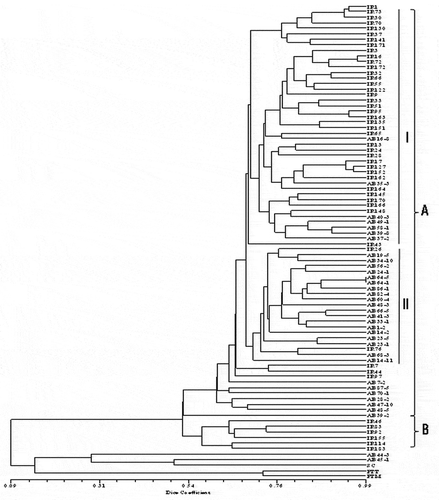
The first main cluster (A) included isolates from the three populations examined (Mazandaran, Golestan and Alberta) belonging to both races 1 and 2, and represented 89% of all isolates evaluated in this study. Cluster A consisted of two sub-clusters (I and II) with 70% similarity as well as some single isolates. Sub-cluster I included all but 11 of the Iranian isolates plus seven isolates from Alberta. All isolates from Mazandaran were included in sub-cluster I. Sub-cluster II was comprised of 19 isolates from Alberta plus two isolates from Iran (IR76 and IR26). The second main cluster (B) included only six isolates, all of which were from Golestan, and which represented both races 1 and 2. No clear separation of the races was observed in this study. Of the 75 isolates in cluster A, 55 were classified as race 1 and 17 as race 2; the race designation of three isolates (AB16-8, AB86-1 and AB23-1) was unknown. Of the six isolates in cluster B, all were race 1 with the exception of IR83, which was classified as race 2. Most isolates in sub-cluster I (39 of 44) of cluster A belonged to race 1, while four isolates belonged to race 2. In contrast, there was an almost even split in sub-cluster II, with nine isolates classified as race 1, and 10 classified as race 2.
Discussion
The population structure and diversity of Ptr isolates originating from Iran and Canada was examined by SSR marker analysis. The results suggested that clustering of the isolates was independent of their designation as race 1 or 2 (both producers of Ptr ToxA), but consistent with geographic origin to a certain extent. In an earlier study, Aboukhaddour et al. (Citation2011) reported some clustering of isolates based on Ptr ToxA-producing ability, but such a distinction could not be made here since all isolates examined produced this necrotrophic effector. In the present study, geographic separation at the population level was obtained in a dendrogram constructed with POPGENE using Nei’s genetic distance. This geographic structure also was supported for the most part by the UPGMA cluster analysis of individual isolates constructed by NTSYSpc 2.02e using the Dice coefficient of similarity.
The current results contrast somewhat with those of Friesen et al. (Citation2005), who did not find a clear genetic grouping of 97 Ptr isolates based on geographic origin. With the exception of five isolates from the Czech Republic, however, the isolates examined by Friesen et al. (Citation2005) all were collected from the American continent; in contrast, those in the present study came from two very distant countries, Iran and Canada, which may have enabled a clearer separation based on geographic origin. Moreover, the use in this study of 51 SSR markers that represented the entire genome of Ptr also could have allowed better differentiation of the isolates based on their geographic origin. Leisová et al. (Citation2008) also reported that genetic similarity was not explained by geographic origin in a study of isolates from the Czech Republic, Slovak Republic, Russia, Canada, the USA and Argentina, where only the Argentine isolates formed their own cluster; likewise, clustering was found to be independent of the race structure (Leisová et al., Citation2008). Friesen et al. (Citation2005) also did not observe grouping by race among Ptr isolates representing races 1, 2, 3, 4, 5, ND7 and ND8, with races 1, 2, 3, 4 and 5 as defined by Lamari et al. (Citation1995) and races ND7 and ND8 based on studies by Meinhardt et al. (Citation2003) and Ali and Francl (Citation2003), respectively. Using RAPD marker analysis, Di Zinno et al. (Citation1997) investigated the possibility of a correlation between DNA polymorphism, geographic origin, pathogenicity and the production of necrosis-inducing necrotrophic effectors (toxins), presumably Ptr ToxA, among Ptr isolates from Canada, Morocco, Argentina, Mexico and Bangladesh; however, no correlation could be established between the polymorphisms revealed by RAPD analysis and other variables. This latter study (Di Zinno et al., Citation1997) included only 13 isolates, however, as opposed to the 83 isolates analysed in the present study. Lepoint et al. (Citation2010) identified two distinct groups in a phylogenetic analysis of the mating type locus of isolates originating from Europe, North and South America, North Africa and Central and South Asia, but these groups were unlinked to geographic origin or ToxA profile.
Moreno et al. (Citation2008) used inter simple sequence repeats (ISSR) as molecular markers to investigate variability among Argentine isolates of Ptr, and reported 36 different haplotypes among 37 isolates, indicating that the pathogen population is heterogeneous in Argentina. Like Moreno et al. (Citation2008), the present study showed a high genotypic diversity among the isolates examined with almost no clonal component; nevertheless, the genetic differentiation among the populations and in particular between the two populations collected from Iran was relatively low ().
Mehta et al. (Citation2004) observed almost the same banding pattern during digestion of PCR products obtained with ITS4 and ITS5 primers and repetitive element palindromic PCR (rep-PCR), implying that isolates of Ptr collected from the province of Parana in Brazil had similar genetic backgrounds. This led these researchers to conclude that there was no need to use a wide range of pathogenic isolates in screening for resistance (Mehta et al., Citation2004). In contrast, the current study showed a high genotypic diversity consisting of distinct haplotypes, suggesting that when developing resistant cultivars for deployment in Iran or Canada, a sufficient number of isolates from both races 1 and 2 should be included in screening to obtain a sustainable and durable resistance. A possible explanation for the high genotypic diversity found among isolates of Ptr in this study could be the occurrence of sexual recombination, gene flow, natural mutations and genetic drift (McDonald, Citation1997). This may be important because pathogen populations with considerable variation potentially are capable of rapidly evolving responses to changing environmental conditions (McDonald et al., Citation1994). Compared with some of the earlier studies that employed RAPDs or AFLPs, the use in this study of SSR markers designed to represent the entire genome, and which were proportional to the size of each chromosome, likely provided a better assessment of diversity.
A significant coefficient of genetic differentiation (PhiPT = 0.110, P ≤ 0.001) was obtained when considering the isolates as two populations (Iran and Canada), which provided additional support for the overall conclusion that these populations are genetically different. Genetic variance was estimated as 11% between the Iranian and Canadian Ptr populations, and as 89% within the two populations (). The relatively low PhiPT value between the two populations might reflect the fact that both populations consisted of the same two races of the fungus. Moreover, given that a relatively moderate gene flow also was calculated between the two populations (Nm = 3.7818) (), it is possible that the two populations exchanged migrants or received them from the same sources (Whitlock & McCauley, Citation1999). The global population structure and migration patterns of Ptr also were evaluated by Gurung et al. (Citation2013) using 12 microsatellite loci. These researchers calculated a G”ST of 0.265 between North American and Australian populations of Ptr, and concluded that the two populations were significantly different (P < 0.001). In contrast, they did not find any significant population differentiation between European and North American, European and Australian, or European and South American Ptr populations. Gurung et al. (Citation2013) also reported that a significant amount of gene flow had taken place from Europe to Australia, Europe to North America and Europe to South America, and also found admixed clusters of isolates collected from different geographic locations, collectively suggesting the likelihood of a common source, likely Europe, for these populations. The present findings also are consistent with other studies on Ptr including those of Leisová et al. (Citation2008), who in a comparison of fungal isolates from the Czech Republic, Slovakia, Russia, Canada, the USA and Argentina, found that 98.1% of genetic variance occurred within populations and only 1.9% was found among populations. Similarly, Mironenko et al. (Citation2007) also found that most of the diversity (72–75%) they observed occurred within populations of Ptr, as opposed to between them, in a collection of isolates from eastern and central Europe.
While genetic diversity (H = 0.27) was fairly high among the isolates examined in this study, it was lower than reported by Aboukhaddour et al. (Citation2011) (H = 0.38) in a study of a global collection of Ptr. This may reflect the fact that only two races (1 and 2) were examined in this study, with the isolates originating from Canada and Iran. In contrast, Aboukhaddour et al. (Citation2011) examined isolates that represented six races (1, 2, 3, 5, 7 and 8) of the tan spot fungus, and which had much wider geographic origins (Azerbaijan, Canada, Algeria and Syria). Similarly, Gurung et al. (Citation2013) also observed a somewhat higher level of gene diversity (H = 0.31 to 0.56) within a global population of Ptr collected from 18 wheat-producing countries on five continents. The genetic diversity observed in the current study also is lower than reported by Mironenko et al. (Citation2016) for populations of the fungus collected from the North Caucasus and north-west regions of Russia (H = 0.75) using marker analysis on 12 SSR loci. However, Mironenko et al. (Citation2016) reported clonal fractions of 3 and 15% in Ptr populations of North Caucasian and Russian origin, respectively, while in the present study only two seemingly clonal isolates were identified. The high number of SSR loci (51) investigated here may help to explain this much lower percentage of clonal individuals. The genetic diversity observed in the Golestan pathogen population (H = 0.2569) was higher than that of the population from Mazandaran (H = 0.1814), possibly reflecting the greater number of isolates examined from Golestan vs. Mazandaran. The mean genetic diversity of the entire Ptr population from Iran (H = 0.2500) was slightly higher than that of the population from Alberta (0.2370). Consistent with the Nei’s genetic diversity, the lowest and highest Shannon’s information indices were observed for the populations collected from Mazandaran (I = 0.2963) and Golestan (I = 0.4604), respectively ().
The current results indicated that Ptr populations from Canada and Iran were grouped based mainly on geographic origin. More studies are needed, however, to further elucidate the effect of geographic origin on genetic differentiation in this fungus worldwide, by analysing Ptr populations from additional countries and continents. Nonetheless, it may be prudent to consider geographic origin, along with capacity to produce the various necrotrophic effectors, when selecting Ptr isolates for use in tan spot resistance screening.
Supplemental Table 1
Download MS Word (19 KB)Acknowledgements
This work was made possible by support from the Natural Sciences and Engineering Research Council (NSERC) of Canada (to S.E.S.) and the Iranian Research Institute of Plant Protection (to H.M.).
Supplemental material
Supplemental data for this article can be accessed online here: https://doi.org/10.1080/07060661.2019.1566178.
Additional information
Funding
Related Research Data
References
- Aboukhaddour R, Cloutier S, Lamari L, Strelkov SE. 2011. Simple sequence repeats and diversity of globally distributed populations of Pyrenophora tritici-repentis. Can J Plant Pathol. 33:389–399.
- Aboukhaddour R, Turkington TK, Strelkov SE. 2013. Race structure of Pyrenophora tritici-repentis (tan spot of wheat) in Alberta, Canada. Can J Plant Pathol. 35:256–268.
- Akhavan A, Turkington TK, Kebede B, Tekauz A, Kutcher R, Kirkham C, Xi K, Kumar K, Tucker J, Strelkov SE. 2015. Prevalence of mating type idiomorphs in Pyrenophora teres f. teres and P. teres f. maculata populations from the Canadian prairies. Can J Plant Pathol. 37:52–60.
- Akhavan A, Turkington TK, Kebede B, Xi K, Kumar K, Tekauz A, Kutcher HR, Tucker JR, Strelkov SE. 2016. Genetic structure of Pyrenophora teres f. teres and P. teres f. maculata populations from western Canada. Eur J Plant Pathol. 146:325–335.
- Ali S, Francl LJ. 2003. A new race of Pyrenophora tritici-repentis from Brazil. Plant Dis. 86:1050.
- Aung TSG 2001. Molecular polymorphism and virulence in Pyrenophora tritici-repentis [ M. Sc. Thesis]. Winnipeg (Canada): University of Manitoba.
- Bogacki P, Keiper FJ, Oldach KH. 2010. Genetic structure of South Australian Pyrenophora teres populations as revealed by microsatellite analyses. Fungal Biol. 114:834–841.
- Ciuffetti LM, Manning VA, Pandelova I, Betts MF, Martinez JP. 2010. Host-selective toxins, Ptr ToxA, and Ptr ToxB, as necrotrophic effectors in the Pyrenophora tritici-repentis-wheat interaction. New Phytol. 187:911–919.
- De Wolf ED, Effertz RJ, Ali S, Francl LJ. 1998. Vistas of tan spot research. Can J Plant Pathol. 20:349–370.
- Dhingra OD, Sinclair JB. 1986. Basic plant pathology methods. Boca Raton (FL): CRC Press; p. 285–315.
- Di Zinno T, Longree H, Maraite H. 1997. Diversity of Pyrenophora tritici-repentis isolates from warm wheat growing areas: pathogenicity, toxin production, and RAPD analysis. In: Duveiller E, Dubin HJ, Reeves J, McNab A, editors 1998. Blights of wheat: spot blotch and tan spot, proceedings of an international workshop. Feb 9-14; CIMMYT, EI Batan, Mexico, publisher: Mexico (DF): CIMMYT; p. 302–314.
- Dice LR. 1945. Measures of the amount of ecologic association between species. Ecology. 26:297–302.
- Effertz RJ, Meinhardt SW, Anderson JA, Jordahl JG, Francl LJ. 2002. Identification of a chlorosis-inducing toxin from Pyrenophora tritici-repentis and the chromosomal location of an insensitivity locus in wheat. Biochem. 92:527–533.
- Friesen TL, Ali S, Klein KK, Rasmussen JB. 2005. Population genetic analysis of a global collection of Pyrenophora tritici-repentis, causal agent of tan spot of wheat. Phytopathology. 95:1144–1150.
- Gurung S, Short DPG, Adhikari TB. 2013. Global population structure and migration patterns suggest significant population differentiation among isolates of Pyrenophora tritici-repentis. Fungal Genet Biol. 52:32–41.
- Lamari L, Bernier CC. 1989. Evaluation of wheat lines and cultivars to tan spot (Pyrenophora tritici-repentis) based on lesion type. Can J Plant Pathol. 11:49–56.
- Lamari L, Sayoud R, Boulif M, Bernier CC. 1995. Identification of a new race in Pyrenophora tritici-repentis: implications for the current pathotype classification system. Can J Plant Pathol. 17:312–318.
- Lamari L, Strelkov SE. 2010. The wheat/Pyrenophora tritici-repentis interaction: progress towards an understanding of tan spot disease. Can J Plant Pathol. 32:4–10.
- Lamari L, Strelkov SE, Yahyaoui A, Amedov M, Saidov M, Djunusova M, Koichibayev M. 2005. Virulence of Pyrenophora tritici-repentis in the countries of the Silk Road. Can J Plant Pathol. 27:383–388.
- Lamari L, Strelkov SE, Yahyaoui A, Orabi J, Smith RB. 2003. The identification of two new races of Pyrenophora tritici- repentis from the host center of diversity confirms a one to one relationship in tan spot of wheat. Phytopathology. 93:391–396.
- Leisová L, Hanzalová A, Kucera L. 2008. Genetic diversity of Pyrenophora tritici-repentis isolates as revealed by AFLP. J Plant Pathol. 90:233–245.
- Lepoint P, Renard ME, Legrève A, Duveiller E, Maraite H. 2010. Genetic diversity of the mating type and toxin production genes in Pyrenophora tritici-repentis. Phytopathology. 100:474–483.
- Lewontin RC. 1972. The apportionment of human diversity. Evol Biol. 6:381–398.
- McDermott JM, McDonald BA. 1993. Gene flow in plant pathosystems. Annu Rev Phytopathol. 31:353–373.
- McDonald BA. 1997. The population genetics of fungi: tools and techniques. Phytopathology. 87:448–453.
- McDonald BA, Miles J, Nelson LR, Pettway RE. 1994. Genetic variability in nuclear DNA in field population of Stagonospora nodorum. Phytopathology. 84:250–255.
- Mehta YR, Mehta A, Riede CR. 2004. Molecular and pathogenic variability of Pyrenophora tritici-repentis isolates causing tan spot of wheat in the state of Paraná, Brazil. Summa Phytopathol. 30:436–444.
- Meinhardt S, Ali S, Ling H, Francl L. 2003. A new race of Pyrenophora tritici-repentis that produces a putative host-selective toxin. In: Rasmussen B, Friesen TL, Ali S, editors Proceedings of the fourth international wheat tan spot and spot blotch workshop. Jul 21–24, 2002; Fargo (ND): Bemidji, Minnesota, USA. North Dakota Agricultural Experiment Station; p. 117–121.
- Mironenko N, Baranova O, Kovalenko N, Mikhailova L, Rosseva L. 2016. Genetic structure of the Russian populations of Pyrenophora tritici-repentis, determined by using microsatellite markers. Russian J Genet. 52:771–779.
- Mironenko N, Timopheeva E, Mikhailova L, Kopahnke D, Kramer I, Ordon F. 2007. Intraspecific genetic diversity of Pyrenophora tritici-repentis (Died.) Drechs. (Drechslera tritici-repentis [Died.] Shoem.) detected by random amplified polymorphic DNA assays. Arch. Phytopathol Plant Protect. 40:431–440.
- Momeni H, Aboukhaddour R, Javan-Nikkhah M, Razavi M, Naghavi MR, Akhavan A, Strelkov SE. 2014. Race identification of Pyrenophora tritici-repentis in Iran. J Plant Pathol. 96:287–294.
- Moreno MV, Stenglein SA, Balatti PA, Perelló AE. 2008. Pathogenic and molecular variability among isolates of Pyrenophora tritici-repentis, causal agent of tan spot of wheat in Argentina. Eur J Plant Pathol. 122:239–252.
- Nei M. 1973. Analysis of gene diversity in subdivided populations. Proc Natl Acad Sci USA. 70:3321–3323.
- Nei M. 1978. Estimation of average heterozygosity and genetic distance from a small number of individuals. Genetics. 89:583–590.
- Peakall R, Smouse PE. 2006. GENALEX 6: genetic analysis in Excel. Population genetic software for teaching and research. Mol Ecol Notes. 6:288–295.
- Rozen S, Skaletsky H. 2000. Primer 3 on for general users and for biological programmers. Methods Mol Biol. 132:365–386.
- Sherwin WB. 2010. Entropy and information approaches to genetic diversity and its expression: genomic geography. Entropy. 12:1765–1798.
- Sherwin WB, Jabot F, Rush R, Rossetto M. 2006. Measurement of biological information with applications from genes to landscapes. Mol Ecol. 15:2857–2869.
- Singh PK, Hughes GR. 2006. Genetic similarity among isolates of Pyrenophora tritici-repentis, causal agent of tan spot of Wheat. J Phytopath. 154:178–184.
- Temnykh S, Declerck G, Lukashova A, Lipovich L, Cartinhour S, Mccouch S. 2001. Computational and experimental analysis of microsatellites in rice (Oryza sativa L.): frequency, length variation, transposon association and genetic marker potential. Genome Res. 11:1441–1452.
- Whitlock MC, McCauley DE. 1999. Indirect measures of gene flow and migration: FST≠ 1/(4Nm+ 1). Heredity. 82:117–125.
- Yeh FC, Yang RC, Boyle T. 1999. POPGENE Version 1, 31. Edmonton (Canada): University of Alberta.
- Ziesman BR, Turkington TK, Basu U, Strelkov SE. 2016. A quantitative PCR system for measuring Sclerotinia sclerotiorum in canola (Brassica napus). Plant Dis. 100:984–990.