
Abstract
The objectives of this work were to investigate the presence of a variety of mycotoxins in Canadian wheat and durum and to characterize the relationship between concentrations of the Fusarium-produced deoxynivalenol (DON) and the presence of visible Fusarium damage. There is a lack of reported mycotoxin surveillance data for Canadian wheat and durum; this work addresses this information gap. Wheat and durum harvest samples from the 2010, 2011 and 2013–2016 growing seasons were analysed for mycotoxins produced by a variety of fungal species, including Fusarium graminearum and Alternaria alternata. The Alternaria-produced tentoxin was observed the most frequently; it was present in 90% of the samples analysed at concentrations up to 0.063 mg kg−1. Fusarium-produced DON and enniatins B and B1 were present in over 70% of samples analysed. The plant transformation product DON-3-glucoside was quantified in up to 30% of samples. There was variability in the presence of the various mycotoxins amongst years. In particular, for DON, the variability reflected the level of visible Fusarium damage noted in grain samples. The geographic source of samples also influenced DON concentrations, which decreased from eastern to western growing regions on the Prairies. Concentrations of DON varied from 0.066 to 0.895 mg kg−1 in south central Manitoba and <0.03 to 0.053 mg kg−1 in central Alberta. DON concentrations were significantly correlated (P < 0.001) with visible Fusarium damage in Canada Western Red Spring wheat for all four years investigated. For Canada Eastern Soft Red Winter wheat and Canada Western Amber Durum, there were significant correlations (P < 0.001) in three of the four years investigated for each grain class. The years with no significant correlation between DON and Fusarium damage occurred when the presence of Fusarium species other than the DON-producing F. graminearum were predominant. This work provides a picture of the presence, and absence, of a number of mycotoxins in Canadian wheat and durum.
Résumé
Les buts de cette étude étaient d’examiner l’occurrence d’une variété de mycotoxines dans le blé canadien, y compris dans le blé dur, et de caractériser la relation entre les concentrations de déoxynivalénol (DON) produit par Fusarium et les dommages visibles causés par ce dernier. Il y a un manque de données relatives à la surveillance des mycotoxines chez le blé canadien et dur: cette étude traite de ce fossé informationnel. Des échantillons de blé et de blé dur prélevés lors des récoltes de 2010, 2011 et de 2013 à 2016 ont été analysés afin d’y déceler des mycotoxines produites par une variété d’espèces fongiques, y compris Fusarium graminearum et Alternaria alternata. La tentoxine, produite par Alternaria, a été la plus courante: on la trouvait à des concentrations atteignant 0.063 mg kg−1 dans 90% des échantillons analysés. Le DON produit par Fusarium et les enniatines B et B1 se trouvaient dans plus de 70% des échantillons analysés. Le produit de transformation de la plante DON-3-glucoside a été quantifié jusque dans 30% des échantillons. Au fil des années, l’occurrence des différentes mycotoxines variait. Particulièrement en ce qui a trait au DON, la variabilité reflétait le taux de dommages visibles causés par Fusarium observé sur les échantillons de grain. La provenance géographique des échantillons a également influencé les concentrations de DON qui décroissaient de l’est vers les régions productrices de l’Ouest canadien. Les concentrations de DON variaient de 0.066 à 0.895 mg kg−1 dans le centre-sud du Manitoba et de < 0.03 à 0.053 mg kg−1 dans le centre de l’Alberta. Les concentrations de DON étaient significativement corrélées (P < 0.001) aux dommages visibles causés par Fusarium chez le blé roux de printemps de l’Ouest canadien, et ce, durant les quatre saisons de croissance étudiées. Quant au blé tendre rouge d’hiver de l’Est canadien et au blé dur ambré de l’Ouest canadien, il y a eu des corrélations significatives (P < 0.001) entre trois des quatre années étudiées pour chaque classe de grain. Les années durant lesquelles il n’y a pas eu de corrélation significative entre le DON et les dommages causés par Fusarium sont celles durant lesquelles des espèces de Fusarium, autres que F. graminearum produisant le DON, prédominaient. Cette étude fournit un profil de l’occurrence, et de l’absence, d’un nombre de mycotoxines chez le blé canadien, y compris le blé dur.
Introduction
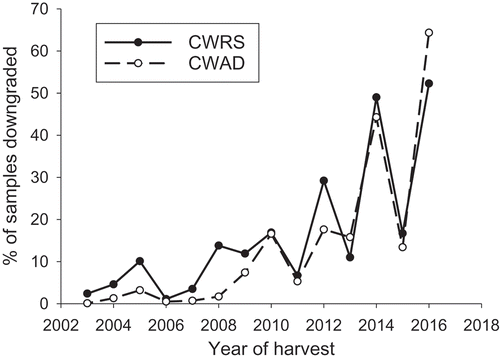
Fungal infections of wheat and durum vary from year-to-year based in part on the prevailing environmental conditions of a growing year. For example, higher than average precipitation across the Canadian Prairies in the 2016 growing season contributed to record high levels of fusarium head blight (Canadian Grain Commission, Citation2018a). This high degree of infection was reflected in the high percentage of samples downgraded against the grading factor of ‘Fusarium damage’ (FUS DMG). In 2016, 52% of Canada Western Red Spring (CWRS) wheat and 64% of Canada Western Amber Durum (CWAD) samples submitted to the Canadian Grain Commission’s Sample Harvest Program were downgraded due to FUS DMG (). The Official Grain Grading Guide defines FUS DMG as ‘thin or shrunken chalk-like kernels with a white or pinkish mould or fibrous growth’, and it is assessed during visual inspection of grain (Canadian Grain Commission, Citation2017). Tolerances for FUS DMG in wheat and durum vary with grade, and are one of many grading factors used to define the quality of grain and its end use functionality.
Fig. 1. Percentage of Canada Western Red Spring (CWRS) and Canada Western Amber Durum (CWAD) producer submitted harvest samples downgraded due to Fusarium damage (FUS DMG). Note that in 2010 the grading tolerances for Fusarium damage in CWRS were made more stringent.
In addition to the variation in the severity and geographic occurrence of fungal infection, the fungal species present also vary. For example, in the 2010 growing season, Fusarium avenaceum and Septoria nodorum were commonly observed in CWAD grown in south-western and central Saskatchewan (Tittlemier, Roscoe, et al., Citation2013). An increased incidence of mildew damage defined as ‘an overall greyish discolouration with grey to black spores typically attached to the brush end of the kernel’ (Canadian Grain Commission, Citation2017) and its causal agents Alternaria alternata and A. infectoria was also observed in 2014 (Tran et al., Citation2016). The variation in the presence of fungal species and the severity of infection they cause results in variation of mycotoxins, and their levels, in harvested grain. There are limited reports on the variety and concentrations of mycotoxins in Canadian grain, particularly multi-year surveillance incorporating samples from the main growing regions of the Prairies. In Canadian grain, deoxynivalenol (DON) is one of the most commonly observed mycotoxins (Tittlemier, Gaba,et al., Citation2013). DON can be produced by F. graminearum and F. culmorum, but in Canada its main source is the ubiquitous F. graminearum. DON is of particular interest because there are maximum limits in place for its presence in wheat and durum in order to manage dietary exposure for consumers. Existing maximum limits relevant for DON in wheat and durum are in the range of 1125–2000 μg kg−1 (European Commission, Citation2006a; Codex Alimentarius Commission, Citation2016).
Other toxigenic Fusarium species infecting Canadian wheat and durum include F. avenaceum, F. poae and F. sporotrichioides. These are known producers of a wide variety of mycotoxins such as moniliformin, beauvericin, enniatins (F. avenaceum), nivalenol (F. poae) and HT-2 and T-2 toxins (F. sporotrichioides) (Frisvad et al., Citation2007). These species are also generally present at much lower abundance than F. graminearum (Canadian Grain Commission, Citation2018b). In addition to Fusarium species, other toxigenic fungi produce mycotoxins that accumulate in grain. For example, A. alternata produces alternariol, alternariol methyl ether, altenuene and tentoxin.
The objectives of this work were to: (1) survey the presence and quantify mycotoxins () produced by a variety of Fusarium and Alternaria species in harvest samples of wheat and durum grown in Canada; and (2) to examine the relationships between the concentration of DON and the degree of FUS DMG in wheat and durum over the course of the surveillance.
Table 1. Mycotoxin analytes and limits of quantitation (LOQ).
Materials and methods
Samples – individual
Samples of CWRS, CWAD and Canada Eastern Soft Red Winter (CESRW) were obtained through the Canadian Grain Commission’s Harvest Sample Program. Each year the Harvest Sample Program procures newly harvested crop that is voluntarily sampled at harvest by producers for use in annual harvest quality assessments, monitoring and research.
Sampling instructions were provided to producers prior to harvest as part of the Harvest Sample Program communications. Instructions directed producers to take many small samples of moving grain during storage bin filling or truck unloading to prepare a larger sample representative of the harvested grain. Specific details on the equipment and techniques to sample grain were provided at www.grainscanada.gc.ca/guides-guides/rs-er/rep-grain-sam-en.htm.
Samples were examined by Canadian Grain Commission inspectors upon reception. Samples were systematically selected to cover a range of FUS DMG and growing locations, every nth sample on a list of samples ranked from low to high FUS DMG was chosen for mycotoxin analysis to form a sub-set of ~50 samples from each class. Samples were sub-divided using a Boerner divider (Seedburo Equipment Company, Des Plaines, IL, USA) to obtain laboratory samples of 100–300 g. The laboratory samples were re-inspected for FUS DMG to obtain a FUS DMG value directly related to the portion of grain analysed for mycotoxins.
Samples – CWAD and CWRS composites
As part of the routine annual process, composites representing wheat and durum are prepared each year to assess harvest quality and end use functionality. Portions of the CWAD and CWRS composites were obtained for mycotoxin analysis.
Composites of CWAD representing grades from ‘1 CWAD’ down to ‘5 CWAD’ were made by combining equal masses from all available individual producer-submitted samples receiving a particular grade each year. The number of individual samples incorporated into each composite varied each year according to the number of samples submitted to the Harvest Sample Program as well as the quality of grain. For example, for 2016 the number of individual samples used to prepare the CWAD grade composites ranged from 52 samples of 4 CWAD to 304 samples of 3 CWAD. Because the quality of crops can vary amongst years, there are not necessarily samples available at each grade to make all grade composites for each harvest. In total, 21 CWAD composites were analysed for mycotoxins; 15 were overall grade composites and represented the entire CWAD growing area on the Prairies. In 2015, six composites were made based on grade and growing region.
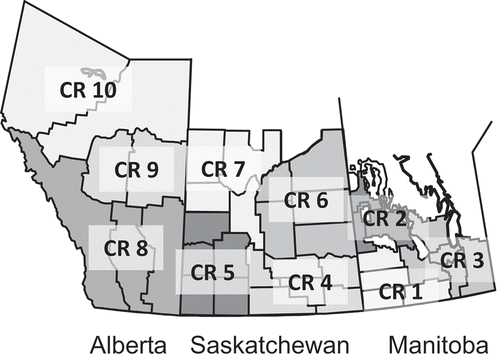
Composites of CWRS were made based on grade and growing region (). These composites (n = 67) were made in a similar fashion to the CWAD grade composites described above. Equal masses from all available individual samples from a particular region receiving a particular grade were combined. One additional composite was made in 2013 for samples receiving a ‘3 CWRS’ grade. This composite represented all crop regions. All 68 composites were analysed for mycotoxins.
Fig. 2. Crop regions (CR) of western Canada.
After combining all of the individual CWAD or CWRS to make the appropriate composites, each composite was then mixed by passing through a Boerner divider (Seedburo Equipment Company) or a double cone blender (Patterson Industries). Laboratory samples for mycotoxin analysis (100–300 g) were split from the larger composite using a Boerner divider.
Fusarium damage assessment
FUS DMG was quantified in each sample by experienced Canadian Grain Commission inspectors following the procedure outlined in the Official Grain Grading Guide (Canadian Grain Commission, Citation2017). A Boerner divider was used to obtain a representative portion of the submitted grain prior to inspection. All kernels showing any evidence of FUS DMG, including those with a chalk-like appearance, were separated from the bulk. The separated kernels were examined with a 10-power magnifying lens to confirm the presence of white or pinkish mould or fibrous growth. The mass of Fusarium damaged kernels was determined using a top loading balance. The FUS DMG of samples was calculated as the percentage of kernels with white or pinkish mould or fibrous growth in the representative portion inspected, on a mass basis.
Mycotoxin analysis
Sample preparation
Prior to analysis, the entire laboratory sample (100–300 g) for all individual and composite samples was ground using a commercial coffee grinder on the finest grind setting (Model KR 804, Ditting Maschinen AG, Switzerland). Samples were ground fine enough that ≥ 85% of mass passed through a US 50 sieve (nominal sieve openings of 300 μm). Ground samples were stored at room temperature (range of – –C) in sealed plastic containers to prevent insect infestation. Samples were stored up to 7 months before mycotoxin analyses occurred. Two comprehensive instrumental methods were used to analyse samples for mycotoxins over the course of the surveillance. Samples from 2014 and earlier were analysed using an established solvent extraction gas chromatographic-mass spectrometric (GC-MS) method outlined in Clear et al. (Citation2005). This method analysed for 9 Fusarium-produced mycotoxins ().
Methodology
A method based on high performance liquid chromatography with tandem mass spectrometry (HPLC-MS/MS) was developed to remove the need for analyte derivatization and to expand the scope of analyses to a wider variety of mycotoxins. The HPLC-MS/MS method covered 25 analytes, 7 of which were a part of the earlier GC-MS method. FUS-X and DAS were excluded from the HPLC-MS/MS method because they had not been detected in over two decades of previous grain monitoring and were not regulated by maximum limits. The new analytes were added to the HPLC-MS/MS method for a variety of reasons. Some had previously been detected, or structurally related mycotoxins had previously been detected, in Canadian grain (OTA, CIT, AOH, AME, ALT, TENT) (Scott et al., Citation2012; Tittlemier et al., Citation2014). Others are regulated by existing maximum limits and are of interest to the international grain trade (AFB1, AFB2, AFG1, AFG2, FB1, FB2). The depsipeptides BEAU, ENN A, ENN A1, ENN B and ENN B1 and the plant metabolite D3G were incorporated into the HPLC-MS/MS method because they were not being thoroughly studied in Canadian grain and they have been reported in grain from Europe (Jestoi et al., Citation2004; Berthiller et al., Citation2013). The depsipeptides also had new commercial analytical standards available. The HPLC-MS/MS method was used to analyse samples from the 2015 harvest onwards.
In the HPLC-MS/MS method, ground sample (100 g) was extracted with acetonitrile/water/acetic acid (74/25/1, v/v/v) at a ratio of 1:4 (m/v). The mixture was shaken on a flatbed shaker (Eberbach, model 6010) for 20 min, after which 40 mL of supernatant was centrifuged at 1096 × g for 10 min at 20°C. An aliquot of supernatant was diluted 16-fold with 95.5% 5 mM ammonium acetate in water/0.5% acetic acid (v/v). All stable isotope labelled 13C internal standards (Supplemental Table 1) were added to the diluted sample extract prior to HPLC-MS/MS analysis of a 20 μL injection.
Analytical procedures
For both GC-MS and HPLC-MS/MS analyses, a number of quality control samples were processed and analysed alongside harvest samples to monitor analytical method performance. These quality control samples included matrix blanks to monitor for contamination, as well as matrix blanks fortified prior to extraction with all mycotoxin analytes and commercially available reference materials to monitor accuracy and precision. Matrix blanks used were wheat samples that contained low concentrations of all four enniatins, TENT and BEAU (at 0.5 to 37 μg kg−1) and no other quantifiable mycotoxins when analysed in previous monitoring or research activities. Wheat reference materials with known concentrations of DON, OTA and ZEAR were obtained from Trilogy Analytical Laboratory (Washington, MO, USA).
Participation in international proficiency tests was also used to assess the performance of both the GC-MS and HPLC-MS/MS methods during the years of harvest sample analysis. Over the 7 years of surveillance, samples from proficiency tests organized by Fera Science Ltd, UK (Fapas) and the Belgian Federal Veterinary and Agrochemical Research Centre (CODA-CERVA), as well as a check sample programme by Neogen (Lansig, MI, USA), were routinely analysed.
Analysis was performed on an AB Sciex 5500 TQ tandem mass spectrometer coupled to a Waters Acquity I Class ultra-high pressure liquid chromatography system consisting of an Acquity binary solvent manager, an Acquity FTN sample manager, and an Acquity column manager fitted with a Phenomenex Kinetex 2.6 μm XB-C18 (50 × 2.1 mm) column held at 40°C. A linear gradient HPLC programme using 95.5% 5 mM ammonium acetate in water/0.5% acetic acid (v/v) and 95.5% 5 mM ammonium acetate in methanol/0.5% acetic acid (v/v) as mobile phases A and B, respectively separated the mycotoxin analytes listed in . The initial mobile phase was 98% A, changing to 30% A at 15 min and 2% A at 15.7 min. The mobile phase was changed back to the initial 98% A at 18.2 min and held there until the end of the run at 20 min.
Mass spectrometric analysis was performed using electrospray ionization with polarity switching. The following mass spectrometer parameters were used: ion spray voltage ±4500 V (depending on analyte), source temperature 550°C, curtain gas (N2) 25 psi, ion source gases (N2) 60 and 70 psi, and collision gas (N2) 9 psi. The transitions monitored and used to identify and quantify each of the mycotoxin analytes are listed in Supplemental table 1.
Mycotoxin analytes were quantified using a calibration curve constructed from seven external standards. Peak areas from quantitation transitions were normalized to the peak area of 13C-labelled internal standard during data analysis in order to counter matrix effects on quantitation prior to interpolation of analyte concentration from the calibration curve. Isotope-labelled structural analogues were not commercially available for AOH, AME, ALT, TENT, BEAU, ENN A, ENN A1, ENN B and ENN B1, therefore peak areas from their quantitation transitions were normalized to 13C34-FB1. Analyte recoveries were calculated from pre-extraction fortified blanks analysed with each sample batch. Mycotoxin concentrations in samples and reference materials were corrected for recovery using the batch-specific recoveries determined for the pre-extraction fortified blanks. Analytes were considered to be identified and were quantified in samples when their retention time was within 0.1 min of the mean retention time in external standards used to construct the calibration curve, the ratio of qualifier to quantitation transition was within ± 30% of the mean ratio in external standards used to construct the calibration curve, and the peak area signal-to-noise ratio was at least 10:1.
The HPLC-MS/MS method was validated before beginning the analysis of the samples from the 2015 harvest. Accuracy and recovery were evaluated using blank wheat (n = 7) fortified with all analytes at low, medium and high concentrations (Supplemental Table 2) and extracted and analysed according to the method described above. This was performed on three separate days to generate 21 measurements of per cent recovery of each analyte at each of the three concentrations. Method accuracy was determined as the per cent recovery of analyte from the fortified blank wheat. Method precision was determined under repeatability conditions as the relative standard deviation of per cent recovery for each analyte.
Low concentrations of all four enniatins, tentoxin and beauvericin (0.5 to 37 μg kg−1) were present in the blank wheat, therefore these concentrations were subtracted from the fortified blank samples during method validation data analysis. Limits of quantitation (LOQ) were estimated as the concentration of analyte that produced a signal to noise ratio of at least 10:1.
Results generated by the HPLC-MS/MS and GC-MS methods were also directly compared. Two test portions from wheat and durum samples (n = 47), including CWRS and CESRW classes, were prepared from ground samples using a rotary sample divider to minimize variance due to sample heterogeneity. One test portion was analysed using each of the two methods. Correlation between the mycotoxin concentrations measured by the two methods was determined using a linear regression.
Results
HPLC-MS/MS validation
A comprehensive instrumental method was developed and validated for the analysis of multiple mycotoxins in wheat and durum. The method accuracy was generally very good. Out of the 25 analytes, 15 had overall mean recoveries between 80 and 120% (Supplemental table 2), including DON, OTA, ZEAR and the four aflatoxins. In addition, recoveries of DON, HT2, T2, OTA, ZEAR, AFB1, AFB2,AFG1 and AFG2 all met European recommended values (European Commission, Citation2006b). Recoveries of FB1 and FB2 were lower than recommended.
The remaining 10 analytes were split with CIT (28%), FB1 (44%), FB2 (56%), 15-ADON (78%) and D3G (78%) having lower mean recoveries and HT2 (128%), BEAU (131%), AOH (128%), AME (125%) and ALT (127%) with higher mean recoveries. The low recoveries of FB1 and FB2 likely reflect losses during sample extraction and analysis, because the isotope-labelled 13C34-FB1 was used during data analysis to minimize the impact of matrix effects. CIT, 15-ADON, D3G, BEAU, AOH, AME and ALT did not have structurally analogous 13C stable isotope labelled internal standards. Therefore a structurally dissimilar compound (13C34-FB1) was used as an internal standard (Supplemental table 1) during data analysis. Comparisons of standards prepared in solvent and wheat matrix extract suggest the use of 13C34-FB1 contributed to a signal enhancement of ~20% for BEAU, AOH, AME and ALT (data not shown).
The precision of the method was good, as the per cent relative standard deviation of recovery across all concentrations and days of validation was between 17 and 22% for 22 of the analytes. The remaining three analytes had precision of 26% (OTA), 29% (FB1) and 30% (FB2).
Quality control of mycotoxin analyses
Results for the analysis of two reference materials for DON (725 ± 78 μg kg−1, n = 71; 956 ± 94 μg kg−1, n = 61) were similar to the reference values of 700 ± 100 and 1000 ± 200 μg kg−1. Results from the analysis of OTA (4.4 ± 0.7 μg kg−1, n = 63), DON (629 ± 74 μg kg−1, n = 63) and ZEAR (106 ± 10 μg kg−1, n = 64) by the HPLC-MS/MS method also compared favourably to the reference values of 4.2 ± 1.8 μg kg−1 (OTA), 700 ± 100 μg kg−1 (DON) and 98.3 ± 14.3 μg kg−1 (ZEAR). Analysis of wheat reference materials showed very good accuracy and precision for the analytes covered.
In addition, the GC-MS method passed all but two proficiency tests taken for mycotoxins in cereal grains. Passing results (i.e. Z-score between −2 and +2) were obtained for DON (29 tests), HT2 and T2 (5), ZEAR (2) and NIV (1). Two unsatisfactory results occurred for DON. The HPLC-MS/MS method passed all but one proficiency test. Passing results were obtained for DON (8 tests), ZEAR (7), T2 and HT2 (6), OTA (5), 3-ADON (4), 15-ADON and NIV (3), FB1, FB2, AFB1, AFB2, AFG1 and AFG2 (1). Only one unsatisfactory result was obtained, for 15-ADON. Accurate reference material and proficiency testing results were obtained over the period of use of the GC-MS and HPLC-MS/MS methods and therefore demonstrate long-term good performance of the methods for this study. There was also a very good correlation of results between the two methods when portions of the same samples were analysed (HPLC-MS/MS DON = 1.151 GS-MS DON – 0.025, and R2 = 0.930, Pearson Product Moment Correlation P < 0.00001).
Occurrence of mycotoxins
and summarize the occurrence and quantitation of mycotoxins in CWRS and CWAD harvest sample composites. 3-ADON, 15-ADON, ZEAR, HT2, T2, NIV, ALT, OTA, CIT, FUS X, DAS, aflatoxins and fumonisins were not detected in any of the samples.
The Alternaria toxin TENT was observed the most frequently in the harvest sample composites for both CWRS and CWAD. Approximately 90% of the composites analysed contained quantifiable concentrations of TENT. For CWAD, Fusarium-produced DON, ENN A1, ENN B and ENN B1 were present in over 70% of composites, while for CWRS only DON and ENN B were present in over 70% of composites. BEAU and ENN A were found less often, followed by lower occurrences of the Alternaria-produced AME and AOH. Just under 30% of CWAD and CWRS composites contained D3G, with the mean ratio of D3G concentration to parent DON concentration in composite samples at 0.18 in CWAD and 0.14 in CWRS.
and summarize the results for DON in composites representing grade (CWAD) or grade and region (CWRS). Investigation of the relationships between mycotoxins and growing year, location and grade focused on DON because it was the mycotoxin measured over the widest range of years by both of the analytical methods used in this study.
Relationship between Fusarium damage and DON
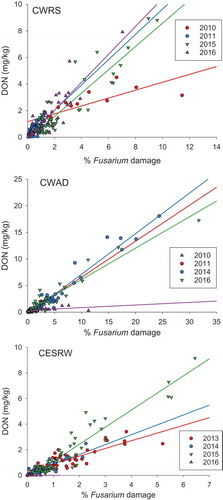
The relationships between FUS DMG and DON are shown in and the linear regression parameters for the relationships are provided in . For CWRS, CWAD and CESRW there were significant linear relationships (all P < 0.001, linear regression, SigmaPlot 13) between FUS DMG and DON in all years aside from a few exceptions. There was no significant relationship between FUS DMG and DON in 2010 for CWAD, and 2016 for CESRW. The linear relationships for all years combined were also significant (P < 0.001).
Fig. 3. (Colour Online)Relationships between deoxynivalenol (DON) and Fusarium damage in Canada Western Red Spring (CWRS), Canada Western Amber Durum (CWAD) and Canada Eastern Soft Red Winter (CESRW) observed for different years of harvest. Regression equation parameters for the relationships shown in the figure are listed in .
Discussion
Occurrence of mycotoxins
Fusarium mycotoxins were predominant in the CWRS and CWAD harvest composites analysed. Even though the Alternaria-produced TENT was measured the most frequently, 7 of the 10 mycotoxins quantitated in harvest composite samples were Fusarium-produced. The frequent occurrence of DON and depsipeptides observed is consistent with past research. In 2010, DON was measured in 75% of CWAD and 48% of individual, as opposed to composite, harvest wheat samples analysed. Depsipeptides were measured in 100% of the CWAD samples analysed (Tittlemier, Roscoe, et al., Citation2013). One notable difference is the lower concentrations of depsipeptides in 2013 through 2016 CWAD composites () as compared with those reported in 2010 CWAD, a year with noted F. avenaceum presence in CWAD. In 2010, the mean total concentration of F. avenaceum-produced depsipeptides in CWAD was 1.0 mg kg−1 whereas it was 0.21 mg kg−1 for the composites from 2013–2016 harvests (Tittlemier, Roscoe, et al., Citation2013), suggesting the conditions that supported the production of higher amounts of depsipeptides in 2010 were not present in 2013–2016.
Table 2. Mycotoxins quantified in Canada Western Amber Durum 2013–2016 harvest sample composites. Samples include both grade and regional composites.
This work contains the first reports of the natural occurrence of D3G in Canadian wheat and durum. D3G is a transformation product of the mycotoxin DON and is formed in planta as a defence mechanism (Berthiller et al., Citation2013). The ratios of D3G to DON observed in CWAD (0.18) and CWRS (0.14) are similar to those reported for wheat from northern Europe (Lemmens et al., Citation2016), and therefore do not suggest a wide difference in the ability of the common Canadian wheat and durum varieties to form D3G from DON.
There are very few previous reports of Alternaria toxins in Canadian wheat and durum as of October 2018. Tran et al. (Citation2016) observed total concentrations ranging from ~0.025–0.25 mg kg−1 in CWRS reported as the sum of AOH, AME, ALT and TENT. Total concentrations of the same Alternaria mycotoxins measured in the CWRS harvest composites from 2013–2016 were in a lower range of 0.006–0.037 mg kg−1. Tran et al. (Citation2016) focused on individual harvest samples from 2014 that had mildew damage as the primary grading factor as defined by the Canadian Grain Commission (Canadian Grain Commission, Citation2017). Therefore, due to the relationship between Alternaria presence and visible mildew damage, it is expected that the sample set studied by Tran et al. (Citation2016) would contain more Alternaria mycotoxins as compared with the composite samples that represented entire harvests.
Another study analysed Alternaria mycotoxins in grain-based foods purchased at the retail level in Canada (Scott et al., Citation2012). This study reported a much higher frequency of occurrence of AME (78%) and AOH (86%) in samples analysed. TENT was not part of their analytical method. The lower frequency of occurrence for AME and AOH in our study (at ~13%) is likely due to differences in method sensitivities as the median concentrations of AME (0.003 mg kg−1) and AOH (0.001 mg kg−1) observed by Scott et al. (Citation2012) were below the LOQ of 0.004 mg kg−1 of our method. Nevertheless, the harvest composite results suggest that the conditions for production of the Alternaria-produced TENT are common across the Prairies.
The limited variety of mycotoxins present in the analysed samples was not unexpected. Fumonisins, aflatoxins, FUS X and DAS have not been reported in Canadian wheat and durum (Martos et al., Citation2010; Tittlemier, Gaba, et al., Citation2013). OTA and CIT are storage related and are not expected to be in harvest samples. NIV, ZEAR, ADONs, HT2 and T2 have been found only infrequently in samples from small geographic areas, as opposed to across the Prairies (Gräfenhan et al., Citation2013), and are therefore unlikely to be detected in composites.
Relationship between DON, harvest year, grade and growing region
In years such as 2016 when FUS DMG was a predominant downgrading factor () there was a noticeable increase in DON concentrations as sample quality decreased (). In 2016, DON concentrations increased from 0.188 mg kg−1 in the 1 CWAD composite to 3.129 mg kg−1 in the 5 CWAD composite. As described in subsequent sections, there is a significant relationship between DON concentrations and the amount of FUS DMG visually identified in a sample. Therefore, it is not unexpected that when FUS DMG is a major cause of downgrading in a particular harvest year, DON concentrations are related to sample grades. This relationship between DON and grade has also been observed in shipments of wheat and durum where median DON concentrations were higher in lower quality grades (Tittlemier, Gaba, et al., Citation2013). A similar relationship of increasing concentrations with lower quality grades was also noted in harvest samples from 2010 for the depsipeptides mycotoxins and moniliformin (Tittlemier, Roscoe, et al., Citation2013). These mycotoxins are associated with F. avenaceum, a species that will also produce visual FUS DMG that could lead to downgrading.
Table 3. Mycotoxins quantified in Canada Western Red Spring 2013–2016 harvest sample composites. Samples include both grade and regional composites.
Table 4. DON (mg kg−1) in harvest sample grade composites of Canada Western Amber Durum (CWAD).
The results presented in also illustrate variability in DON concentration within a grade, but amongst harvest years. The variability in DON reflects the year-to-year variability in the level of FUS DMG that is apparent in . This variability is due to environmental conditions that affect Fusarium infection of CWAD, as well as the predominant Fusarium species in a given year.
In addition, within a harvest year and grade, there is a gradient of DON concentrations that decreases from eastern to western growing regions on the Prairies. presents results from composites that represent CWRS of a particular grade grown in a specific region (). Concentrations of DON are generally highest in composites made of CWRS from crop regions 1, 2 and 3 in Manitoba, followed by crop regions 4 and 6 in eastern Saskatchewan.
Table 5. DON (mg kg−1) in regional composites of Canada Western Red Spring (CWRS).
Relationship between Fusarium damage and DON
For most years studied, there was a significant linear relationship between FUS DMG and DON in harvest samples (), indicating that the observed FUS DMG was caused by DON-producing Fusarium species. Relationships between visual symptoms of FUS DMG and DON concentrations in wheat have been reported in many other studies as well. Paul et al. (Citation2005) performed a meta-analysis of 163 studies and found that out of a variety of visual markers of fusarium head blight infection, the amount of Fusarium-damaged kernels had the strongest relationship with DON concentrations. Significant correlations between FUS DMG and DON in wheat and durum have been reported for grain grown in Canada (Dexter & Nowicki, Citation2003), the USA (Manthey et al., Citation2004), Poland (Perkowski et al., Citation1990) and the Czech Republic (Polisenska & Tvaruzek, Citation2007). Comparing parameters of the correlations amongst studies is difficult though, as there are differences in what is considered ‘damage’, as well as in how FUS DMG is assessed. As discussed below, the relationships are also affected by environmental and agronomic factors that can also vary from year to year.
Table 6. DON and % Fusarium damage linear relationship parameters for various harvest years.
Exceptions in the presence of FUS DMG-DON relationships occurred for CWAD in 2010 and CESRW in 2016. Similar variations were also noted amongst study years in the analogous relationship between ‘visually scabby kernels’ and DON in the Czech Republic (Polisenska & Tvaruzek, Citation2007).
The absence of relationships could be due to a number of factors. It may reflect years with low amounts of FUS DMG, such as in 2016 in eastern Canada. In this year, only 9 of the 29 CESRW samples analysed had reported FUS DMG with a mean of 0.18% (data not shown). The FUS DMG in these samples met the tolerance of 1.0% for a top grade (Canadian Grain Commission, Citation2017) and were therefore not downgraded. Only two of the 9 CESRW with FUS DMG had quantifiable DON. The DON present in these two samples was at very low concentrations (0.059 and 0.075 mg kg−1).
The absence of relationships could also reflect years when FUS DMG was not from DON-producing species. This was the case for CWAD in 2010. In more than 70% of the samples analysed, F. avenaceum was identified as a major causal agent of FUS DMG (Tittlemier, Roscoe, et al., Citation2013). This Fusarium species does not produce DON; it produces mycotoxins such as moniliformin, beauvericin and the enniatins (Frisvad et al., Citation2007). The predominance of F. avenaceum is consistent with results from harvest surveys performed between 1995 and 2008, which also observed F. avenaceum as the main causal agent of FUS DMG on CWAD in crop regions 4, 5 and southern central and western portions of 6 and 7 in Saskatchewan (Clear & Patrick, Citation2010). Damage from species other than those that produce DON was also hypothesized as the reason for the poor correlation between ‘visually scabby kernels’ and DON in wheat grown in the Czech Republic in 2005 (Polisenska & Tvaruzek, Citation2007).
The parameters from the regressions listed in suggest that more DON is associated with FUS DMG for CESRW and CWRS than CWAD. A variety of factors can play a role in the difference in DON-FUS DMG relationships amongst classes. The susceptibility of wheat species to Fusarium infection could vary amongst classes. Environmental factors, such as the presence of DON-producing Fusarium species, may play a role in this case. Higher occurrence of F. avenaceum has been observed in southern Saskatchewan (Clear & Patrick, Citation2010), which is a large producer of CWAD.
Spatial distribution of F. graminearum chemotypes may also play a role in the lower DON- FUS DMG relationship observed for CWAD. Foroud et al. (Citation2012) observed higher DON accumulation in some wheat genotypes inoculated with 3-ADON vs 15-ADON F. graminearum chemotypes. The 3-ADON chemotype was observed to be more predominant in CWRS from Manitoba, while 15-ADON was predominant in CWAD from Saskatchewan and Alberta in 2011 (Canadian Grain Commission, Citation2018b).
Conclusions
From 2010 through 2016, Fusarium-produced mycotoxins were predominant in CWRS and CWAD harvest composite samples. The Alternaria-produced tentoxin was the most frequently observed mycotoxin, but DON, BEAU and enniatins were also common in the composite samples. While analysis of composites would dilute the presence of infrequently occurring mycotoxins, this analysis provided a comprehensive view of mycotoxins present in CWRS and CWAD.
In years when FUS DMG was a predominant downgrading factor, such as 2016, there was a noticeable increase in DON concentrations as sample grades decreased to lower quality. There was also a decrease in DON concentrations in CWRS regional composites from eastern to western growing regions on the Prairies. DON concentrations were significantly correlated with FUS DMG in CESRW, CWRS and CWAD, however some exceptions were noted when conditions during growing seasons affected this relationship. Parameters of the DON-FUS DMG relationship also suggested that more DON is associated with FUS DMG in CESRW and CWRS than CWAD.
Supplemental Material
Download MS Word (30.1 KB)Acknowledgements
Grain inspectors from Industry Services at the Canadian Grain Commission provided their invaluable expertise in assessing harvest samples for Fusarium damage during the entire monitoring period.
Supplementary material
Supplemental data for this article can be accessed online here: https://doi.org/10.1080/07060661.2019.1592784.
References
- Berthiller F, Crews C, Dall’Asta C, De Saeger S, Haesaert G, Karlovsky P, Oswald IP, Seefelder W, Speijers G, Stroka J. 2013. Mased mycotoxins: a review. Mol Nutr Food Res. 57(1):165–186.
- Canadian Grain Commission. 2017. Official Grain Grading Guide. Winnipeg (MB); [ accessed 2018 Jan 26] https://www.grainscanada.gc.ca/oggg-gocg/ggg-gcg-eng.htm.
- Canadian Grain Commission. 2018a. Fusarium head blight in Canadian wheat, maps and charts 2011 to 2016. Winnipeg (MB); [ accessed 2018 Jan 26] https://www.grainscanada.gc.ca/str-rst/fusarium/fhbmc-feccg-en.htm.
- Canadian Grain Commission. 2018b. Fusarium head blight in Western Canada, maps. Winnipeg (MB); [ accessed 2018 Jan 26] https://www.grainscanada.gc.ca/str-rst/fusarium/fhbmc-feccg-en.htm#westmaps.
- Clear RM, Patrick S. 2010. Fusarium graminearum and other fungi isolated from fusarium-damaged kernels of Canadian wheat, 1999 to 2008. Can Plant Dis Surv. 90:88–90.
- Clear RM, Patrick SK, Gaba D, Abramson D, Smith DM. 2005. Prevalence of fungi and fusariotoxins on hard red spring and amber durum wheat seed from western Canada, 2000 to 2002. Can J Plant Pathol. 27(4):528−540.
- Codex Alimentarius Commission. 2016. CODEX STAN 193-1995. Codex general standard for contaminants and toxins in food and feed. [ accessed 2018 Jan 26]. http://www.fao.org/fileadmin/user_upload/livestockgov/documents/1_CXS_193e.pdf.
- Dexter JE, Nowicki TW. 2003. Safety assurance and quality assurance issues associated with Fusairum head blight in wheat. In: Leonard KJ, Bushnell WR, editors. Fusarium head blight of wheat and barley. St. Paul (MN): The American Phytopathological Society; p. 420–460.
- European Commission. 2006a. Commission regulation (EC) No. 1881/2006 setting maimum levels for certain contaminants in foodstuffs. [ accessed 2018 Jul 05]. https://eur-lex.europa.eu/legal-content/EN/TXT/PDF/?uri=CELEX:32006R1881&from=EN.
- European Commission. 2006b. Commission regulation (EC) No. 401/2006 Laying down the methods of sampling and analysis for the official control of the levels of mycotoxins in foodstuffs. [ accessed 2018 Jul 05]. https://eur-lex.europa.eu/legal-content/EN/TXT/PDF/?uri=CELEX:32006R0401&from=EN.
- Foroud NA, McCormick SP, MacMillan T, Badea A, Kendra DF, Ellis BE, Eudes F. 2012. Greenhouse studies reveal increased aggressiveness of emergent Canadian Fusarium graminearum chemotypes in wheat. Plant Dis. 96(9):1271–1279.
- Frisvad JC, Thrane U, Samson RA. 2007. Mycotoxin Producers. In: Dijksterhuis J, Samson RA, editors. Food mycology: a multifaceted approach to fungi and food. Boca Raton ((FL)): CRC Press Inc.; p. 135–159.
- Gräfenhan T, Patrick SK, Roscoe M, Trelka R, Gaba D, Chan JM, McKendry T, Clear RM, Tittlemier SA. 2013. Fusarium damage in cereal grains from western Canada. 1. Phylogenetic analysis of moniliformin producing Fusarium species and their natural occurrence in mycotoxin contaminated wheat, oats, and rye. J Agric Food Chem. 61:5425–5437.
- Jestoi M, Rokka M, Yli-Mattila T, Parikka P, Rizzo A, Peltonen K. 2004. Presence and concentrations of the Fusarium-related mycotoxins beauvericin, enniatins and moniliformin in Finnish grain samples. Food Addit Contam. 21(8):794–802.
- Lemmens M, Steiner B, Sulyok M, Nicholson P, Mesterhazy A, Buerstmayr H. 2016. Masked mycotoxins: does breeding for enhanced Fusarium head blight resistance result in more deoxynivalenol-3-glucoside in new wheat varieties? World Mycotoxin J. 9(5):741–754.
- Manthey FA, Wolf-Hall CE, Yalla S, Vijayakumar C, Carlson D. 2004. Microbial loads, mycotoxins, and quality of durum wheat from the 2001 harvest of the Northern Plains region of the United States. J Food Prot. 67(4):772–780.
- Martos PA, Thompson W, Diaz GJ. 2010. Multiresidue mycotoxin analysis in wheat, barley, oats, rye and maize grain by high performance liquid chormatography-tandem mass spectrometry. World Mycotoxin J. 3(3):205–223.
- Paul PA, Lipps PE, Madden LV. 2005. Relationship between visual estimates of Fusarium head blight intensity and deoxynivalenol accumulation in harvested wheat grain: a meta-analysis. Phytopathology. 95(10):1225–1236.
- Perkowski J, Chelkowski J, Blazczak P, Snijders CHA, Wakulinksi W 1990. A study of the correlations between the amount of deoxynivalenol in grain of wheat and triticale and percentage of Fusarium damaged kernels. Proceedings of the 2nd European Seminar on Fusarium: Mycotoxins, Taxonomy, Pathogenicity; Sep 5-7; Poznan, Poland. p. 102–114.
- Polisenska I, Tvaruzek L. 2007. Relationships between deoxynivalenol content, presence of kernels infected by Fusarium spp. pathogens and visually scabby kernels in Czech wheat in 2003-2005. Cereal Res Comm. 35(3):1437–1448.
- Scott P, Zhao W, Feng S, Lau BY. 2012. Alternaria toxins alternariol and alternariol monomethyl ether in grain foods in Canada. Mycotoxin Res. 28(4):261–266.
- Tittlemier SA, Gaba D, Chan JM. 2013. Monitoring of Fusarium trichothecenes in Canadian cereal grain shipments from 2010 to 2012. J Agric Food Chem. 61:7412–7418.
- Tittlemier SA, Roscoe M, Blagden R, Kobialka C. 2014. Occurrence of ochratoxin A in Canadian wheat shipments, 2010-2012. Food Addit Contam Part A. 31(5):910–916.
- Tittlemier SA, Roscoe M, Trelka R, Gaba D, Chan JM, Patrick SK, Sulyok M, Krska R, McKendry T, Gräfenhan T. 2013. Fusarium damage in small cereal grains from western Canada. 2. Occurrence of Fusarium toxins and their source organisms in durum wheat harvested in 2010. J Agric Food Chem. 61:5438–5448.
- Tran M, Patrick SK, Bamforth JM, Roscoe M, Tittlemier SA, Gräfenhan T 2016. Application of bio-molecular methods for the quantification of mildew damage and its causal agents in hard red spring wheat from western Canada. Poster session presented at: WMFmeetsIUPAC; Jun 6-9; Winnipeg, MB, Canada.