
Abstract
Fusarium head blight (FHB), primarily incited by Fusarium graminearum Schwabe, is the most devastating disease of barley (Hordeum vulgare L.) in Canada. Contaminated grains are unsuitable for use as livestock feed or by the malting industry, primarily due to contamination by mycotoxins such as deoxynivalenol (DON). Reducing DON content has been a long-term goal of barley breeders; however, the complex genetics of resistance and laborious testing required have made it difficult to develop resistant cultivars. An Illumina 50 K SNP beadchip was used to genotype a diverse collection (n = 400) of two-row barley genotypes, selected primarily from North American-breeding programs. This genomic panel was phenotyped in three environments in Manitoba, Canada, over two growing seasons. Genotypes were evaluated for heading date, height, FHB score, and DON content. A genome-wide association study (GWAS) was carried out using a mixed linear model (MLM: Q + K) accounting for population structure (Q) and kinship (K) as covariates. This study characterized the population structure of two-row barley germplasm important to North American-breeding programs. Significant marker-trait associations were identified on all chromosomes for FHB, and on all chromosomesexcept 1 H and 6 H for DON content. Individual marker effects were small, explaining only up to 5% of the phenotypic variation. Genes within genomic regions that were associated with FHB-related traits displayed multiple functions linked with disease resistance. While numerous minor, marker-trait associations were identified, phenotypic evaluations are still the best predictors of these traits, despite their time-consuming nature and dependenceon environmental conditions.
Résumé
La brûlure de l’épi causée par le fusarium (BEF), provoquée principalement par Fusarium graminearum Schwabe, est la maladie de l’orge (Hordeum vulgare L.) la plus dévastatrice au Canada. Les grains contaminés ne peuvent être utilisés pour l’alimentation du bétail ni par l’industrie brassicole, notamment à cause de la contamination par des mycotoxines telles que le désoxynivalénol (DON). La réduction du contenu en DON a été un objectif à long terme des sélectionneurs d’orge. Toutefois, la génétique complexe de la résistance et les essais laborieux requis ont rendu difficile le développement de cultivars résistants. Une puce Illumina 50 K SNP a été utilisée pour génotyper une collection variée (n = 400) de génotypes d’orge à deux rangs, issus principalement des programmes nord-américains de sélection. Ce panel génomique a été phénotypé dans trois environnements manitobains, au Canada, durant deux saisons de croissance. Les génotypes ont été évalués en fonction de la date d’épiaison, de la hauteur, du taux de BEF et du contenu en DON. Une étude d’association pangénomique (EAP) a été menée avec un modèle mixte linéaire (MML: Q + K) qui prenait en compte la structure de la population (Q) et la parenté (K) comme covariables. Cette étude a caractérisé la structure de la population du germoplasme de l’orge à deux rangs, essentiel pour les programmes de sélection nord-américains. Des associations importantes de marqueurs et de caractères ont été détectées sur tous les chromosomes pour la BEF, et sur tous les chromosomes sauf 1 H et 6 H pour le contenu en DON. Les effets des marqueurs individuels étaient minimes, expliquant seulement jusqu’à hauteur de 5 % la variation phénotypique. Des gènes des régions génomiques qui étaient associés aux caractères de la BEF ont affiché de nombreuses fonctions liées à la résistance à la maladie. Bien que de nombreuses associations mineures de marqueurs et de caractères aient été répertoriées, les évaluations phénotypiques demeurent toujours les meilleurs indicateurs de ces caractères, et ce, malgré leur nature chronovore ainsi que leur dépendance aux conditions environnementales.
Introduction
Fusarium head blight (FHB) is a devastating disease of barley (Hordeum vulgare L.) and other cereals, caused primarily by Fusarium graminearum Schwabe (teleomorph: Gibberella zeae (Schwein.) Petch), which can significantly reduce yield and quality of grain. Fungal infections are characterized by stained and/or shriveled kernels which are sometimes covered with pink mycelium. Of particular importance are B-type trichothecene mycotoxins such as deoxynivalenol (DON) which are commonly associated with this disease (Laitila Citation2015). Contaminated barley grains are not acceptable for use as livestock feed or malt production. Deoxynivalenol is thermostable and it and its conjugated form (deoxynivalenol-3-glucoside, D3G) can be transmitted to beer made from infected barley (Lancova et al. Citation2008). Due to food safety issues, strict maximum limits have been set for DON by the malting industry for commercial use (< 0.5 mg kg−1) (He et al. Citation2015). Since the mid-1990s, FHB has become the most damaging threat to barley production in western Canada (Clear et al. Citation1996; Tekauz et al. Citation2000).
The development of genetically resistant cultivars remains the most sustainable approach to FHB management. However, resistance sources are limited in barley (Bai and Shaner Citation2004) and provide only partial resistance. Fusarium head blight resistance is complex and under polygenic control. Numerous bi-parental quantitative trait loci (QTL) mapping studies have been conducted with various FHBresistance sources (de la Peña et al. Citation1999; Zhu et al. Citation1999; Ma et al. Citation2000; Dahleen et al. Citation2003; Mesfin et al. Citation2003; Hori et al. Citation2005, Citation2006; Horsley et al. Citation2006; Yu et al. Citation2010). The FHB-related QTL identified were commonly associated with plant height and heading date, and were often environmentally specific. Near-isogenic lines (NILs) and transcriptomics have been used to study functions of these FHB-related QTL in six-row barley located on chromosome 2 H Bins 8 & 10; 3 H Bin 6; 6 H Bin 7 (Jia et al. Citation2011; Huang et al. Citation2016). Linkmeyer et al. (Citation2013) applied marker-assisted selection (MAS) to incorporate a resistant allele for Qrgz-2 H-8, but concluded that the introgressions did not attain resistance as high as observed for the Swiss-landrace ‘Chevron’, which is one of the best sources of partial resistance. Therefore, MAS has had limited application as a breeding method for developing FHB resistance in barley.
Modern technologies based on single nucleotide polymorphism (SNP) markers have emerged to facilitate the application of whole-genome scans in barley (Waugh et al. Citation2009). The Illumina 9 K iSelect SNP chip (7842 markers) consists of 2832 original Illumina GoldenGate BOPA SNPs (Close et al. Citation2009) plus over an additional 5 K of Next-Generation sequence-based SNPs (Comadran et al. Citation2012), whichwere applied in QTL-mapping of a recombinant inbred line (RIL) population to identify genomic regions involved in FHB resistance. Huang et al. (Citation2018) mapped FHB and DON QTL in a RIL population involving ‘Rasmusson’, a six-row barley cultivar with ‘Chevron’ (Moderately resistant – MR) in ancestry. Several QTL were identified on multiple chromosomes for FHB (2 H, 5 H, 6 H, and 7 H) and DON content (2 H, 3 H, and 7 H). Ogrodowicz et al. (Citation2020) also used the 9 K SNP chip for QTL mapping in a two-row RIL population and identified regions associated with FHB index on several chromosomes (2 H, 3 H, 5 H, and 7 H), but found no association for DON content. However, several of the QTL associated with resistance in these studies were also negatively associated with important agronomic traits.
Genome-wide association study (GWAS) is a powerful tool that uses whole-genome markers, and offers an alternative approach to QTL mapping which is restricted to bi-parental populations. Genome-wide association study has the benefits of higher resolution by relying on more-extensive, historical recombination events (Bush and Moore Citation2012). Its power,however, is dependent on sample size and the number of molecular markers used. Using the Illumina GoldenGate or the iSelect 9 K SNP chip, GWAS has identified numerous QTL for FHB and DON within six-row contemporary breeding germplasm from American barley-breeding programs (Massman et al. Citation2011; Sallam et al. Citation2015). Mamo and Steffenson (Citation2015) applied GWAS within a mixed panel of 2-row/6-row landraces from Ethiopia and Eritrea, where they identified associations in the 2-row sub-group for FHB (1 H, 4 H, and 7 H) and DON content (2 H, 4 H, and 5 H). Bedawy et al. (Citation2018) used a combination of 9 K SNP markers and diversity array (DArT) markers to identify QTL associated with a F. graminearum leaf assay and spike inoculations in a greenhouse (1 H and 5 H).The majority of past research contributions in genetics have been focused on six-row resistance development, while two-row barley is by far the dominant type produced in Canada.
Over the past two decades, FHB resistance has been enhanced through an accumulation of minor alleles in lines tested in large screening nurseries (Legge et al. Citation2004). Progress has led to the release of moderately resistant cultivars with lowered DON content, developed through exotic introgressions, e.g., ‘AAC Connect’ and ‘AAC Goldman’ (Legge et al. Citation2017, Citation2018), or identification of transgressive-segregants,e.g., ‘CDC Mindon’ (Rossnagel et al. Citation2008) and ‘Lowe’ (Juskiw et al. Citation2019).In this study, a large genomic panel of contemporary two-row barley (n = 400) along with the more recent, larger barley 50 K SNP microarray chip (containing 44 040 molecular marker assays) (Bayer et al. Citation2017) was used to assess the population structure of the North American assembled germplasm collection and perform GWAS to identify genomic regions associated with quantitative resistance to FHB and low DON accumulation under western Canadian field conditions. This study provides valuable information that could support the barley breeders in their quest to develop resistance to this destructive disease.
Materials and methods
The plant materials used in this study consisted of 400 two-row, hulled barley genotypes with spring-habit, primarily adapted to production within North America. Germplasm was selected based on the previous reaction to FHB and DON content, as tested primarily in a FHB nursery at Brandon, MB. Genotypes originating from elite by elite-breeding crosses and/or exotic introgressions were incorporated. Pedigrees were taken into consideration to increase diversity and exclude half-sibs.
The majority of the panel (> 75%) consisted of cultivars and advanced breeding lines from the three western Canadian barley breeding centres: Brandon Research and Development Centre, Agriculture and Agri-Food Canada, Brandon, MB (AAFC-BRDC); Crop Development Centre, University of Saskatchewan, Saskatoon, SK (CDC); Field Crop Development Centre, Olds College, Lacombe, AB (FCDC) (). In addition to the material from these breeding institutions, genotypes were also selected from breeding programs belonging to other organizations such as Busch Agricultural Resources Inc. (BARI); WestBred/Highland Specialty Grains (WB/ HSG); North Dakota State University (NDSU), Ottawa Research and Development Centre, Agriculture and Agri-Food Canada (AAFC-ORDC), Lethbridge Research and Development Centre, Agriculture and Agri-Food Canada (AAFC-LeRDC), Molson Coors Brewing Co (COORS) and Agricore United (AU). Additionally, a small portion (< 5%) of the panel included international cultivars or landrace accessions. Furthermore, the panel consisted of genotypes that could be classified as malting (n = 171) and general-purpose (n = 229, feed/forage) barley. For the majority of the barley genotypes, all of the seed used in the study was received directly from the breeders except for the landraces which were obtainedfrom a gene bank (Agriculture and Agri-Food Canada, Plant Gene Resources of Canada).
Fig. 1. Pie chart of genetic panel composition by the breeding institutions (Agriculture and Agri-Food Canada, Brandon Research and Development Centre [AAFC-BRDC]; Crop Development Centre [CDC]; Field Crop Development Centre [FCDC]; D = Busch Agricultural Resources, Inc. [Bari]; WestBred LLC/ Highland Specialty Grains [WB/HSG]; North Dakota State University [NDSU]; Agriculture and Agri-Food Canada, Lethbridge Research and Development Centre [AAFC-LeRDC]; Agriculture and Agri-Food Canada, Ottawa Research and Development Centre [AAFC-ORDC]; Molson Coors Beverage Company [COORS]; Agricore United [AU]; Accessions are landrace or exotic cultivars).
![Fig. 1. Pie chart of genetic panel composition by the breeding institutions (Agriculture and Agri-Food Canada, Brandon Research and Development Centre [AAFC-BRDC]; Crop Development Centre [CDC]; Field Crop Development Centre [FCDC]; D = Busch Agricultural Resources, Inc. [Bari]; WestBred LLC/ Highland Specialty Grains [WB/HSG]; North Dakota State University [NDSU]; Agriculture and Agri-Food Canada, Lethbridge Research and Development Centre [AAFC-LeRDC]; Agriculture and Agri-Food Canada, Ottawa Research and Development Centre [AAFC-ORDC]; Molson Coors Beverage Company [COORS]; Agricore United [AU]; Accessions are landrace or exotic cultivars).](/cms/asset/beb1f319-e0bb-43c5-a426-ae2e28b2fa4c/tcjp_a_2086925_f0001_oc.jpg)
Phenotype
Field experiments. In 2014 and 2015, the experiments were conducted in field FHB nurseries at three locations in Manitoba, Canada: Brandon (49°51ʹ56.1”N 99°58ʹ57.9”W), Carman (49°30ʹ05.1”N 98°01ʹ43.5”W) and Carberry (49°52ʹ24.8”N 99°24ʹ30.8”W). Standard agronomic practices were applied within locations, with the following seeding dates: Brandon (May 28, 2014; May 20, 2015), Carberry (May 19, 2014; May 20, 2015), Carman (May 29, 2014; June 1, 2015). All 400 two-row barley genotypes of the panel were grown together in a randomized complete block design (RCBD), at a seeding rate of 30–40 seeds per meter. All sites were irrigated with various methods: Brandon (PVC risers with NaanDanJain 502-H sprinkler head); Carberry (center-pivot overhead irrigation); Carman (mist irrigation). While inoculation methods differed by site, all nurseries used mixtures of two isolates each of 3ADON and 15ADON chemotypes of F. graminearum. Before inoculation, isolates were mixed in equal proportions by volume. Grain spawn (maize kernels colonized by F. graminearum) was spread on the soil surface (5 g m−2) at Brandon and Carberry, whereas Carman plots were sprayed at 75% spike emergence with a macroconidial suspension (5 x 10⁴ spores ml−1) and then at three day-intervals thereafter. Following inoculation at Carman, mist was applied at ten-minute intervals for ten hours each time to ensure successful infection.
Plots were rated for FHB3.5 weeks following heading, during the soft dough growth stage (Zadoks – Z85, Zadoks et al. Citation1974) using a 0–5 visual scale (A. Tekauz personal communication, 0 = no infection; 1 = incidence low, up to 5% of spikes infected; severity low, 1 or 2 kernels per spike affected [up to 7% of spike]; 2 = incidence low to moderate, 5 to 15% of spikes infected; severity low to moderate, 1 to 4 kernels per spike affected [up to 15% of spike]; 3 = incidence moderate, 15 to 30% of spikes infected; severity moderate, 2 to 8 kernels per spike affected [up to 25% of spike]; 4 = incidence moderate to high, 30 to 50% of spikes infected; severity moderate to high, 4 to 12 kernels per spike affected [up to 40% of spike] and 5 = incidence high, 50% or more spikes infected; severity high, 5 to 15+ kernels per spike affected [up to 50%+ of spike diseased]). Heading (50% spike emergence) (HD50) was recorded only at Brandon and Carberry and used in the calculation of days to heading by subtracting the seeding date. Height (HT) was measured as the distance from the soil surface to the top of the spike excluding awns and was recorded as an average of three measurements at all three locations.
Grains were harvested at maturity with a stationary, research combine set at low wind speed to retain thin kernels. Grains were cleaned using an SLN3 sample cleaner (Pfeuffer GmbH, Kitzingen, Germany). A 20 g subsample that was free of debris and/or chaff was then ground using a Perten 3610 lab mill with a fine particle disc set (Perten Elmer Inc. Waltham, MA). Deoxynivalenol content was analyzed on a 2-gram sub-sample by enzyme-linked immunosorbent assay (ELISA) technique using Veratox ® 5/5 (Neogen Corporation, Lansing, MI) as per the manufacturers protocol (limit of detection = 0.1 mg kg−1). Sample extracts were analyzed in pairs, where analysis was repeated for deviations above 10%.
The least square (LS) means of all traits were calculated for genotypes using SAS JMP Genomics 9.1 software (SAS Institute Inc., 1989–2019) in a model overall years with variables as fixed effects. LS means were used for descriptive statistics and inputs for modelling genome-wide association study (GWAS). Pearson correlation coefficients were calculated in R statistic environment (R Core Team Citation2021) using the ‘cor’ function and heat map graphics were produced with the ‘ggcorrplot’ package.
DNA extraction
Two barley seeds were surface-sterilized in 6% vol/vol sodium hypochlorite and rinsed in distilled water. Seeds were germinated on moist cotton balls and grown under natural light until the two-leaf stage. Leaves were randomly cut from a single plant and flash frozen in liquid-N then freeze-dried in a lyophilizer (Labconco Corporation, Kansas City, MO). Total genomic DNA was extracted from 100 mg of lyophilized tissue per genotype using Qiagen, DNeasy 96 Plant Kit (Qiagen, Canada). The quality and concentration of DNA were evaluated by agarose gels and a NanodropTM 1000 spectrophotometer (Thermo Fisher Scientific Inc., Wilmington, DE). Samples were normalized to 50 ng µL−1 (20 µL) of DNA using micro-pure DNase-free water.
High throughput genotyping
DNA samples were assayed on an Illumina iScan (Illumina, San Diego, CA) using a custom iSelect – 50 K SNP microarray chip consisting of 44 040 molecular markers (Bayer et al. Citation2017) at AAFC, Morden Research and Development Centre, Morden, MB. A custom cluster file (Trait Genetics, GmbH, Germany) was used to call SNP alleles using Illumina Genome Studio v2.0.5 software. Allelic data in Plink format were imported into TASSEL v5.2.58 then filtered for minor allele frequency (MAF) > 5% and for missing data <10% (total of 25 068 SNPs). Missing values were numerically imputed by the mean value method using five nearest neighbours. Data were imported into SAS JMP Genomics 9.1 (SAS Institute Inc., 1989–2019) and converted into numerical values (0 = major allele; 1 = heterozygous; 2 = minor allele).
Linkage disequilibrium and population structure analysis
Resolution of trait mapping is affected by linkage disequilibrium (LD). LD decay was analyzed separately for each chromosome. Squared allele frequency correlations (r2) were calculated pairwise for all filtered molecular markers using SAS JMP Genomics version 9.1 (SAS Institute Inc Citation2019). Intra-chromosomal graphs were produced by plotting r2 values of marker pairs against physical genomic map position (base pair) over each chromosome with a smoothing line function (α = 0.005).
STRUCTURE v2.3.4 software (Pritchard et al. Citation2000) was used to perform a Bayesian clustering analysis of population structure. A sub-set of > 2000 polymorphic SNP markers of equidistant spacing overall seven chromosomes was used with a burn-in of 100 000 iterations and 100 000 Markov Chain Monte Carlo (MCMC) iterations. Population sub-populations from K1 (no structure) to K5 were tested using an admixture model. Results were analyzed using Structure Harvester v0.6.94 (Earl and vonHoldt Citation2012) where mostlikely sub-populations were identified via the Evanno method (Evanno et al. Citation2005). A ΔK index was calculated and plotted against the K value to observe and identify the peak value and determine the mostlikely number of sub-populations. A Q matrix (sub-population coefficients) was extracted from the population structure analysis based on two sub-populations. Visual analysis of the Q matrix output by STRUCTURE was conducted using Structure Plot v2.0 (Ramasamy et al. Citation2014). Alternatively, population structure was evaluated by TASSEL v5.2.58 through principal component analysis (PCA) along with the production of a neighbour-jointing tree visualized by Archaeopteryx v0.9909 to evaluate patterns of relatedness. A matrix of pairwise kinship values (K matrix) was also calculated within SAS JMP Genomics version 9.1 (SAS Institute Inc Citation2019) via anidentity-by-descent method. The K-matrix was used in subsequent GWAS analysis as a random factor.
Association mapping was conducted using all 400 genotypes for traits via various methods (with Q-matrix based on PCA or STRUCTURE results; general linear model (GLM + Q) and mixed linear model (MLM + Q + K) were evaluated by quantile-quantile (Q-Q) plots for best fit (Supplementary Figure S1). For simplicity, results herein are attributed to the Q (STRUCTURE) + K mixed model. Association analysis was conducted on overall means and within a location. SNP markers -Log10 [P-value] ≥ 3 were considered statistically significant, a commonly accepted limit for the GWAS study (Chan et al. Citation2010). Manhattan plots were generated in SAS JMP Genomics 9.1 (SAS Institute Inc Citation2019) to visually identify peaks of trait associations by physical chromosome position.
Candidate gene prediction
Genes were determined by the physical position of the SNP allele on the Morex V3(MorexV3_pseudomolecules_assembly, accession GCA_904849725) which is the most recent released version of the barley reference genome (Mascher et al. Citation2021).Associated genes of interest were identified through evaluation of nearest proximity to genomic position (± 50 Kbp) and often adjacent to the SNP marker using the Barleymap web tool (URL floresta.eead.csic.es/barleymapaccessed Apr. 12, 2022)and the GrainGenes genomic web browser (URL wheat.pw.usda.gov/GG3/genome_browser accessed on Apr. 12, 2022. High-confidence gene annotations were determined through BARLEX genome explorer (URL apex.ipk-gatersleben.de/apex/f? p = 284:10 accessed Apr.12, 2022). Gene functions were further evaluated by associated gene ontology (GO) terms (Ashburner et al. Citation2000, http://geneontology.org/); Pfam domains (Mistry et al. Citation2020, URL pfam.xfam.org/ accessed Apr. 12, 2022); InterPro terms (Blum et al. Citation2021, URL www.ebi.ac.uk/interpro/ accessed Apr. 12, 2022).
Results
Population structure analysis
STRUCTURE software was applied to evaluate sub-structures within the panel of 400 genotypes. The optimal number of sub-populations (K) determined by STRUCTURE analysis, identified K = 2 sub-populations (Supplementary Figure S2). Individuals from Cluster 1 (> 90% sub-population membership) included 104 lines primarily contributed by the AAFC-BRDC-breeding program, or other programs where an AAFC-BRDC parent was involved in a cross. Representative individuals of Cluster 1 included cultivars and elite breeding materials such as: ‘AAC Connect’, ‘AAC Goldman’, ‘AAC Synergy’, ‘AC Oxbow’, ‘CDC Fraser’, ‘Cerveza’, ‘CDC Kindersley’, ‘Ellice’, ‘Major’ ‘Newdale’. Cluster 2, comprised all remaining entries, included cultivars and lines from various programs and accessions (). Genotypes in extreme opposition to Cluster 1, included feed cultivars such as ‘Brahma’, ‘McLeod’, ‘Ursa’, and ‘Xena’. This structure was also reflected in the phylogenetic tree constructed by the neighbor-joining method ().
Fig. 2. STRUCTURE Sub-population membership for 400 two-row barley grouped by breeding institution. A = Agriculture and Agri-Food Canada, Brandon Research and Development Centre (AAFC-BRDC); B = Crop Development Centre (CDC); C = Field Crop Development Centre (FCDC); D = Busch Agricultural Resources, Inc. (Bari); E = WestBred LLC/ Highland Specialty Grains (WB/HSG); F = North Dakota State University (NDSU); G = Agriculture and Agri-Food Canada, Lethbridge Research and Development Centre (AAFC-LeRDC); H = Agriculture and Agri-Food Canada, Ottawa Research and Development Centre (AAFC-ORDC); I = Molson Coors Beverage Company (COORS); J = Agricore United (AU); K = Accession. Yellow = Cluster 1 and Orange = Cluster 2. The Y axis represents the proportion of cluster (K = 2) membership.
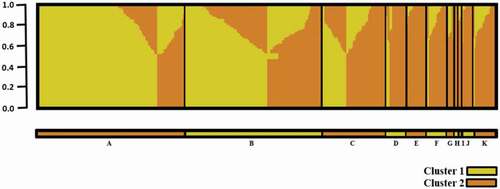
Fig. 3. Phylogenetic tree constructed by neighbor-joining (NJ) method based on single-nucleotide polymorphism (SNP) genetic markers (25 K) displaying selected cultivars and germplasm from the various institutions (Agriculture and Agri-Food Canada, Brandon Research and Development Centre [red]; Crop Development Centre [blue]; Field Crop Development Centre [green]; D = Busch Agricultural Resources, Inc. [purple]; WestBred LLC/ Highland Specialty Grains [Orange]; North Dakota State University [brown].
![Fig. 3. Phylogenetic tree constructed by neighbor-joining (NJ) method based on single-nucleotide polymorphism (SNP) genetic markers (25 K) displaying selected cultivars and germplasm from the various institutions (Agriculture and Agri-Food Canada, Brandon Research and Development Centre [red]; Crop Development Centre [blue]; Field Crop Development Centre [green]; D = Busch Agricultural Resources, Inc. [purple]; WestBred LLC/ Highland Specialty Grains [Orange]; North Dakota State University [brown].](/cms/asset/565beb1b-8a51-4e2c-a255-92d9b059127d/tcjp_a_2086925_f0003_oc.jpg)
Principal component analysis (PCA) was also conducted to analyze the panel structure. Analysis of principal components demonstrated clustering within barley type (malt or feed) and separation on the primary principal component axis. Results of the PCA are presented by type () and by breeding program origin (). Patterns of genetic relatedness from various analyses were confirmed by pedigree information (breeders’ personal communication).
Fig. 4. Plots of the first two principal components of genotype information (single-nucleotide polymorphism genetic markers) of the genomic panel with colouration highlighting A) malting or feed barley types; B) breeding institution origin (Agriculture and Agri-Food Canada, Brandon Research and Development Centre [AAFC-BRDC]; Crop Development Centre [CDC]; Field Crop Development Centre [FCDC]; D = Busch Agricultural Resources, Inc. [Bari]; WestBred LLC/ Highland Specialty Grains [WB/HSG]; North Dakota State University [NDSU]; Agriculture and Agri-Food Canada, Lethbridge Research and Development Centre [AAFC-LeRDC]; Agriculture and Agri-Food Canada, Ottawa Research and Development Centre [AAFC-ORDC]; Molson Coors Beverage Company [COORS]; Agricore United [AU]; Accessions are landrace or exotic cultivars).
![Fig. 4. Plots of the first two principal components of genotype information (single-nucleotide polymorphism genetic markers) of the genomic panel with colouration highlighting A) malting or feed barley types; B) breeding institution origin (Agriculture and Agri-Food Canada, Brandon Research and Development Centre [AAFC-BRDC]; Crop Development Centre [CDC]; Field Crop Development Centre [FCDC]; D = Busch Agricultural Resources, Inc. [Bari]; WestBred LLC/ Highland Specialty Grains [WB/HSG]; North Dakota State University [NDSU]; Agriculture and Agri-Food Canada, Lethbridge Research and Development Centre [AAFC-LeRDC]; Agriculture and Agri-Food Canada, Ottawa Research and Development Centre [AAFC-ORDC]; Molson Coors Beverage Company [COORS]; Agricore United [AU]; Accessions are landrace or exotic cultivars).](/cms/asset/4e727215-0dac-42b3-bddc-12a2252fb0f3/tcjp_a_2086925_f0004_oc.jpg)
Linkage disequilibrium and polymorphic SNP coverage
The genomic panel was primarily composed of adapted breeding materials, where it is expected to show some level of LD decay as a result of selective breeding. The degree of population structuring is also related to the level of LD decay. The plot of squared allele frequency correlations (r2) vs. genomic position (Mbp) demonstrated a decay of LD values with the genetic distance in the genomic panel (Supplementary Figure S3). The mean distance at which r2 fell below 0.2 was approximately 5 Mbp. Of the 44 K SNP markers evaluated, 57% (> 25 K) were found to be polymorphic and useful for GWAS. The SNP markers displayed adequate genomic coverage, however, some gaps were observed over certain chromosomes (1 H, 2 H, and 4 H), particularly in centromere regions (Supplementary Figure S4).
Phenotype
Overall means for all traits measured are presented by year for each location in . Fusarium head blight occurred in all locations in all years. Deoxynivalenol was detected in all of the harvested grains and displayed a continuous distribution (Supplementary Figure S5). Disease symptoms were similar for Brandon and Carman, yet considerably lower at Carberry. Deoxynivalenol content varied by location and year. While the lowest FHB infection level was observed at Carberry and particularly in 2014, this location produced the highest DON content for that year (). Carman displayed the highest consistency in overall DON content.
Table 1. Means and standard errors of height (HT, cm), fusarium head blight (FHB, 0–5) and days to fifty percent heading (HD50, days) and deoxynivalenol (DON, mg kg−1) content over years and locations.
Relationships between traits over locations were analyzed by comparison of Pearson correlation coefficients (Supplementary Figure S6). The most robust within-trait relationship between locations was found for days to heading and plant height. Correlation of FHB and DON accumulation between locations was moderately high and moderate, respectively. With regards to between trait correlation, FHB was moderately associated with DON at Brandon (r2 = 0.25, P-value < 0.0001) and Carman (r2 = 0.19, P-value < 0.0001), but at Carberry the relationship was non-existent (r2 = 0.00, P-value > 0.05). Height displayed a negative relationship with FHB (r2 = −0.36, P-value < 0.0001), but showed no association with DON (r2 = −0.04, P-value < 0.0001).
FHB reaction and DON content
Overall, there was a wide range of mean FHB reactions among genotypes, where some genotypes displayed minimal infection and others had near-maximum scores (FHB, 0.3–4.8). Likewise, the mean DON content among genotypes ranged from 4.9 to 36.9 mg kg−1. Genotypes previously identified as resistant at a single location (Brandon), were confirmed in this study by testing conducted in additional environments and using alternative evaluation methods (conidial spray). A list of genotypes with consistently low FHB and/or DON content across locations is presented in . The group of landrace exotics generally held both the lowest FHB and DON content. In this group, germplasm such as CIho 4196 (Horsley et al. Citation2006) and Harbin (Hori et al. Citation2006) have been used extensively as resistance sources for breeding. However, several breeding lines with adaptive characteristicsfor production in North America demonstrated resistance to DON accumulation near those exotic accessions including genotypes such as: NDSU cultivars ‘Bowman’ and ‘Conlon’ and several Canadian breeding lines incorporating resistance from: ‘Svansota’, ‘MNBrite’, ‘Shyri’ and ‘Gobernadora’. In some cases high FHB did not result in high DON content as exemplified by HDE84194-622-1, which produced high FHB but low DON content values at all locations.
Table 2. Selection of germplasm with low Fusarium head blight (FHB) score or deoxynivalenol (DON) content. Numbers represent grand average over site years, with standard errors in brackets.
Association mapping
Genome-wide association study (GWAS) identified a total of 128 SNP markers () associated with HD50, where approximately half (52%) of these markers were located on chromosome 2 H (Supplementary Figure S7), with several peak regions (55.0, 360.0, 501.5, 538.7, 549.6, and 635.3 Mbp). Chromosome 3 H held the second-highest number of significant markers with peaks at 28.5, 32.1, and 594.8 Mbp. A total of 14 marker associations were observed on chromosome 7 H with a peak at 55.2 Mbp. Significant marker associations were observed on all other chromosomes including peaks on chromosomes 4 H: 559.2 Mbp and 5 H: 579.8 Mbp.
Fig. 5. Manhattan plots ofall site years of 400 genotypes for days to fifty-percent heading (HD50), height (HT), FHB (Fusarium head blight score) and deoxynivalenol content (DON) over the chromosomal position. The horizontal red dashed line represents a genome-wide significance threshold (-Log10 P-value ≥ 3.0). SNP markers are displayed cumulatively by chromosome (Chr) which are represented by colour.
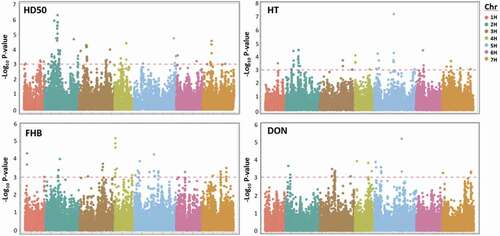
A total of 60 SNP markers were identified associated with HT, which were identified on all chromosomes (). As seen for HD50, the largest number of markers (40%) were located on chromosome 2 H (Supplementary Figure S7), with association peaks (25.4, 40.5, 382.1, 425.6 Mbp). Chromosome 5 H held the second-highest number of significant markers with peaks 11.0, 499.3, and 584.1 Mbp).
Fusarium head blight (FHB) was associated with a total of 75 SNP markers (), located across all chromosomes (). Chromosome 5 H held the highest number of markers (23%), where peaks were observed at 25.2 Mbp (SCRI_RS_7368) and 499.3 Mbp (JHI-Hv50k-2016-321 425), where the latter coincided with a height-associated region. A region near the end of 4 HS was associated with FHB, with a peak at 2.8 Mbp (JHI-Hv50k-2016-227 104). Likewise, three peak regions were identified on 7 H including 28.2 Mbp (SCRI_RS_219709), 484.1 Mbp (JHI-Hv50k-2016-488 582), and 584.3 Mbp (JHI-Hv50k-2016-498 181). A region for FHB on 2 H at peak 538.7 Mbp (JHI-Hv50k-2016-101 173), coincided with a region associated with days to heading. Other regions associated with FHB were identified on chromosomes 1 H: 11.8 Mbp (JHI-Hv50k-2016-10 994), 3 H: 547.9 Mbp (JHI-Hv50k-2016-201 074), and 6 H: 50.9 Mbp (JHI-Hv50k-2016-386 764).
Table 3. Significant molecular markers (-Log10 [P value] ≥3) associated with Fusarium head blight (FHB) averaged over all site years (n = 6).
Deoxynivalenol content (DON) was associated with a total of 42 SNP markers (; ), which mostly occurred on chromosome 5 H (40%). Associations were observed over multiple regions of chromosome 5 H with peaks occurring at 4.8 Mbp (SCRI_RS_114102), 34.0 Mbp (JHI-Hv50k-2016-288 841), 48.3 Mbp (JHI-Hv50k-2016-290 535), 60.8 Mbp (JHI-Hv50k-2016-291 313), and 530.9 Mbp (JHI-Hv50k-2016-337 389). Likewise, peaks were observed on chromosome 4 H at 7.7 Mbp (JHI-Hv50k-2016-228 552) and 571.1 Mbp (JHI-Hv50k-2016-261 905). Peaks were also observed on chromosome 3 H at 403.2 Mbp (JHI-Hv50k-2016-180 623) and 461.9 Mbp (JHI-Hv50k-2016-186 010). Multiple regions were also identified on chromosomes 2 H (11.4 and 18.1–19.1 Mbp) and 7 H (3.0 and 615.7 Mbp), while no significant markers were identified in association with DON on chromosomes 1 H nor 6 H.
Table 4. Significant molecular markers (-Log10 [P value] ≥3) associated with deoxynivalenol (DON) content averaged over all site years (n = 6).
Candidate genes
I) Days to heading (HD50) and height (HT). Marker-traitassociations were often coincidental for HD50 and HT. Plant height (HT) was associated on chromosome 2 H (25.3 Mbp) and borderline (-Log10 P-value = 2.9) for HD50. Photoperiod response regulator gene (HORVU.MOREX.r3.2 HG0107710, Ppd-H1),which determines the sensitivity to long days is located at this position (Turner et al. Citation2005). Similar association patterns over locations corroborate the influence of chromosome 2 H onthese traits.
Plant height (HT) was associated with chromosome 1 H at 479.1 Mbp in proximity to HORVU.MOREX.r3.1 HG0077240(477.8 Mbp), Protein FLOWERING LOCUS T, HvFT3, Ppd-H2. Days to heading (HD50) showed a marker-trait-association inchromosome 2 H at 538.7 and 635.3 Mbp which are respectively associated with HORVU.MOREX.r3.2 HG0177270 (Hv FTL5, Flowering locus T) and HORVU.MOREX.r3.2 HG0204770 (HvAP2, ethylene-responsive transcription factor). Both HD50 and HT showed a marker-trait-association on 2 H: 403–407 Mbp region, which are respectively associated with HORVU.MOREX.r3.2 HG0153260 (early-responsive to dehydration stress protein, HvERD4) and HORVU.MOREX.r3.2 HG0153990 (light-dependant short hypocotyls protein). Days to heading (HD50) was associated with positions on chromosome 3 H: 28.5and 32.3 Mbp. Cytochrome P450 superfamily protein (HORVU.MOREX.r3.3 HG0232150) is located at 28.5 Mbp, whereas Six-rowed spike4 [Vrs4, syn. Intermedium-E], HORVU.MOREX.r3.3 HG0233930 (LOB domain-containing protein) is located at 33.7 Mbp. Vrs4 is a major morphometric gene that controls the two-row spike morphology through Vrs1 (HORVU.MOREX.r3.2 HG0184740, 570.8 Mbp) and its suppression of lateral spikelet fertility (Koppolu et al. Citation2013).
Plant height (HT) also showed association with several nearby regions on chromosome 5 H, including 499.3 Mbp nearby HORVU.MOREX.r3.5 HG0498800 (Protein STAY-GREEN, chloroplastic) andHORVU.MOREX.r3.5 HG0498830 (Pseudo response regulator, PRR95). Both traits also demonstrated association on chromosome 5 H at 585.8 Mbp in the proximity (583.9 Mbp) to gibberellin 20 oxidase (HORVU.MOREX.r3.5 HG0536610, HvGA20ox1).
II) Fusarium head blight. Genome-wide association study (GWAS) of FHB identified nucleotide-binding site leucine-rich repeat (NBS-LRR) class disease resistance proteins association in two regions of chromosome 1 H: 11.6 (HORVU.MOREX.r3.1 HG0005640) and 510.4 Mbp (HORVU.MOREX.r3.1 HG0093120). Multiple locations on chromosome 2 H were associated with multiple protein kinase proteins: HORVU.MOREX.r3.2 HG0153670 (357.4 Mbp); HORVU.MOREX.r3.2 HG0156970 (382.1 Mbp),and HORVU.MOREX.r3.2 HG0177510 (538.2 Mbp). Another association was observed on chromosome 2 H at 425.6 Mbp in proximity to HORVU.MOREX.r3.2 HG0161420 (MLO-like protein). On chromosome 3 H, FHB at 359.6 Mbp adjacent to HORVU.MOREX.r3.3 HG0234370 (NBS-LRR resistance protein) and at542.4 Mbp was associated with HORVU.MOREX.r3.3 HG0300850 (Cytochrome P450).
On chromosome 4 H, FHB was associated at 2.1 Mbp close to HORVU.MOREX.r3.4 HG0331940 (Copper ion-binding protein); HORVU.MOREX.r3.4 HG0331250 (cellulose synthase-like protein), andHORVU.MOREX.r3.4 HG0331260 (ABC transporter ATP-binding protein ARB1). Association was also seen with the adjacent region 2.8 Mbp in the position of genes HORVU.MOREX.r3.4 HG0332220 (GDSL esterase/lipase)and HORVU.MOREX.r3.4 HG0332240 (Fatty acyl-CoA reductase 3).
On chromosome 5 H, FHB-association at 25.2 Mbp wasin proximity to Chaperone heat shock protein DnaJ (HORVU.MOREX.r3.5 HG042960). Also associated with FHB were regions: 474.1 Mbp, HORVU.MOREX.r3.5 HG0489730 (UDP-Glycosyltransferase superfamily protein), and HORVU.MOREX.r3.5 HG0489810 (caffeoyl-CoA 3-O-methyltransferase); 499.3 Mbp, HORVU.MOREX.r3.5 HG0498800 (Protein STAY-GREEN, chloroplastic),and 507.4 Mbp HORVU.MOREX.r3.5 HG0501610 (Glutathione S-transferase). Other detected associations with genes were chromosome 6 H at50.9 Mbp, HORVU.MOREX.r3.6 HG0556730 (LRR protein kinase), and chromosome 7 H at484.0 Mbp HORVU.MOREX.r3.7 HG0712930 (NBS_LRR resistance protein), and 584.3 Mbp, HORVU.MOREX.r3.7 HG0732460 (Protease inhibitor/seed storage/lipid transfer family protein).
III) Deoxynivalenol (DON) content. Multiple DON associations were observed on chromosome 2 H at11.4 Mbp, HORVU.MOREX.r3.2 HG0100300 (Peroxidase);18.1 Mpb HORVU.MOREX.r3.2 HG0104570 (LRR protein kinase); and 19.1 MbpHORVU.MOREX.r3.2HG0104860 (Expansin). On chromosome 3 H associations occurred at 403.2HORVU.MOREX.r3.3 HG0276410 (Trichome birefringence-like protein);457.7 Mbp HORVU.MOREX.r3.3 HG0284050(IQ-domain 6, a calmodulin-binding protein);461.9 Mbp HORVU.MOREX.r3.3 HG0284810 (WRKY DNA-binding protein 50), and 595.2 Mbp HORVU.MOREX.r3.3 HG0319600 (Serine/Threonine-kinase).
DON was associated with several genomic regions of chromosome 5 H, 4.2–5.5 Mbp which were coincident for association with FHB including genes: HORVU.MOREX.r3.5 HG0420980 (Early-responsive to dehydration stress protein, ERD4), HORVU.MOREX.r3.5 HG0421020 (Pathogenesis-related protein 1, PR1), HORVU.MOREX.r3.5 HG0421310(Leucine-rich receptor-like protein kinase family protein) and HORVU.MOREX.r3.5 HG0421350 (Neutral ceramidase).Several associations were seen between 34.0–60.8 Mbp were in the region of CBS domain-containing protein (HORVU.MOREX.r3.5 HG0431770);HORVU.MOREX.r3.5 HG0433910(WRKY DNA-binding protein 74); HORVU.MOREX.r3.5 HG0436650 (DA1, ubiquitin-activated limiter of seed size);; HORVU.MOREX.r3.5 HG0437600 (Myb family transcription factor-like protein). Mapping to 530.9 Mbp, a SNP (JHI-Hv50k-2016-337 389) explained 4.9% of the phenotypic variance (-Log10 P-value = 5.1), associated with HORVU.MOREX.r3.5 HG0512320 (Cytochrome P450 superfamily protein).
Discussion
The assembled panel of genotypes displayed a wide range of FHB infections in this study, which resulted in varying levels of DON accumulation. Deoxynivalenol (DON) production was positively associated with Fusarium infection, and as seen in other studies the relationship is only moderate (Buerstmayr et al. Citation2004; Choo et al. Citation2004; He et al. Citation2015; Tucker et al. Citation2019). Later infections which do not produce high FHB levels, may result in very high mycotoxin accumulation. FHB infection at Carberry in 2014, which had the lowest level of infection, yet some of the highest DON levels of the study. This demonstrates the complexities in the relationship between FHB and DON, both of which are highly subjective to environmental conditions at their respective, developmental stages. This also illustrates the essential need to conduct DON testing in barley, which can occur in seemingly uninfected kernels.
Patterns of relatedness were analyzed for germplasm of the genomic panel, where clustering of materials occurred mainly by barley end-use i.e. malting or livestock feed. The genetic variance was narrower within the malting class of barley. This is to be expected given the restrictions posed by malting quality standards. As a result, use of elite crosses is required to maintain Canadian malting quality. In addition to type, the genotypes also demonstrated clustering by institution. However, a substantial level of genetic transfer was apparent through the documented admixture within breeding pools of the Canadian breeding programs. The STRUCTURE analysis identified two main, genetically distinct sub-populations. Modern malting barley cultivars such as ‘AAC Connect’, ‘AAC Synergy’, and related breeding lines from the AAFC-BRDC program, clustered distinctly from the remaining entries in the genomic panel.
Fusarium head blight (FHB)-marker association was observed on chromosome 1 H at 11.5 Mbp. A QTL (Qlds.1 H) has been previously detected by Bedawy et al. (Citation2018) on chromosome 1 H 22.1 Mbp and associated with SCRI_RS_239784 through greenhouse spike inoculation and F. graminearum leaf assay. Likewise on chromosome 1H, an association was observed at 510.5 Mbp, which coincided with a previously identified QTL for FHB (BOPA1_2572-986, 506.6 Mbp) in two-row barley (Mamo and Steffenson Citation2015). An association with FHB was observed at 357.4 Mbp close to leucine-rich receptor (LRR)-like protein kinase, HORVU.MOREX.r3.2HG0153670. Aprevious association with FHB was reported between this region and a QTL, FHB2H.50–56 (bin 6–7, Massman et al. Citation2011) along withSNP marker SCRI_RS_130072 (356.9 Mbp) for DON content (Mamo and Steffenson Citation2015). Interestingly, FHB symptoms were not associated with the Ppd-H1 region in this study, as previously reported in bi-parental QTL studies (Huang et al. Citation2018; Ogrodowicz et al. Citation2020, QTL termed QFHB.IPG-2H_1).
Genome-wide association study (GWAS) showed several regions of chromosome 2H between 355.5–382.1 Mbp associated with FHB, where several markers were previously associated with DON content (SRCI_RS_230984, 356.2 Mbp; BOPA1_1062-478, 359.5 Mbp; SCRI_RS_197997, 360.7 Mbp) (Mamo and Steffenson Citation2015). In this study, this region (355.4–360.0 Mbp) was also associated with HD50 and HT. Mildew Locus O (MLO) proteins like HORVU.MOREX.r3.2HG0161420 (425.6 Mbp) are susceptibility factors. Mutant forms of these genes (mlo) confer resistance to powdery mildew fungus but enhances susceptibility to hemi-biotrophic organisms. On chromosome 4 H, FHB was associated with multiple SNPs between 0.2–7.8Mbp. A QTL DON-QTL-4 H-12_11485 associated with DON resistance was previously identified in proximity at 6.4Mbp (Mamo and Steffenson Citation2015) and associated with QTL DON4H.03 (bin 1) (Massman et al. Citation2011). Several genes with potential resistance contributions in this region including HORVU.MOREX.r3.4 HG0331250 (cellulose synthase-like) HORVU.MOREX.r3.4 HG0331260 (ABC transporter) and HORVU.MOREX.r3.4 HG0332240 (Fatty acyl-CoA reductase 3). A GDSL esterase/lipase gene, HORVU.MOREX.r3.4 HG0332220 associated with JHI-Hv50k-2016-227 104 was highly significant (-Log10 P-value = 5.2).
Resistance factors can be induced or possess a constitutive basis (Kushalappa et al. Citation2016). Lipids are important regulators of plant defence, where the well-known defence hormone, jasmonic acid (JA) is a derivative of lipid-metabolism. Genes contributing to lipid catabolism such as GDSL esterase/lipases and non-specific lipid-transfer proteins (nsLTP, HORVU.MOREX.r3.7 HG0732460), have been implicated with FHB resistance in transcriptional studies of cereals (Foroud et al. Citation2012; Gottwald et al. Citation2012; Huang et al. Citation2016; Tucker et al. Citation2021). McLaughlin et al. (Citation2021) demonstrated the importance of nsLTP genes, through the use of transgenics AtLTP4.4 from Arabidopsis in wheat, which suppressed DON production in the field, where they hypothesized it reduced DON-induced ROS. Fatty acyl-CoA reductase 3 (HORVU.MOREX.r3.4 HG0332240) which is involved in cuticular wax production, may be an important barrier for barley resistance to F. graminearum (Kumar et al. Citation2016). Caffeoyl-CoA 3-O-methyltransferase (HORVU.MOREX.r3.5 HG0489810), is involved in the production of feruloyl-CoA lignin which contributes to the fortification of the cell wall. Structural-related proteins were identified which can aid fungal penetration such as expansin (HORVU.MOREX.r3.2HG0104860) which causes cell loosening or cellulose synthase (HORVU.MOREX.r3.4 HG0331250) and UDP-glucose 6-dehydrogenase (HORVU.MOREX.r3.5 HG0489730) leading to hemicellulose and pectin.
On chromosome 5 H, FHB association was seen at 25.2 Mbp (SCRI_RS_7368, -Log10 P-value = 5.2). Fusarium head blight (FHB) association was seen over the range 474.1–474.9 Mbp. A major QTL (Qsds.5 Hc) explaining 39% of genetic variance was identified in a greenhouse study in association with SNP marker SCRI_RS_174710 located on 5 H at 523.9 Mbp (Bedawy et al. Citation2018). This association was in proximity to markerJHI-Hv50k-2016-332 519 (522.2 Mbp). Also associated was JHI-Hv50k-2016-321 425 (-Log10 P-value = 4.3) at 499.3 Mbp beside HORVU.MOREX.r3.5 HG0498800HORVU5Hr1G08121 (Protein STAY-GREEN) and 507.4 Mbp beside HORVU.MOREX.r3.5 HG0501610 (Glutathione S-transferase). FHB association was seen on chromosome 6 H at 50.2–50.9 Mbp in the same region of QTL for FHB, FHB6H.42–61,and DON content DON6H.42–67 (bins 5–7, Massman et al. Citation2011)and corresponding gene HORVU.MOREX.r3.6 HG0556730 (LRR protein kinase).
Regions of association with DON did not always coincide with those of FHB and showed associations on chromosomes 2H- 5 H and 7 H. Deoxynivalenol (DON) associations on 3 H occurred at numerous regions independently of FHB, which corresponded to genes of interest: 403.2 Mbp (52.0 cM) – HORVU.MOREX.r3.3 HG0276410 (Trichome birefringence-like protein); 457.7 Mbp (57.1 cM) HORVU.MOREX.r3.3 HG0284050 (IQ-domain 6, a calmodulin-binding protein) and 461.9 Mbp (57.4 cM) – HORVU.MOREX.r3.3HG0284810 (WRKY DNA-binding protein 50) in a region with QTL DON3H.52–65 identified with DON content (Massman et al. Citation2011). A DON-association was also observed at 595.2 Mbp which was coincident with the association for FHB and the number of days to heading. Deoxynivalenol (DON) association for overall analysis was identified in the tip of chromosome 4 HS at 7.7 Mbp which corresponds with the FHB association at the region (0.21–7.8Mbp) and aforementioned DON QTL. Deoxynivalenol (DON) also showed an association on chromosome 4 H at 571.1 Mbp in the region of HORVU.MOREX.r3.4 HG0405710(Ethylene-responsive transcription factor 1, ERF1). On chromosome 5 H, multiple regions were associated with DON content. Several associations were seen between 4.2–5.5 Mbp, with a peak at 4.9Mbp (-Log10 P-value = 3.9). These regions overlapped those of FHB association and include several receptor genes along with HORVU.MOREX.r3.5 HG0421020 (Pathogenesis related 1, PR1).Increased expression of salicylic acid (SA) and SA-inducible PR1 protein correlated with lower FHB severity in wheat (Makandar et al. Citation2012). A large association was observed at 530.9 Mbp (-Log10 P-value = 5.1) in the position of HORVU.MOREX.r3.5 HG0512320 (Cytochrome P450 superfamily protein). A QTL for FHB severity was previously reported at this location, QFHB.IPG-5 H close to marker SCRI_RS_184066 (529.5 Mbp) (Ogrodowicz et al. 20 020).
Several leucine-rich receptor-like protein kinase (LRR-RLK) family proteins were identified in association with FHB or DON (HORVU.MOREX.r3.2HG0104570, HORVU.MOREX.r3.2HG0156970, HORVU.MOREX.r3.5 HG0421310, HORVU.MOREX.r3.6 HG0556730). LRR-RLK proteins are broad-spectrum, pattern-recognition receptor (PRR) proteins localized to cell surfaces and are an important component of the surveillance system for the detection of microbial signatures playing an important part in the initial stage of plant defence (Tang et al. Citation2017). These play a role in pattern-triggered immunity (PTI) signaling by recognition of pathogen-associated molecular patterns (PAMPs). Following PAMP recognition, PTI response activates MAP kinases and reactive oxidative species (ROS) production. To circumventPTI resistance response, pathogens introduce effector molecules to the host. Plants have evolved a secondary layer of defence, called effector-triggered immunity (ETI) which involves specialized, resistance (R)-proteins (Jones and Dangl Citation2006).Nucleotide-binding site leucine-rich repeat (NBS-LRR) are R-proteins that interact (directly or indirectly) with pathogen effector molecules (alternatively called avirulence [Avr] proteins) whichtrigger anETI defence response, associated with an oxidative burst, hypersensitive response, and induction of pathogenesis-related genes. Several NBS-LRR genes were identified as being associated with FHB resistance (HORVU.MOREX.r3.1HG0005640, HORVU.MOREX.r3.1HG0093120, HORVU.MOREX.r3.3HG0234370).The number of marker-trait associations nearby genes involved in pathogen-sensing aspects suggests they may be important factors in barley-Fusarium interactions.
Transcription factors are important factors in modulating transcriptional programming in immune response (Tsuda and Somssich Citation2015). Genes of interest included those carrying myeloblastosis (MYB) domain (HORVU.MOREX.r3.5 HG0437600), which are key regulators of phenylpropanoid metabolism (Liu et al. Citation2015). Also identified by this study as a gene of interest was ethylene-responsive transcription factor 1 (ERF1, HORVU.MOREX.r3.4HG0405710) where ethylene signaling is known to be highly involved in FHB outcomes albeit complex (Foroud et al. Citation2019). Barley cultivars have demonstrated differential response in WRKY transcription factors (Huang et al. Citation2016; Tucker et al. Citation2021), with some contributing to resistance while others to susceptibility to F. culmorum crown rot. (Uluhan et al. Citation2019). Karre et al. (Citation2019) demonstrated HvWRKY23 as a major component of FHB through regulation of flavonoid production. HORVU.MOREX.r3.3HG0284810 (WRKY DNA-binding protein 50) and HORVU.MOREX.r3.5 HG0433910 (WRKY DNA-binding protein 74) are both genes of interest identified in the study. Arabidopsis gene AtWRKY50 is associated with salicylic acid (SA) defense response through binding to the PR1 promoter region and activating its expression (Hussain et al. Citation2018).
While barley genotypes differed in their response to FHB and DON accumulation, as expected, none showed immunity, or the ability to prevent DON production entirely. Defence strategies may involve limiting DON creation, but also involve chemical modification toxins, which may reduce their toxicity, but also may increase mobility for storage in vacuoles or cell walls (Boutigny et al. Citation2008). Several gene classes have been commonly connected to DON-specific resistance and/ or detoxification (Gunupuru et al. Citation2017) including those in this study: Cytochrome P450 (HORVU.MOREX.r3.5 HG0512320), ABC transporters (HORVU.MOREX.r3.4HG0331260), GSTs (HORVU.MOREX.r3.5 HG0501610) and UGTs (HORVU.MOREX.r3.5 HG0489730).
Numerous marker-trait associations for both FHB (51 SNPs over 22 regions) and DON (29 SNPs over 13 regions) were identified in this study, however, no regions could be defined as a major QTL. Low correlations for marker-trait associations are typical of GWAS. This study employed the 50 K SNP chip which provided sufficient marker coverage at > 25 K polymorphic markers. This finding, along with the observed continuous distribution of FHB-related traits, implies that a large number of minor genes likely contribute to the overall phenotype of two-row barley supporting the polygenic nature of FHB in barley. Several regions also coincided with HD50 or HT, implying that correlations between traits may be the result of pleiotropy, however, gene functions may imply tight linkages. Due to small additive effects and/or percentage of total variation explained by associated regions, genomic regions of interest may have limited breeding value in MAS, but could be monitored. Thus a more holistic approach should be employed when breeding FHB-resistant two-row barley, such as genomic selection (Meuwissen et al. Citation2001) which considers the joint merit of all molecular markers to predict genomic estimated breeding values (GEBVs) of breeding lines. Molecular markers identified in this study could provide additional information for developing prediction models. However, singular SNP molecular markers could not adequately predict FHB and DON, where phenotypic evaluations are still the best predictors of these traits even though they are time consuming and dependent on environmental conditions.
Supplemental Material
Download MS Word (410.4 KB)Supplementary_Table1.xlsx
Download MS Excel (41 KB)Acknowledgements
We thank Aaron Beattie (Crop Development Centre) and Patricia Juskiw (Field Crop Development Centre) for providing seeds. We thank Andy Tekauz and Jeannie Gilbert (Agriculture and Agri-Food Canada (AAFC) Cereal Research Centre) for providing F. graminearum single-spore isolates for inoculum production.We acknowledge the technical assistance of Nathan Henderson, Kevin Moore, Mira Popovic and the wheat-breeding group at AAFC-BRDC.
Disclosure statement
No potential conflict of interest was reported by the author(s).
Supplementary material
Supplemental data for this article can be accessed online here: https://doi.org/10.1080/07060661.2022.2086925
Data availability statement
The data discussed in this publication have been deposited in NCBI’s Gene Expression Omnibus (Edgar Citation2002) and are accessible through GEO Series accession number GSE188791 (https://www.ncbi.nlm.nih.gov/geo/query/acc.cgi?acc=GSE188791). LSMeans of phenotypic data are also available (Supplementary Table S1).
Additional information
Funding
References
- Ashburner M, Ball CA, Blake JA, Botstein D, Butler H, Cherry JM, Davis AP, Dolinski K, Dwight SS, Eppig JT, et al. 2000. Gene ontology: tool for the unification of biology. Nat Genet. 25(1):25–29. doi:10.1038/75556.
- Bai GH, Shaner G. 2004. Management and resistance in wheat and barley to Fusarium head blight. Annu Rev Phytopathol. 42(1):135–161. doi:10.1146/annurev.phyto.42.040803.140340.
- Bayer MM, Rapazote-Flores P, Ganal M, Hedley PE, Macaulay M, Plieske J, Ramsay L, Russell J, Shaw PD, Thomas W, et al. 2017. Development and evaluation of a barley 50k iSelect SNP array. Front Plant Sci. 8:1792. doi:10.3389/fpls.2017.01792
- Bedawy IMA, Dehne HW, Léon J, Naz AA. 2018. Mining the global diversity of barley for Fusarium resistance using leaf and spike inoculations. Euphytica. 214(1):18. doi:10.1007/s10681-017-2103-1.
- Blum M, Chang H, Chuguransky S, Grego T, Kandasaamy S, Mitchell A, Nuka G, Paysan-Lafosse T, Qureshi M, Raj S, et al. 2021. The InterPro protein families and domains database: 20 years on. Nucleic Acids Res. 49(D1):D344–D354. doi:10.1093/nar/gkaa977.
- Boutigny A-L, Richard-Forget F, Barreau C. 2008. Natural mechanisms for cereal resistance to the accumulation of Fusarium trichothecenes. Eur J Plant Pathol. 121(4):411–423. doi:10.1007/s10658-007-9266-x.
- Buerstmayr H, Legzdina L, Steiner B, Lemmens M. 2004. Variation for resistance to Fusarium head blight in spring barley. Euphytica. 137(3):279–290. doi:10.1023/B:EUPH.0000040440.99352.b9.
- Bush WS, Moore JH. 2012. Chapter 11: genome-wide association studies. PLoS Comput Biol. 8(12):e1002822. doi:10.1371/journal.pcbi.1002822.
- Chan EK, Rowe HC, Kliebenstein DJ. 2010. Understanding the evolution of defense metabolites in Arabidopsis thaliana using genome-wide association mapping. Genetics. 185(3):991–1007. doi:10.1534/genetics.109.108522.
- Choo TM, Vigier B, Shen QQ, Martin RA, Ho KM, Savard M. 2004. Barley traits associated with resistance to Fusarium head blight and deoxynivalenol accumulation. Phytopathology. 94(10):1145–1150. doi:10.1094/PHYTO.2004.94.10.1145.
- Clear RM, Patrick SK, Platford RG, Desjardins M. 1996. Occurrence and distribution of Fusarium species in barley and oat seed from Manitoba in 1993 and 1994. Can J Plant Pathol. 18(4):409–414. doi:10.1080/07060669609500596.
- Close TJ, Bhat PR, Lonardi S, Wu Y, Rostoks N, Ramsay L, Druka A, Stein N, Svensson JT, Wanamaker S, et al. 2009. Development and implementation of high-throughput SNP genotyping in barley. BMC Genomics. 10(1):582. doi:10.1186/1471-2164-10-582.
- Comadran J, Kilian B, Russell J, Ramsay L, Stein N, Ganal M, Shaw P, Bayer M, Thomas W, Marshall D, et al. 2012. Natural variation in a homolog of Antirrhinum CENTRORADIALIS contributed to spring growth habit and environmental adaptation in cultivated barley. Nat Genet. 44(12):1388–1392. doi:10.1038/ng.2447.
- Dahleen LS, Agrama HA, Horsley RD, Steffenson BJ, Schwarz PB, Mesfin A, Franckowiak JD. 2003. Identification of QTL associated with Fusarium head blight resistance in Zhedar 2 barley. Theor Appl Genet. 108(1):95–104. doi:10.1007/s00122-003-1409-7.
- de la Peña RC, Smith KP, Capettini F, Muehlbauer GJ, Gallo-Meagher M, Dill-Macky R, Somers DA, Rasmusson DC. 1999. Quantitative trait loci associated with resistance to Fusarium head blight and kernel discoloration in barley. Theor Appl Genet. 99(3–4):561–569. doi:10.1007/s001220051269.
- Earl DA, vonHoldt BM. 2012. STRUCTURE HARVESTER: a website and program for visualizing STRUCTURE output and implementing the Evanno method. Conserv. 4(2):359–361. doi:10.1007/s12686-011-9548-7.
- Edgar R. 2002. Gene expression omnibus: NCBI gene expression and hybridization array data repository. Nucleic Acids Res. 30(1):207–210. doi:10.1093/nar/30.1.207.
- Evanno G, Regnaut S, Goudet J. 2005. Detecting the number of clusters of individuals using the software STRUCTURE: a simulation study. Mol Ecol. 14(8):2611–2620. doi:10.1111/j.1365-294X.2005.02553.x.
- Foroud NA, Ouellet T, Laroche A, Oosterveen B, Jordan MC, Ellis BE, Eudes F. 2012. Differential transcriptome analyses of three wheat genotypes reveal different host response pathways associated with Fusarium head blight and trichothecene resistance. Plant Pathology. 61(2):296–314. doi:10.1111/j.1365-3059.2011.02512.x.
- Foroud NA, Pordel R, Goyal RK, Ryabova D, Chatterton S, Kovalchuk I. 2019. Chemical activation of the ethylene signalling pathway promotes wheat resistance to Fusarium graminearum. Phytopathology. 109(5):796–803. doi:10.1094/PHYTO-08-18-0286-R.
- Gottwald S, Samans B, Lück S, Friedt W. 2012. Jasmonate and ethylene dependent defence gene expression and suppression of fungal virulence factors: two essential mechanisms of Fusarium head blight resistance in wheat? BMC Genomics. 13(1):369. doi:10.1186/1471-2164-13-369.
- Gunupuru LR, Perochon A, Doohan FM. 2017. Deoxynivalenol resistance as a component of FHB resistance. Trop Plant Pathol. 42(3):175–183. doi:10.1007/s40858-017-0147-3.
- He X, Osman M, Capettini F, Helm J, Singh P. 2015. Evaluation of Canadian barley breeding lines for Fusarium head blight resistance. Can J Plant Sci. 95(5):923–925. doi:10.4141/cjps-2015-062.
- Hori K, Kobayashi T, Sato K, Takeda K. 2005. QTL analysis of Fusarium head blight resistance using a high-density linkage map in barley. Theor Appl Genet. 111(8):1661–1672. doi:10.1007/s00122-005-0102-4.
- Hori K, Sato K, Kobayashi T, Takeda K. 2006. QTL analysis of Fusarium head blight severity in recombinant inbred population derived from a cross between two-rowed barley varieties. Breed Sci. 56(1):25–30. doi:10.1270/jsbbs.56.25.
- Horsley RD, Schmierer D, Maier C, Kudrna D, Urrea CA, Steffenson BJ, Schwarz PB, Franckowiak JD, Green MJ, Zhang B, et al. 2006. Identification of QTLs associated with Fusarium head blight resistance in barley accession CIho 4196. Crop Sci. 46(1):145–156. doi:10.2135/cropsci2005.0247.
- Huang Y, Li L, Smith KP, Muehlbauer GJ. 2016. Differential transcriptomic responses to Fusarium graminearum infection in two barley quantitative trait loci associated with Fusarium head blight resistance. BMC Genomics. 17(1):387. doi:10.1186/s12864-016-2716-0.
- Huang Y, Haas M, Heinen S, Steffenson BJ, Smith KP, Muehlbauer GJ. 2018. QTL mapping of Fusarium head blight and correlated agromorphological traits in an elite barley cultivar Rasmusson. Front Plant Sci. 9:1260. doi:10.3389/fpls.2018.01260
- Hussain RMF, Sheikh AH, Haider I, Quareshy M, Linthorst HJM. 2018. Arabidopsis WRKY50 and TGA transcription factors synergistically activate expression of PR1. Front Plant Sci. 9:930. doi:10.3389/fpls.2018.00930
- Jia H, Millett BP, Cho S, Bilgic H, Xu WW, Smith KP, Muehlbauer GJ. 2011. Quantitative trait loci conferring resistance to Fusarium head blight in barley respond differentially to Fusarium graminearum infection. Funct Integr Genomics. 11(1):95–102. doi:10.1007/s10142-010-0192-1.
- Jones JDG, Dangl JL. 2006. The plant immune system. Nature. 444(7117):323–329. doi:10.1038/nature05286.
- Juskiw P, Oatway L, Oro MP, Nyachiro JM, Anbessa Y, Xi K, Turkington TK, Lohr S, Bowness J, Capettini F. 2019. Registration of ‘Lowe’, a two-rowed malting barley with enhanced resistance to Fusarium head blight. J Plant Regist. 13(3):301–310. doi:10.3198/jpr2018.11.0075crc.
- Karre S, Kumar A, Yogendra K, Kage U, Kushalappa A, Charron JB. 2019. HvWRKY23 regulates flavonoid glycoside and hydroxycinnamic acid amide biosynthetic genes in barley to combat Fusarium head blight. Plant Mol Biol. 100(6):591–605. doi:10.1007/s11103-019-00882-2.
- Koppolu R, Anwar N, Sakuma S, Tagiri A, Lundqvist U, Pourkheirandish M, Rutten T, Seiler C, Himmelbach A, Ariyadasa R, et al.$3$2 2013. Six-Rowed spike4 (Vrs4) controls spikelet determinacy and row-type in barley. Proc Natl Acad Sci U S a. 110(32):13198–13203. doi:10.1073/pnas.1221950110
- Kumar A, Yogendra KN, Karre S, Kushalappa AC, Dion Y, Choo TM. 2016. WAX INDUCER1 (HvWIN1) transcription factor regulates free fatty acid biosynthetic genes to reinforce cuticle to resist Fusarium head blight in barley spikelets. J Exp Bot. 67(14):4127–4139. doi:10.1093/jxb/erw187.
- Kushalappa AC, Yogendra KN, Karre S. 2016. Plant innate immune response: qualitative and quantitative resistance. Crit Rev Plant Sci. 35(1):38–55. doi:10.1080/07352689.2016.1148980.
- Laitila A. 2015. Toxigenic fungi and mycotoxins in the barley-to-beer chain. In: Hill A, editor. Brewing microbiology: managing microbes, ensuring quality and valorising waste, woodhead publishing series in food science, technology and nutrition. Oxford (UK,): Woodland Publishing; p. 107–139. doi:10.1016/B978-1-78242-331-7.00006-X
- Lancova K, Hajslova J, Poustka J, Krplova A, Zachariasova M, Dostalek P, Sachambula L. 2008. Transfer of Fusarium mycotoxins and ‘masked’ deoxynivalenol (deoxynivalenol-3-glucoside) from field barley through malt to beer. Food Addit Contam Part A Chem Anal Control Expo Risk Assess. 25(6):732–744. doi:10.1080/02652030701779625.
- Legge WG, Therrien MC, Tucker JR, Banik M, Tekauz A, Somers D, Savard ME, Rossnagel BG, Lefol E, Voth D, et al. 2004. Progress in breeding for resistance to fusarium head blight in barley. Can J Plant Pathol. 26(4):436–442. doi:10.1080/07060660409507163.
- Legge WG, Badea A, Tucker JR, Fetch TG, Haber S, Menzies JG, Tekauz A, Turkington TK, Martin RA, Choo TM, et al. 2017. AAC Connect barley. Can J Plant Sci. 97:539–548. doi:10.1139/cjps-2016-0312
- Legge WG, Badea A, Tucker JR, Fetch TG, Banik M, Haber S, Menzies JG, Tekauz A, Turkington TK, Martin RA, et al. 2018. AAC Goldman barley. Can J Plant Sci. 98(5):1203–1211. doi:10.1139/cjps-2017-0361.
- Linkmeyer A, Götz M, Hu L, Asam S, Rychlik M, Hausladen H, Hess M, Hückelhoven R. 2013. Assessment and introduction of quantitative resistance to Fusarium head blight in elite spring barley. Phytopathology. 103(12):1252–1259. doi:10.1094/PHYTO-02-13-0056-R.
- Liu J, Osbourn A, Ma P. 2015. MYB Transcription factors as Regulators of phenylpropanoid metabolism in plants. Mol Plant. 8(5):689–708. doi:10.1016/j.molp.2015.03.012.
- Ma Z, Steffenson BJ, Prom LK, Lapitan NL. 2000. Mapping of quantitative trait loci for Fusarium head blight resistance in barley. Phytopathology. 90(10):1079–1088. doi:10.1094/PHYTO.2000.90.10.1079.
- Makandar R, Nalam VJ, Lee H, Trick HN, Dong Y, Shah J. 2012. Salicylic acid regulates basal resistance to Fusarium head blight in wheat. Mol PlantMicrobe Interact. 25:431–439. doi:10.1094/MPMI-09-11-0232
- Mamo BE, Steffenson BJ. 2015. Genome-wide association mapping of Fusarium head blight resistance and agromorphological traits in barley landraces from Ethiopia and Eritrea. Crop Sci. 55(4):1494–1512. doi:10.2135/cropsci2014.06.0428.
- Mascher M, Wicker T, Jenkins J, Plott C, Lux T, Koh CS, Ens J, Gundlach H, Boston LB, Tulpová Z, et al. 2021. Long-read sequence assembly: a technical evaluation in barley. Plant Cell. 33(6):1888–1906. doi:10.1093/plcell/koab077.
- Massman J, Cooper B, Horsley R, Neate S, Dill-Macky R, Chao S, Dong Y, Schwarz P, Muehlbauer GJ, Smith KP. 2011. Genome-wide association mapping of Fusarium head blight resistance in contemporary barley breeding germplasm. Mol Breed. 27(4):439–454. doi:10.1007/s11032-010-9442-0.
- McLaughlin JE, Darwish NI, Garcia-Sanchez J, Tyagi N, Trick HN, McCormick S, Dill-Macky R, Tumer NE. 2021. A lipid transfer protein has antifungal and antioxidant activity and suppresses Fusarium head blight disease and DON accumulation in transgenic wheat. Phytopathology. 111(4):671–683. doi:10.1094/PHYTO-04-20-0153-R.
- Mesfin A, Smith KP, Dill-Macky R, Evans CK, Waugh R, Gustus CD, Muehlbauer GJ. 2003. Quantitative trait loci for Fusarium head blight resistance in barley detected in a two-rowed by six-rowed population. Crop Sci. 43(1):307–318. doi:10.2135/cropsci2003.3070.
- Meuwissen TH, Hayes BJ, Goddard ME. 2001. Prediction of total genetic value using genome-wide dense marker maps. Genetics. 157(4):1819–1829. doi:10.1093/genetics/157.4.1819.
- Mistry J, Chuguransky S, Williams L, Qureshi M, Salazar GA, Sonnhammer ELL, Tosatto SCE, Paladin L, Raj S, Richardson LJ, et al. 2020. Pfam: the protein families database in 2021. Nucleic Acids Res. 49(D1):D412–D419. doi:10.1093/nar/gkaa913.
- Ogrodowicz P, Kuczyńska A, Mikołajczak K, Adamski T, Surma M, Krajewski P, Ćwiek-Kupczyńska H, Kempa M, Rokicki M, Jasińska D, et al. 2020. Mapping of quantitative trait loci for traits linked to fusarium head blight in barley. PLoS One. 15(2):e0222375. doi:10.1371/journal.pone.0222375.
- Pritchard JK, Stephens M, Donnelly P. 2000. Inference of population structure using multilocus genotype data. Genetics. 155(2):945–959. doi:10.1093/genetics/155.2.945.
- R Core Team. 2021. R: a language and environment for statistical computing. R Foundation for Statistical Computing, Vienna, Austria. [ accessed 2022 Apr 13]. https://www.R-project.org/
- Ramasamy RK, Ramasamy S, Bindroo BB, Naik VG. 2014. STRUCTURE PLOT: a program for drawing elegant STRUCTURE bar plots in user friendly interface. Springerplus. 3(1):431. doi:10.1186/2193-1801-3-431.
- Rossnagel BG, Zatorski T, Voth WD, Scoles GJ, Legge WG, Tucker JR, Tekauz A, Savard M. 2008. Registration of ‘CDC Mindon’ barley. J Plant Reg. 2(2):79–84. doi:10.3198/jpr2007.10.0568crc.
- Sallam AH, Endelman JB, Jannink J-L, Smith KP. 2015. Assessing genomic selection prediction accuracy in a dynamic barley breeding population. Plant Genome. 8:lantgenome2014.05.0020. doi:10.3835/plantgenome2014.05.0020
- SAS Institute Inc. 2019. SAS JMP Genomics version 9.1. Cary, NC, USA: SAS Institute Inc.
- Tang D, Wang G, Zhou J-M. 2017. Receptor kinases in plant-pathogen interactions: more than pattern recognition. Plant Cell. 29(4):618–637. doi:10.1105/tpc.16.00891.
- Tekauz A, McCallum B, Gilbert J. 2000. Review: fusarium head blight of barley in western Canada. Can J Plant Pathol. 22(1):9–16. doi:10.1080/07060660009501156.
- Tsuda K, Somssich IE. 2015. Transcriptional networks in plant immunity. New Phytol. 206(3):932–947. doi:10.1111/nph.1328.
- Tucker JR, Badea A, Blagden R, Pleskach K, Tittlemier SA, Fernando WGD. 2019. Deoxynivalenol-3-Glucoside content is highly associated with deoxynivalenol levels in two-Row barley genotypes of importance to Canadian barley breeding programs. Toxins. 11(6):319. doi:10.3390/toxins11060319.
- Tucker JR, Legge WG, Maiti S, Hiebert CW, Simsek S, Yao Z, Xu W, Badea A, Fernando WGD. 2021. Transcriptome alterations of an in vitro-selected, moderately resistant, two-row malting barley in response to 3ADON, 15ADON, and NIV Chemotypes of Fusarium graminearum. Front Plant Sci. 12:701969. doi:10.3389/fpls.2021.701969
- Turner A, Beales J, Faure S, Dunford RP, Laurie DA. 2005. The pseudo-response regulator Ppd-H1 provides adaptation to photoperiod in barley. Science. 310(5750):1031–1034. doi:10.1126/science.1117619.
- Uluhan E, Keleş EN, Tufan F. 2019. Analysis of WRKY transcription factors in barley cultivars infected with Fusarium culmorum. Int J Life Sci and Biotechnol. 2(3):165–174. doi:10.38001/ijlsb.588730.
- Waugh R, Jannink J-L, Muehlbauer G, Ramsay L. 2009. The emergence of whole genome association scans in barley. Curr Opin Plant Bio. 12(2):218–222. doi:10.1016/j.pbi.2008.12.007.
- Yu GT, Franckowiak JD, Neate SM, Zhang B, Horsley RD. 2010. A native QTL for Fusarium head blight resistance in North American barley (Hordeum vulgare L.) independent of height, maturity, and spike type loci. Genome. 53(2):111–118. doi:10.1139/G09-091.
- Zadoks JC, Chang TT, Konzak CF. 1974. A decimal code for the growth stages of cereals. Weed Res. 14(6):415–421. doi:10.1111/j.1365-3180.1974.tb01084.x.
- Zhu H, Gilchrist L, Hayes P, Kleinhofs A, Kudrna D, Liu Z, Prom L, Steffenson B, Toojinda T, Vivar H. 1999. Does function follow form? Principal QTLs for Fusarium head blight (FHB) resistance are coincident with QTLs for inflorescence traits and plant height in a doubled-haploid population of barley. Theor Appl Genet. 99(6):1221–1232. doi:10.1007/s001220051328.