
Abstract
Canola (Brassica napus L.) production is threatened by blackleg disease caused by Leptosphaeria maculans. Disease outcome is determined by interactions among pathogens, plants, farming practices, and environmental factors. Although the gene-for-gene interactions between the pathogen and its plant host are relatively clear, how precisely the pathogen interacts with the environment and farming practices is still poorly understood, making disease forecasting challenging for commercial farmlands. In recent years, artificial intelligence (AI) has been successful in forecasting disease risks based on environmental factors. In this study, we evaluated two AI methods and a data augmentation method to forecast disease risk using a dataset collected from 116 farmlands in Alberta in 2021 and 2022. We first assessed a machine learning model (support vector machine or SVM) and a deep-learning model (convolutional neural network or CNN) to predict blackleg severity based on five weather variables, flea beetle damage, root maggot damage, and crop-rotation variables. Both SVM and CNN predicted the disease risk with an accuracy of over 66%. The data augmentation method did not improve model performance. Flea beetle feeding and maggot damage contribute little to the model’s performance, and omitting these data did not appear to affect the results. In contrast, crop rotation contributes substantially to model performance. The five weather variables contribute roughly equally to the model’s performance, and removing any of the individual weather variables did not impact prediction ability for both models.
Résumé
La production de canola (Brassica napus L.) est menacée par la nécrose du collet causée par Leptosphaeria maculans. L’issue de la maladie est déterminée par les interactions entre l’agent pathogène, la plante, les pratiques culturales et les facteurs environnementaux. Bien que les interactions gène pour gène entre l’agent pathogène et sa plante hôte soient relativement claires, celles mettant précisément en cause l’environnement et les pratiques culturales ne sont pas bien comprises, ce qui constitue un défi quant à la prédiction de la maladie sur les terres agricoles commerciales. Récemment, l’intelligence artificielle (IA) a réussi à prédire les risques de maladie en se basant sur les facteurs environnementaux. Dans cette étude, nous avons évalué deux méthodes d’IA et une technique d’augmentation des données pour prédire le risque de maladie avec un jeu de données collectées, en 2021 et 2022, sur 116 terres agricoles de l’Alberta. Nous avons d’abord évalué un modèle d’apprentissage automatique (machine à vecteur de support ou MVS) et un modèle d’apprentissage profond (réseau neuronal à convolution ou RNC) pour prédire la gravité de la nécrose du collet en nous basant sur cinq variables climatiques, le dommage causé par l’altise, le dommage causé par la mouche des racines et les variables associées à la rotation des cultures. La SMV et le RNC ont prédit le risque de maladie avec une précision de plus de 66%. La technique d’augmentation des données n’a pas amélioré la performance du modèle. Les attaques d’altise et les dommages causés par la mouche des racines ont faiblement contribué à la performance du modèle et l’omission de ces données ne semble pas avoir influencé les résultats. En revanche, la rotation des cultures contribue substantiellement à la performance du modèle. Les cinq variables climatiques contribuent à peu près également à la performance du modèle, et la suppression de quelque variable que ce soit n’a pas influencé la capacité de prédiction des deux modèles.
Introduction
Canola (Brassica napus L.) contributes significantly to the Canadian economy but its production is under constant threat of blackleg disease caused by Leptosphaeria maculans (Desm.) Ces. & de Not., a hemibiotrophic fungal pathogen (Fitt et al. Citation2006). A noticeable increase in blackleg incidence has been reported in recent years, although this trend varied depending on location and year (Peng et al. Citation2020). Blackleg infection and disease development can be influenced by many factors, such as climate conditions, farming practices, pathogen and host interactions, as well as interactions between these factors (Sosnowski et al. Citation2004). For example, both temperature and moisture affect the maturation of pseudothecia on canola stubble (Petrie Citation1994), and ascospore release can be triggered by rainfall or dew (Barbetti Citation1975). Wind can carry the released spores to canola cotyledons and/or leaves, and subsequent spore germination can be triggered by at least four hours of continuous wetness and temperatures above 20°C (Hall Citation1992). When temperatures remain between 15 and 20°C, pathogen infection can be favoured by at least 48 hours of leaf wetness, and symptoms can develop on cotyledons and leaves within a week (Biddulph et al. Citation1999; Toscano‐Underwood et al. Citation2001). Abundant pycnidia can be produced from leaf lesions when day/night temperatures range between 18/11°C and 24/15°C (Barbetti Citation1975). Rain splash and wind help spread the inoculum to other parts of the plant and neighbouring plants (Sosnowski et al. Citation2004). Long periods of high humidity increase the rate of infection (Mcgee and Emmett Citation1977; Xi et al. Citation1991). In general, climate conditions affect life cycle, infection, as well as spread of blackleg disease. The interactions between environmental conditions and blackleg outbreaks have been studied previously (Mcgee and Emmett Citation1977; Xi et al. Citation1991; Biddulph et al. Citation1999; Toscano‐Underwood et al. Citation2001; Sosnowski et al. Citation2004; Ghanbarnia et al. Citation2009). However, these studies either concerned only a specific event in disease cycle or involved limited environmental conditions. Analysis using a more comprehensive set of conditions encompassing weather and other disease-associated events can be very helpful to control this disease.
Flea beetle (Phyllotreta spp.) feeding wounds may also facilitate infection as the pathogen can infect cotyledons readily through fresh wounds in the complete absence of leaf wetness (Huang et al. Citation2022). Typically, overwintered flea beetle adults feed extensively on canola seedlings during that time of year (Westdal and Romanow Citation1972; Lamb Citation1989; Cárcamo et al. Citation2008), leaving severe feeding wounds on seedling cotyledons or true leaves. Usually, infection of intact leaves through stomata requires a long period of leaf wetness under warm conditions (Hammond et al. Citation1985; Biddulph et al. Citation1999; Toscano‐Underwood et al. Citation2001; Huang et al. Citation2005), but these conditions are uncommon on the Canadian prairies in spring. It is highly possible that the blackleg pathogen infects plant cotyledons through feeding wounds. However, the impact of the wounds on blackleg disease development is largely unknown and hypothetical. In a recent study using plot trials, controlling flea beetles with in-crop insecticide failed to show consistent reduction of blackleg disease severity (internal communication). The association between flea beetle feeding and blackleg infection has not been thoroughly examined using data collected from real-world commercial fields.
Models have been developed to identify the relative contribution of different elements to blackleg disease and to forecast blackleg disease development. For example, the concentration of Leptosphaeria spp. in air samples was identified as important information for predicting the disease (Jedryczka et al. Citation2008; Poslušná and Plachka Citation2014). Lô-Pelzer et al. (Citation2010) built the SIPPOM system to predict disease based on a comprehensive set of data which involved the genetic structure of pathogen populations, weather data, soil characteristics, cropping systems, and their spatial distribution. This model integrated five sub-models to predict (1) primary inoculum production, (2) ascospore dispersal, (3) crop development, (4) plant infection, disease severity and yield loss, and (5) changes in the genetic structure of pathogen populations over time. In this model, R2 was 56% for the variation in the predicted leaf spots per plant and ranged from 75% to 85% for the disease index and relative yield loss. However, the parameters used in the prediction model such as the coefficient of interception of ascospores and fungicide persistence are relatively hard to be collected in real world.
The collective contribution from many sources makes it challenging to forecast blackleg risk with traditional methods. In recent years, there has been a growing exploration of artificial intelligence (AI) and the large-scale data to analyze contributing factors to disease and to provide support in disease prevention (Fenu and Malloci Citation2021). For example, using an long short-term memory (LSTM) network, Xiao et al. (Citation2018, Citation2019). found that moderate temperature, humidity, low wind speed, and rainfall in autumn and winter contributed to the occurrence of cotton pests and diseases. Khaki et al. (Citation2020) employed a convolutional neural network (CNN) in conjunction with a recurrent neural network (RNN) to construct a CNN-RNN model. This model was employed to forecast corn and soybean yield by considering weather patterns, soil conditions at different depths, and various agricultural management approaches. This study also explored the ability of the CNN-RNN model in explaining how factors such as weather conditions, management practices, and soil conditions contribute to crop yields. Zhang et al. (Citation2019) explored the contribution of different factors to the final maize yield. In the study, environmental, fluorescence, optical and thermal satellite data were used. Besides its high explanation of yield variation (75%) with the multi-source data, the analysis based on deep learning also found that the silking stage, high temperature, and vapour pressure deficit during the reproductive period were more important factors than others, while the contribution of soil properties and management factors cannot be fully explained. The Gaussian mixture model developed by Skelsey (Citation2021) reached an accuracy of 97% when predicting the outbreak of potato late blight using weather data.
While AI has proved its ability in data analysis, data selection and collection per se from commercial fields present a huge challenge. For blackleg, weather information, cultivar resistance, crop rotation history, pathogen population (Fernando et al. Citation2018) and even flea beetle damage may all be relevant to risk assessment. Some of the data are difficult to collect precisely. For example, both qualitative (major gene) and quantitative (multi-gene) resistance may exist in many Canadian canola varieties. After years of planting, pathogen population in fields may vary under selection pressure, resulting in breakdown in qualitative resistance and increased blackleg rating in some fields. Gathering these data involves extensive on-site surveys, which can be costly. Often smaller datasets are collected, but they are usually insufficient for in-depth analyses. Data augmentation methods may be used in these cases. For example, through random sampling, Zhong et al. (Citation2018) augmented the dataset of soybean variety trials with less than 35 samples to make their model more stable in predicting yield potential.
In this study, we analyzed a small dataset for canola blackleg disease with the intention of answering the questions of (1) what is the capability of AI methods, specifically deep learning and machine learning, in predicting the risk of blackleg disease using a dataset that is both complex and restricted in size, (2) does data augmentation enhance both machine learning and deep learning in the accuracy and F1-score, and (3) to what extent do different factors influence blackleg risk assessment. The dataset was collected in 2021 and 2022, and included weather data, crop rotation history, flea beetle and root maggot damage, and blackleg severity. The initial analysis focused on (1) AI model training and comparison, (2) data augmentation, and (3) relative contributions of different factors.
Materials and methods
The workflow of this study is shown in . First, the data collected from 116 canola fields were preprocessed and divided into model training and testing datasets. The training dataset was augmented first before model training. Both support vector machine (SVM) and CNN were trained, and the trained models were validated with the testing dataset.
Fig. 1 The framework in data pre-processing, dataset separation, model development, and model evaluation. The dataset was first preprocessed, which involved data cleaning, imputing missing data, normalization, classification based on blackleg incidence, and dataset separation into training and testing datasets. Only the training dataset was augmented to evaluate data augmentation effects. Models were trained with non-augmented or augmented datasets, and the results were evaluated for accuracy and F1-score.
Data collection
We collected four-year crop rotation history over 116 commercial canola fields in Alberta, Canada with the consent of participating producers. The assessment of flea beetle damage was conducted at the cotyledon stage (BBCH 10–13) by visually inspecting the percentage of cotyledon area affected by feeding, employing a rating scale outlined by the Canola Council of Canada (Citation2020). In a subsequent visit to the fields, between the ripening (BBCH 80) and senescence (BBCH 90) stages of crop growth, the plants were evaluated once more for blackleg severity and root maggot damage. Pest damage and blackleg severity were collected through assessing 20 plants at five locations per field, following a W-shaped transect pattern. Root maggot injury was estimated using a 0–5 scale, where 0 = no damage to roots; 1 = slight feeding, < 10% of tap root surface damaged; 2 = 10–25% of root surface damaged; 3 = 26–50% of root surface damaged, tunnelling into interior; 4 = 51–75% of root surface damaged; extensive tunnelling; and 5 = 76–100% of root damaged, or root severed (Dosdall et al. Citation1994). Blackleg severity was also estimated using a 0–5 scale where: 0 = no disease in a cross-section of the stem base; 1 = decay on < 25% of the cross-sectional area of the crown; 2 = decay on 25%–50% of the cross-section; 3 = decay on 51%–75% of the cross-section; 4 = decay on > 75% of the cross-section; and 5 = death of the plant (Guo and Fernando Citation2005). Weather conditions for each field were obtained from the nearest weather station in the Alberta Climate Information Service network (https://agriculture.alberta.ca/acis/, 2020). The weather data included daily maximum temperature (°C), minimum temperature (°C), mean relative humidity (%), rainfall (mm), and wind speed (kmph). The 58 fields for 2021 data were covered by 22 different weather stations, while the 58 fields for 2022 were covered by 29 different weather stations ().
Table 1. Weather stations and the number of covered fields for each station.
We used a blackleg severity of 0.23 to group the data entries into two categories, and they are A (low) and B (high). There are two basic considerations: (1) 0.23 disease severity (or ~ 4% in yield loss as indicated by Hwang et al. (Citation2016)) is noticeable in profit loss, and (2) this value (or 0.23) could separate the blackleg disease data into two classes with each of the classes having a similar number of data points (65 for class A and 56 for class B).
Data processing
For each field, blackleg severity serves as the dependent variable, while weather data, pest damage data, and crop-rotation data served as the independent variables. The weather data were collected spanning a time frame of 182 days from March 3rd to August 31th in either 2021 or 2022. Additionally, pest damage variables include flea beetle and root maggot feeding. Furthermore, the crop rotation history for the years 2017–2020 or 2018–2021 was incorporated, preceding canola sowing in 2021 or 2022. Each rotation crop was assigned a corresponding number: barley = 1, wheat = 2, pea = 3, potato = 4, flax = 5, fall rye = 6, grassland = 7, corn = 8, canola = 9, oat = 10, alfalfa = 11, durum = 12, and lentil = 13. Thus, there were 182 columns to include 182 days from March 3rd to August 31st 2021 or 2022 in the dataset. In each column, there were 12 rows representing the five weather variables, flea beetle incidence, root maggot incidence and severity, and crop codes for four years. Therefore, there are 182 × 12 or 2,184 independent variables for data entry.
For the 2021 data, there were five fields which each had similar distances to two separate weather stations, and thus two different sets of weather variables could be assigned to each of the five fields. Thus, each of these five fields were treated as two independent data entries, producing a total of 121 entries in the final dataset. There were 11 entries that had no root maggot data while one entry lacked flea beetle information; they were filled with the mean value of non-missing values.
Data augmentation
To enrich the dataset, we selected the weighted form of the dynamic time warping barycentric averaging (DBA) technique (Petitjean et al. Citation2011, Citation2014, Citation2016). Dynamic Time Warping (DTW) is a method used to measure the similarity between two time series that may have different lengths and exhibit temporal distortions. The DTW Barycentric Averaging (DBA) technique is a way to iteratively find a representative time series, called the barycentre, for a given set of time series data which is the case for our dataset. By varying the weights in DBA, an infinite number of new data entries can be created from a given dataset. Briefly, the data augmentation process started with a random selection of a data entry from the training dataset, and this entry was assigned a weight value of 0.5. Then five nearest neighbours, based on the dynamic time warping distance, were searched and two of them were randomly selected, with each being assigned a weight value of 0.15. The remaining three neighbours would share the rest of the weight, 0.2. It should be noted that the data augmentation process was only applied to the training dataset. The testing dataset remained intact to validate trained models. To evaluate how data augmentation scale impacts AI performance, we augmented the dataset into scales of 120, 320, 519, 719, and 1,119 data entries.
Prediction models
As our dataset is relatively small, the over-fitting problem may occur. For this reason, we chose SVM as the specific model to represent the machine learning method for its robustness to the over-fitting problem (Chi et al. Citation2008). For a similar reason, we designed a CNN model architecture containing a small number of hidden layers (Pasupa and Sunhem Citation2016) to avoid over-fitting. The detailed CNN architecture is illustrated in . The CNN was trained for 600 epochs with a learning rate of 0.001. The loss between the prediction output and the ground truth was calculated with the CrossEntropyLoss function, while the Adam optimizer was used to optimize model parameters. In the end, the testing dataset was used to validate the developed model. We used the k-fold cross-validation method to minimize the random effect, and thus the final accuracies and F1-scores were the averaged values of the k-fold datasets. Also, to have a proper number of data entries for model validation in each fold scheme, we trained the models with 3-, 4-, or 5- fold cross-validation methods. When dividing the dataset, each class was distributed proportionally in both training and testing datasets to avoid bias. The numbers of entries for training and testing datasets are shown in . The CNN model development used Pytorch (version 1.11.0) and Python (version 3.8.3), while the SVM model was developed using Python (version 3.8.3).
Fig. 2 (Colour online) The architecture for the convolution neural network (CNN) model. The input matrix contains data from 12 weather variables spanning across 182 days. It undergoes various stages within the CNN architecture. These stages include convolution, followed by pooling and dropout, along with linear layers. Eventually, the softmax function is applied to transform the model’s output into classification predictions.
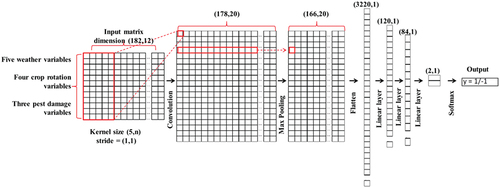
Table 2. Dataset separation in the k-fold cross-validation method.
We used prediction accuracy and F1-score to evaluate the performance of SVM and CNN models. Accuracy is to measure the percentage of correctly predicted objects out of the total objects in our dataset. It is computed using the formula: accuracy = (number of correctly classified objects)/(total number of objects). While accuracy is a widely used and valuable metric, it may not always provide a complete picture of the model’s performance, especially when dealing with imbalanced datasets. The F1-score is a metric that takes into account both precision and recall evaluating our model’s performance. Precision refers to the ratio of true positive predictions to the total positive predictions, and recall is the ratio of true positive predictions to the total actual positive instances. The F1-score is estimated as: F1-score = 2 × (precision × recall)/(precision + recall). The F1-score is particularly useful when the data are imbalanced.
Results
Dataset distribution across weather stations
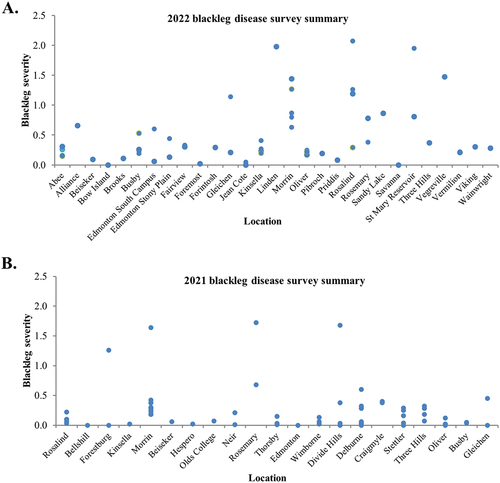
The dataset consisted of a total of 121 data entries which were classified as low (A) or high (B) based on a disease severity threshold of 0.23. Blackleg severity across Alberta is summarized in . The 2021 weather data were collected from 22 weather stations, and the 2022 weather data was collected from 29 weather stations. While the weather data for class A was recovered from 36 weather stations, weather data for class B was recovered from 23 weather stations. Although several data entries shared the same weather variables, crop rotation history was unique for each of the data entries. The distribution of each data entry across the weather stations is shown in .
Fig. 3 (Colour online) Summary of disease severity across Alberta in 2021 and 2022. (A) Blackleg disease severity in 2021. (B) blackleg disease severity in 2022.
Model performances without data augmentation
The prediction models were trained, and the SVM model reached average testing accuracies of 66.08 ± 4.50%, 66.94 ± 7.09%, and 57.8 ± 10.50%, and average F1-scores at 0.66 ± 0.04, 0.66 ± 0.07, and 0.58 ± 0.10 for the 3-, 4-, and 5-fold datasets respectively (). Meanwhile, the CNN model reached 66.19 ± 4.81% in accuracy and 0.65 ± 0.03 in F1-score when using the 3-fold dataset, 64.28 ± 5.63% and 0.64 ± 0.06 for the 4-fold dataset, and 62.79 ± 10.35% and 0.61 ± 0.09 for the 5-fold dataset, respectively. When comparing these two models, the CNN and SVM models showed similar predictive accuracies (P = 0.89, 0.52 and 0.23 for 3-, 4- and 5-fold cross-validation datasets, respectively). The F1-scores were also similar between the CNN and SVM models.
Table 3. Model prediction accuracies for the datasets that deleted different variables.
Model performances with augmented datasets
Data augmentation did not apparently affect the model performance (), and there was no association between the model performance and levels of dataset augmentation. For a straightforward comparison of model performances before and after data augmentation, averaged F1-socres and accuracies were examined across different augmentation levels. After augmentation (), SVM performance changed only slightly in average accuracies and F1-scores. The performance of the CNN model was not improved with the data augmentation (P = 0.052, 0.072, and 0.831 for 3-, 4-, and 5-fold cross-validation methods, respectively).
Fig. 4 (Colour online) Model performances with the dataset after data augmentation. The k-fold cross-validation method was used to have a comprehensive model evaluation. In each cross-validation scheme, the training datasets were augmented to five levels (120, 320, 519, 719, and 1,119 entries for each level). With the augmented datasets, SVM and CNN models were trained and tested. Their performances were evaluated with prediction accuracy (%) and F1-score for the five levels. (A) Model accuracies for different separation ways and augmentation levels. (B) F1-scores for different separation ways and augmentation levels.
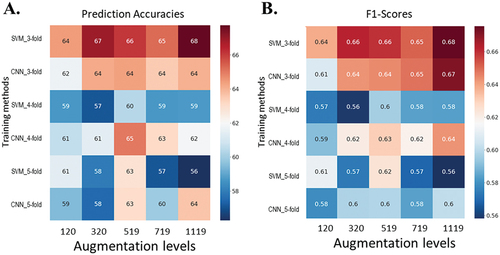
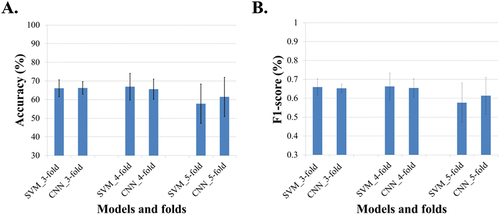
Fig. 5 (Colour online) Averaged model performances across the five augmented datasets. The k-fold cross-validation method was used to have a comprehensive model evaluation. The dataset was divided into 3, 4, and 5 folds. In each separation, the training datasets were augmented to five levels (that is 120, 320, 519, 719, and 1,119 entries for each level). With the augmented datasets, SVM and CNN models were trained and tested. Their performances were evaluated with the averaged prediction accuracy (%) and F1-score for the five levels. (A) prediction accuracies for different models and separation ways. (B) F1-scores for different models and separations.
Evaluating candidate variables contributing to blackleg
Prediction models involved several sets of variables, including weather, insect pests, and crop-rotation history. Using weather data as the basic information, we tested the relative contribution of insect-feeding and crop-rotation variables to the blackleg severity. When flea beetle incidence and root maggot incidence and severity were deleted from the dataset (), SVM and CNN performances, based either on accuracy or F1-score, increased slightly when compared to the analyses using full dataset.
When crop rotation variables were removed from the dataset, the model performance decreased remarkably compared to the models trained with the dataset containing these variables (). The lowered average accuracies and F1-scores indicated the importance of crop rotation history to blackleg.
At the same time, it is intriguing to examine the extent to which individual weather variables contribute to the accuracy and F1-score of the models. To do so, we performed an experiment where each weather variable was individually removed from the dataset, resulting in five different datasets. Subsequently, we trained CNN and SVM models on these modified datasets. We found that, compared to the full dataset, the model performances including accuracy and F1-score did not show an apparent decrease (). Also, the differences among the five models in the perspective of accuracy and F1-score were minor.
Table 4. Analysis of relative contributions of different weather variables.
We further investigated the significance of different growth stages (or earlier/later weather) on the model’s performance. For this purpose, we conducted an experiment in which we removed either earlier (from March 3rd to June 1st) or later (from June 2nd to August 31st) data from the dataset, resulting in two distinct datasets. The results revealed that the SVM performance remained consistent across both stages, while the CNN model exhibited reduced predictive capability when utilizing the later weather variables, as evidenced by lower accuracy and F1-score values (). This suggests that SVM might offer greater robustness than CNN when dealing with smaller datasets, and it also implies that later weather conditions could exert a more significant influence on blackleg disease development.
Table 5. Analysis of relative contribution of early and later growth stages.
Discussion
Blackleg severity can be accurately predicted using weather, insect feeding, and crop-rotation history information
On the prairies, many factors such as weather conditions, farming practices, insect feeding wounds, cultivar resistance, and pathogen population collectively influence the occurrence of blackleg infection (Ghanbarnia et al. Citation2011; Huang et al. Citation2022). In this study, we employed AI models to make predictions about blackleg severity using weather, insect feeding, and crop-rotation variables, achieving high accuracies and precisions. The results showed that these variables contributed significantly to the levels of blackleg disease within commercial canola fields. This aligns with conclusions drawn from prior plot trials (Guo and Fernando Citation2005; Guo et al. Citation2005).
We also conducted assessments to determine the relative significance of insect feeding and crop-rotation concerning blackleg severity. This was accomplished by removing these factors from AI models individually. The results indicated that insect feeding may not be a crucial factor, as the models’ predictive ability actually improved slightly when relevant variables were omitted for analysis. This outcome aligns with similar findings from plot trials, wherein a reduced flea beetle feeding through in-crop insecticide application failed to reduce blackleg severity at crop maturity (Huang et al. Citation2022). However, caution is required in interpreting the data as they were collected from only 116 fields from 2021 and 2022; possible interactions among pathogen inoculum, host resistance, insect feeding wounds, and environments might not have been fully captured. Data from more fields and years across different environmental conditions will be helpful for more robust analysis. In contrast, when rotation variables were removed from the dataset, the model performances were remarkably poorer for both SVM and CNN models (). This finding is consistent with previous plot trials (Guo et al. Citation2005), in which the severity of blackleg was significantly lower when canola was rotated with wheat or flax.
When removing the individual weather factors, the overall model performance in terms of accuracy and F1-score did not exhibit a significant decrease compared to using the full dataset. This suggests that the models are relatively robust to the absence of any single weather variable. Additionally, we observed that the differences in accuracy and F1-score among the five models were relatively minor. These findings imply that the weather variables in our dataset might have a certain level of redundancy or might not individually contribute to the predictive power of the models substantially. It is important to consider that machine learning and deep-learning models often exploit correlations among features, and the impact of removing a single feature can be mitigated by the presence of other correlated features.
AI may help assess additional management practices
Cultivar resistance, R-gene stacking, R-gene rotation, and crop sequence all play a role in influencing the outcome of blackleg disease. However, determining the most effective practice or combination of practices for managing blackleg remains an ongoing question. Data are currently being collected for some of these management practices in real-world commercial fields on the prairies. Integrating these new datasets into an AI model holds potential for enhancing blackleg risk assessment. Results from plot trials, with limited number of entries or variables, may also be used as supplements in the model, although machine learning will be much more powerful in handling huge datasets involving a large number of data entries and multiple variables. In some instances, data augmentation techniques can be employed to expand the dataset size. Utilizing big data allows for more comprehensive analyses and potentially more accurate predictions. Findings from this study emphasize that AI serves as a novel potential tool for assessing additional management practices aimed at mitigating blackleg disease within commercial fields. Traditional statistical approaches may struggle to handle the complexity in some datasets, especially when multiple interacting factors are at play. Machine learning, especially deep learning techniques, can effectively integrate disparate data sources and analyze them cohesively. Although this study only employed three sets of variables, the ability to evaluate the relative significance for each factor and integrate various data sources underscores the value of AI models in comprehensively analyzing complex disease data.
Practical implications
The successful utilization of AI models, fuelled by weather, insect feeding, and crop-rotation variables to predict blackleg severity presents a promising starting point. The results are encouraging for further development of practical tools aimed at enhancing blackleg management strategies within commercial canola fields. The predictive accuracy attained was notably high (reaching up to 70%, as indicated in ), and precision was also noticeable (with F1-score of up to 0.69 as listed in ). This suggests a strong potential for utilizing machine learning and deep learning for disease management decisions
It is important to acknowledge that this analyses, while yielding favourable outcomes, remain in a preliminary stage. The dataset employed encompassed only 116 canola fields (or 121 data entries) surveyed in Alberta during 2021 and 2022. Despite the relatively robust prediction accuracy and precision, there is room for refinement. One potential avenue for improvement involves incorporating multi-year data spanning all prairie provinces. This expansion could potentially identify fields exhibiting a wider spectrum of blackleg severity, enabling the classification of data into more distinct categories for more accurate regional predictions. The current study did not include factors such as variety resistance and pathogen population, which could potentially impact the model’s accuracy. However, the relative resistance level of cultivars in different fields could not be measured as the pathogen population may be different in these fields (Soomro et al. Citation2021). Going forward, pathogen Avr genes may be monitored over crop districts in each province, which may be more useful for defining cultivar resistance levels based on R-gene stacking. It is possible that including the resistance and pathogen virulence factors in AI models can further enhance disease risk assessment.
Author contributions
W.G.D.F., G.P., M.W.H, and R.L. initiated the project. L.Z. performed all the analysis work and wrote the manuscript. M.W.H. collected field data. G.P. and S.W. provided input in manuscript preparation. W.G.D.F. and L.Z. wrote the ms, revised and made corrections.
Acknowledgments
We thank Dr. Michael W. Harding’s lab for collecting the data sets that helped us do the analysis. We thank Ms. Merrit Kennedy and Mr. Greg Daniels for assistance in collecting field data and express our appreciation to cooperating canola producers for providing information and allowing access to their fields.
Disclosure statement
No potential conflict of interest was reported by the author(s).
Data availability statement
All datasets generated for this study are included in the article/Supplementary Material.
Additional information
Funding
References
- Barbetti M. 1975. Effects of temperature on development and progression in rape of crown canker caused by Leptosphaeria maculans. Aust J Exp Agric. 15(76):705–708. doi: 10.1071/EA9750705.
- Biddulph J, Fitt BD, Leech P, Welham S, Gladders P. 1999. Effects of temperature and wetness duration on infection of oilseed rape leaves by ascospores of Leptosphaeria maculans (stem canker). Eur J Plant Pathol. 105(8):769–781. doi: 10.1023/A:1008727530088.
- Canola Council of Canada. 2020. Flea beetles. Canola encyclopedia; [accessed 2022 Mar 31]. https://www.canolacouncil.org/canola-encyclopedia/insects/flea-beetles/.
- Cárcamo H, Otani J, Dosdall L, Blackshaw R, Clayton G, Harker K, O’Donovan J, Entz T. 2008. Effects of seeding date and canola species on seedling damage by flea beetles in three ecoregions. Eur J Plant Pathol. 132(8):623–631. doi: 10.1111/j.1439-0418.2008.01298.x.
- Chi M, Feng R, Bruzzone L. 2008. Classification of hyperspectral remote-sensing data with primal SVM for small-sized training dataset problem. Adv Space Res. 41(11):1793–1799. doi: 10.1016/j.asr.2008.02.012.
- Dosdall LM, Herbut MJ, Cowle NT. 1994. Susceptibilities of species and cultivars of canola and mustard to infestation by root maggots (Delia spp.)(Diptera: Anthomyiidae). Can Entomol. 126(2):251–260. doi: 10.4039/Ent126251-2.
- Fenu G, Malloci FM. 2021. Forecasting plant and crop disease: an explorative study on current algorithms. BDCC. 5(1):2. doi: 10.3390/bdcc5010002.
- Fernando WGD, Zhang X, Selin C, Zou Z, Liban SH, Mclaren DL, Kubinec A, Parks PS, Rashid MH, Padmathilake KRE. 2018. A six-year investigation of the dynamics of avirulence allele profiles, blackleg incidence, and mating type alleles of Leptosphaeria maculans populations associated with canola crops in Manitoba, Canada. Plant Dis. 102(4):790–798. doi: 10.1094/PDIS-05-17-0630-RE.
- Fitt BD, Brun H, Barbetti M, Rimmer S. 2006. World-wide importance of phoma stem canker (Leptosphaeria maculans and L. biglobosa) on oilseed rape (Brassica napus). Eur J Plant Pathol. 114(1):3–15. doi: 10.1007/s10658-005-2233-5.
- Ghanbarnia K, Fernando WGD, Crow G. 2009. Developing rainfall- and temperature-based models to describe infection of canola under field conditions caused by pycnidiospores of Leptosphaeria maculans. Phytopathology. 99(7):879–886. doi: 10.1094/PHYTO-99-7-0879.
- Ghanbarnia K, Fernando WGD, Crow G. 2011. Comparison of disease severity and incidence at different growth stages of naturally infected canola plants under field conditions by pycnidiospores of Phoma lingam as a main source of inoculum. Can J Plant Pathol. 33(3):355–363. doi: 10.1080/07060661.2011.593189.
- Guo X, Fernando WGD. 2005. Seasonal and diurnal patterns of spore dispersal by Leptosphaeria maculans from canola stubble in relation to environmental conditions. Plant Dis. 89(1):97–104. doi: 10.1094/PD-89-0097.
- Guo X, Fernando WGD, Entz M. 2005. Effects of crop rotation and tillage on blackleg disease of canola. Can J Plant Pathol. 27(1):53–57. doi: 10.1080/07060660509507193.
- Hall R. 1992. Epidemiology of blackleg of oilseed rape. Can J Plant Pathol. 14(1):46–55. doi: 10.1080/07060669209500905.
- Hammond KE, Lewis B, Musa T. 1985. A systemic pathway in the infection of oilseed rape plants by Leptosphaeria maculans. Plant Pathol. 34(4):557–565. doi: 10.1111/j.1365-3059.1985.tb01407.x.
- Huang YJ, Fitt BD, Jedryczka M, Dakowska S, West JS, Gladders P, Steed JM, Li ZQ. 2005. Patterns of ascospore release in relation to phoma stem canker epidemiology in England (Leptosphaeria maculans) and Poland (Leptosphaeria biglobosa). Eur J Plant Pathol. 111(3):263–277. doi: 10.1007/s10658-004-4421-0.
- Huang S, Zhai C, Zou Z, Liu F, Parks P, Mcgregor L, Fernando WGD, Peng G. 2022. Effect of wounding and wound age on infection of canola cotyledons by Leptosphaeria maculans, interacting with leaf wetness. Can J Plant Pathol. 44(5):709–722. doi: 10.1080/07060661.2022.2059573.
- Hwang SF, Strelkov SE, Peng G, Ahmed H, Zhou Q, Turnbull G. 2016. Blackleg (Leptosphaeria maculans) severity and yield loss in canola in Alberta, Canada. Plants. 5(3):31. doi: 10.3390/plants5030031.
- Jedryczka M, Kaczmarek J, Dawidziuk A, Brachaczek A. 2008. System for forecasting disease epidemics–aerobiological methods in Polish agriculture. Asp Appl Biol. 89:65–70.
- Khaki S, Wang L, Archontoulis SV. 2020. A CNN-RNN framework for crop yield prediction. Front Plant Sci. 10:1750. doi: 10.3389/fpls.2019.01750.
- Lamb RJ. 1989. Entomology of oilseed Brassica crops. Annu Rev Entomol. 34(1):211–229. doi: 10.1146/annurev.en.34.010189.001235.
- Lô-Pelzer E, Bousset L, Jeuffroy MH, Salam MU, Pinochet X, Boillot M, Aubertot JN. 2010. SIPPOM-WOSR: a simulator for integrated pathogen population management of phoma stem canker on winter oil seed rape: I. description of the model. Field Crops Res. 118(1):73–81. doi: 10.1016/j.fcr.2010.04.007.
- Mcgee D, Emmett R. 1977. Black leg (Leptosphaeria maculans (Desm.) Ces. et de not.) of rapeseed in Victoria: crop losses and factors which affect disease severity. Aust J Agric Res. 28(1):47–51. doi: 10.1071/AR9770047.
- Pasupa K, Sunhem W. 2016. A comparison between shallow and deep architecture classifiers on small dataset. 2016 8th International Conference on Information Technology and Electrical Engineering (ICITEE), Yogyakarta, Indonesia. p. 1–6. doi: 10.1109/ICITEED.2016.7863293.
- Peng G, Liu C, Fernando WGD, Lang R, Mclaren DL, Johnson EN, Kutcher HR, Singh G, Turkington TK, Yu F. 2020. Early fungicide treatment reduces blackleg on canola but yield benefit is realized only on susceptible cultivars under high disease pressure. Can J Plant Pathol. 43(3):384–393. doi: 10.1080/07060661.2020.1824166.
- Petitjean F, Forestier G, Webb GI, Nicholson AE, Chen Y, Keogh E. 2014. Dynamic time warping averaging of time series allows faster and more accurate classification. 2014 IEEE International Conference on Data Mining. p. 470–479. doi: 10.1109/ICDM.2014.27.
- Petitjean F, Forestier G, Webb GI, Nicholson AE, Chen Y, Keogh E. 2016. Faster and more accurate classification of time series by exploiting a novel dynamic time warping averaging algorithm. Knowl Inf Syst. 47(1):1–26. doi: 10.1007/s10115-015-0878-8.
- Petitjean F, Ketterlin A, Gançarski P. 2011. A global averaging method for dynamic time warping, with applications to clustering. Pattern Recognit. 44(3):678–693. doi: 10.1007/s10115-015-0878-8.
- Petrie G. 1994. Effects of temperature and moisture on the number, size and septation of ascospores produced by Leptosphaeria maculans (blackleg) on rapeseed stubble. Can Plant Dis Surv. 74:141–152.
- Poslušná J, Plachka E. 2014. Forecasting system for infection risk of phoma stem canker in selected regions of the Czech Republic in 2009-2011. Plant Prot Sci. 50(1):8–16. doi: 10.17221/84/2012-PPS.
- Skelsey P. 2021. Forecasting risk of crop disease with anomaly detection algorithms. Phytopathology. 111(2):321–332. doi: 10.1094/PHYTO-05-20-0185-R.
- Soomro W, Kutcher R, Yu FQ, Hwang SF, Fernando WGD, Stephen ES, Peng G. 2021. The race structure of Leptosphaeria maculans in western Canada between 2012 and 2014 and its influence on blackleg of canola. Can J Plant Pathol. 43(3):480–493. doi: 10.1080/07060661.2020.1829064.
- Sosnowski M, Scott E, Ramsey M. 2004. Infection of Australian canola cultivars (Brassica napus) by Leptosphaeria maculans is influenced by cultivar and environmental conditions. Austral Plant Pathol. 33(3):401–411. doi: 10.1071/AP04045.
- Toscano‐Underwood C, West JS, Fitt BD, Todd A, Jedryczka M. 2001. Development of phoma lesions on oilseed rape leaves inoculated with ascospores of A‐group or B‐group Leptosphaeria maculans (stem canker) at different temperatures and wetness durations. Plant Pathol. 50(1):28–41. doi: 10.1046/j.1365-3059.2001.00526.x.
- Westdal P, Romanow W. 1972. Observations on the biology of the flea beetle, Phyllotreta cruciferae (Coleoptera: Chrysomelidae). Manitoba Entomologist. 6:35–45.
- Xiao Q, Li W, Chen P, Wang B. 2018. Prediction of crop pests and diseases in cotton by long short term memory network. International Conference on Intelligent Computing, China. p. 11–16. doi: 10.1007/978-3-319-95933-7_2.
- Xiao Q, Li W, Kai Y, Chen P, Zhang J, Wang B. 2019. Occurrence prediction of pests and diseases in cotton on the basis of weather factors by long short term memory network. BMC Bioinformat. 20(S25):1–15. doi: 10.1186/s12859-019-3262-y.
- Xi K, Morrall R, Gugel R, Verma P. 1991. Latent infection in relation to the epidemiology of blackleg of spring rapeseed. Can J Plant Pathol. 13(4):321–331. doi: 10.1080/07060669109500917.
- Zhang L, Zhang Z, Luo Y, Cao J, Tao F. 2019. Combining optical, fluorescence, thermal satellite, and environmental data to predict county-level maize yield in China using machine learning approaches. Remote Sens. 12(1):21. doi: 10.3390/rs12010021.
- Zhong H, Li X, Lobell D, Ermon S, Brandeau ML. 2018. Hierarchical modeling of seed variety yields and decision making for future planting plans. Environ Syst Decis. 38(4):458–470. doi: 10.1007/s10669-018-9695-4.