
 ?Mathematical formulae have been encoded as MathML and are displayed in this HTML version using MathJax in order to improve their display. Uncheck the box to turn MathJax off. This feature requires Javascript. Click on a formula to zoom.
ABSTRACT
Although overall support for wind farms in Australia is strong, the rapid growth in their number and size has led to concerns about their visual impact, as evidenced by organised opposition and litigation. In March 2018, an Australia-wide Internet survey mainly of clubs and councils was conducted which asked respondents to rate the scenic quality of the landscape with and without a wind farm, and also to rate the acceptability or otherwise of the wind farm in scenes with the wind farm. Photographs of wind farms in NSW, Victoria and SA were used. From the response of nearly 800 participants a sample of 556, weighted to be representative of the Australian population, was analysed. While the respondents rated the scenic quality of landscapes with wind farms lower than scenes without them, they rated wind farms acceptable in virtually all landscapes, including high scenic quality coastal scenes. The finding suggests that the community is very tolerant of the visual impact of wind farms. Results are presented for 18 wind farms. This survey is unique in that it not only asked participants to rate the landscape with and without wind farms but it also asked them to rate the acceptability of the wind farm in each scene. To the author’s knowledge, this had not been accomplished previously in Australia.
Introduction
Wind farms have grown rapidly in number over the past few decades, from virtually none in 2000 to 102 by end 2019. Accordingly, the pressure has grown on planners in State and Local Authorities to assess their impacts, consult with their communities, and determine whether or not to approve them together with defining any conditions that might be attached to approvals.
Following a review of the dimensions of wind farms and opinion surveys regarding wind farms, this paper describes a survey of nearly 800 people from across Australia that asked respondents to rate the scenic quality of the landscape with and without a wind farm, and also to rate the acceptability or otherwise of the wind farm in scenes with the wind farm. The results can provide planners with an objective assessment of the likely visual impact and acceptability of wind farms in their localities.
Scale of the issue
In response to Government incentives since 2000, together with the Renewable Energy Target, renewable energy projects have proliferated including domestic photovoltaic, large scale photovoltaic, hydro, bioenergy and extensive wind farms. The electricity produced by wind farms contributed 8.5% of Australia’s electricity in 2019, generating 6,300 MW of electricity (Clean Energy Council Citation2020).
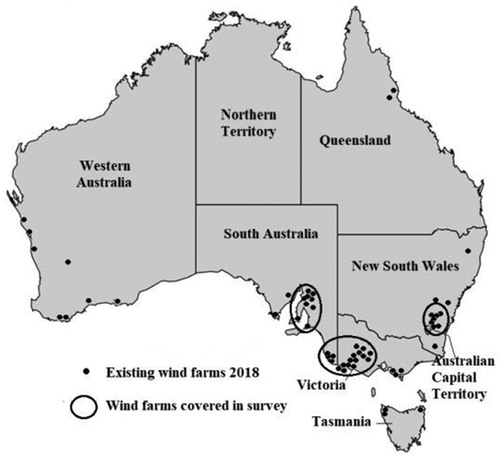
Wind farms are located mainly in southern Australia, where the winds are strongest and most consistent ().
Figure 1. Wind farms in Australia, 2018. Source: Paragon Media, Wind Farm Map of Australia, 2018.
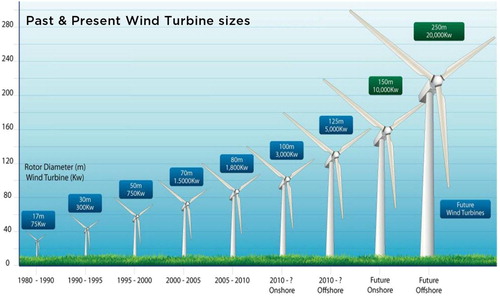
However, it is not just the number of wind turbines that have grown, but also their scale. During the 1990s, wind turbines were less than 50 m in height to the top of the hub with 10–15 m blades. By 2015, turbines had grown to nearly 100-m with 55-m blades. These are very sizeable structures in the landscape, far larger than electricity transmission towers. Overseas, former 50-m turbines are being replaced by 150-m high turbines in a process called repowering ().
Land owners generally enter into a long-term agreement with the wind farm developer – 25 years is common with renewal options. They are paid either $8,000 – $10,000 per year per turbine or an amount dependent on the generating capacity – the modern large turbines result in fewer being installed. As the National Wind Farm Commissioner points out, the land may then be treated as industrial and be no longer exempt from land tax and may be subject to higher council rates.
Over the past forty years, the cost of wind turbines has dropped – in the early 1980s it was 30 cents/kWh and is now 5 c/kWh. A 2 MW turbine costs $3–4 million installed, with approximately 75% of the cost being the turbine and the rest covering its concrete foundation, land rent, grid connection, roads and control systems. Wind farms in south-east Australia have a capacity factor of 30–35%, some as high as 40%. This is the proportion of the year that it would generate electricity. By comparison, the capacity factor for a nuclear power plant is 77%, coal-fired power station 55%, gas-fired power station 45% and solar PV 25%.
Wind energy’s carbon footprint is about 12 grams/kWh compared with 870 for coal and 464 for gas (J.D. Rhodes, University of Texas, Austin’s Energy Institute). The payback time for a wind turbine to cover the energy used in its manufacture and construction is six to eight months (Wind Measurement International).
Figure 2. Growth of wind turbine size. Source: www.ucsusa.org/clean-energy/renewable-energy/.
Attitudes of Australians towards wind farms
Australians appear to have a polarised love-hate relationship with wind farms. In July 2006, Federal Treasurer Peter Costello stated, ‘Well if you are asking me my view on wind farms, I think they are ugly, – … I wouldn’t want one in my own back yard.’ (Hudson Citation2017). A later Federal Treasurer, Joe Hockey, described the wind farm on Lake George near Canberra as ‘utterly offensive, I think they're just a blight on the landscape.’ (ABC.net.au 2 May, 2014).
Surveys of Australians, however, have consistently shown that renewable energy, and wind farms in particular, have overwhelming support. summarises 21 surveys of the community taken over the past decade. The surveys covered a total of 20,500 Australians. The average overall support for wind farms was 75% and 81% for renewable energy. Opposition to wind farms averaged 11% and 6.5% against renewable energy.
Table 1. Community attitude surveys of wind farms, Australia, 2006–2018.
Opponents of wind farms, such as landscape guardian groups, have been surveyed by Hindmarsh (Citation2010) who found strong resentment against ‘outsiders’ sacrificing the local landscape for external electricity users. Hall (Citation2014) reviewed articles in 19 Australian newspapers and found they reported opposition to wind farms far more than articles of support. She found rural communities often had ‘underlying cultural or ideological concerns’ including being politically neglected by urban centres and opposition to a ‘green’ political agenda. Chapman et al. (Citation2013) reviewed complaints about wind farms between 1993 and 2013, a total of 51 wind farms and found no complaints for 33 while 18 had been subject to at least one complaint.
Opposition resulting in litigation has occurred in some instances. Table 3.4 summarises the 17 wind farm cases that have been considered by the courts and only two of these were rejected, one to be later approved in an amended form. Litigation as a weapon of opposition therefore does not appear effective ().
Table 2. Wind farm proposals reviewed by courts.
State and Territory Governments are responsible for approvals in Qld, NSW, ACT, Vic, WA and NT, while local government in SA and Tasmania review applications with provision for State Government involvement. The National Wind Farm Commissioner maintains up-to-date information on the regulation of wind farms in Australia (www.nwfc.gov.au/planning-and-regulation).
In an attempt to address the visual impacts of wind farms, the industry group, Austwind, partnered with the Australian Council of National Trusts in preparing a framework for landscape values assessment – Wind Farms and Landscape Values: A National Assessment Framework (Austwind Citation2007). The framework provided a comprehensive process for assessing, evaluating and managing the visual impacts of wind farms but left it up to the developers to decide the actual technical methods, tools and techniques they would use.
Survey of visual impact and acceptability of wind farms
The survey was conducted as a follow-up on an earlier survey by the author in 2003, before many wind farms had been established (Lothian Citation2008b). That survey assessed the visual impact of hypothetical wind farms in 21 coastal and 47 inland locations of South Australia. Scenes with and without the wind farm were rated by over 300 participants on a 1 (low) – 10 (high) scale. The research determined that wind farms diminished scenic quality in all coastal locations. For inland areas, in areas where the prevailing landscape quality was low (< 5.1), the presence of a wind farm actually enhanced scenic quality through introducing interest in an otherwise flat and barren landscape.
In addition to rating the scenic quality of the landscape, as in the previous survey, the current survey also asked participants to score the acceptability of the wind farm in the particular landscape.
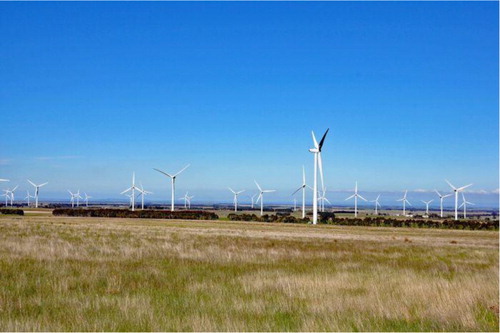
Photographs were taken in August, 2017 of 31 wind farms in SA, Victoria and NSW. From these, 17 wind farms were selected plus an additional ten hypothetical sites on the SA coast, which had been used in the previous survey. The photographs were of horizontal format at 50 mm focal length which approximates the human eye. Being winter, the ground cover was green in all scenes except for some of the coastal scenes which were of summer straw. Survey participants were asked to rate the scenic quality of the scene with and without the wind farm on a ten-point scale (one low, ten high). Nothing in the survey instrument sought to bias the results one way or another. The survey randomised the scenes anew for each participant. For scenes with wind farms, on the same sheet, respondents were also asked to indicate the degree of acceptability of the wind farm in the landscape on a five-point scale: very acceptable, acceptable, neutral, unacceptable, very unacceptable. The survey comprised 49 scenes with wind farms and 49 without, a total of 98 scenes for the survey. Over 800 turbines were shown in the images. The dimensions of the wind farms used in the survey are listed in the Appendix.
Using Survey Monkey (www.surveymonkey.com), the survey was launched on the Internet in March 2018 for 31 days. Invitations to participate were emailed to local government councils in SA, Victoria and NSW and to clubs throughout Australia including outdoor, car, caravanning, gem and mineral clubs, members of whom were considered likely to have seen a wind farm. Internet access for Australian households in 2016/17 was 86% with little difference between rural and city locations (ABS Citation2018).
Nearly 850 people participated in the survey, of these, 69 failed to rate any scenes, leaving a data set of 779 participants. However the survey sample varied substantially from the Australian population so in order that the sample be representative, the data was weighted to reflect the Australian population. The weightings were performed on-line by a Dutch company, Spinnaker Research, which weighted the sample data by all four characteristics. shows the resulting means and standard deviations.
Table 3. Means of unweighted and weighted data.
Findings
In the survey, prior to rating the scenes, participants were asked about their familiarity with wind farms and their attitude towards them (). All but a handful had seen wind farms, 53% had seen a few and 45% had seen many. Nearly 70% were in favour of wind farms and only 7% were against them, similar figures to those from previous Australian surveys. A further 24% were equivocal – ‘it depends’.
Table 4. Familiarity and attitude towards wind farms.
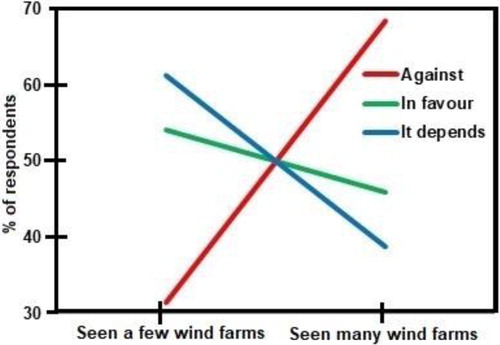
indicates that those against wind farms increased with the number seen, while those in favour fell slightly with increasing numbers seen. Those who said, ‘it depends’ also decreased with greater familiarity. Overall it suggests that support falls with growing numbers of wind farms.
Figure 3. Change of attitude with increased familiarity of wind farms.
compares attitudes by State and Territory and indicates strong support in NSW, Victoria and South Australia, the states with the most wind farms.
Table 5. Wind farm attitude State & Territory (%).
shows the ratings of all scenes with and without the wind farms. In all scenes, the rating of the scene with the wind farm was lower than the landscape scene without the wind farm. The difference was most marked for the ten coastal scenes on the right-hand side of the graph. Ratings of the scenes with and without wind farm were significantly different: t = −10.15, df = 48, p < 0.0000.
Figure 4. Ratings of scenes with and without wind farms.
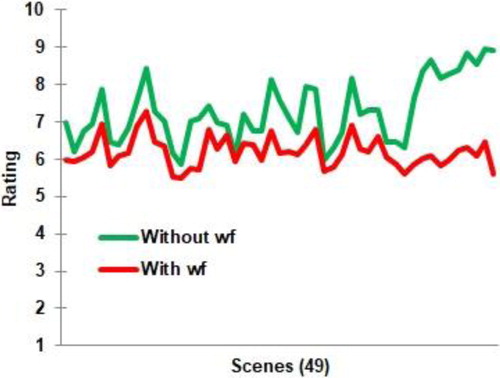
Omitting the ten hypothetical coastal scenes, the mean for scenes without wind farms was 6.99 and with wind farms, 6.22, a difference of 0.77 (including coastal scenes: without wind farm 7.29, with 6.19, difference 1.1).
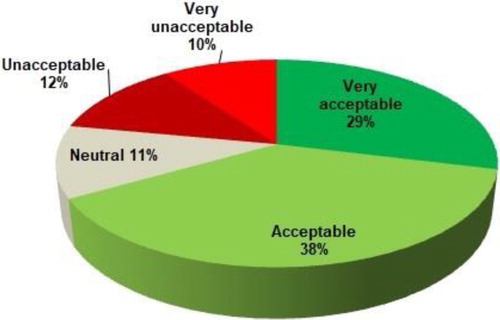
In the survey, the rating of acceptability followed immediately after rating the scenic quality of the landscape. The majority of respondents found them acceptable or very acceptable (). What was particularly surprising was that this applied to virtually all scenes including those of high scenic quality, in other words, regardless of the scenic quality of the landscape, participants generally considered the wind farms acceptable, including in virtually all high-quality coastal landscapes.
Figure 5. Acceptability of all wind farms.
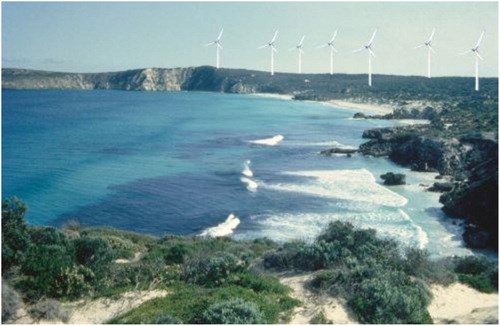
The only scene in which wind farms were considered unacceptable was scene 97 of Pennington Bay on Kangaroo Island in which 60.6% of participants found the wind farm unacceptable or very unacceptable compared with 35.6% who found it acceptable or even very acceptable.
Interestingly, (without the wind farm) was the top-rated coastal scene in the author’s 2005 Coastal Viewscapes project of coastal landscapes in South Australia (Lothian Citation2005).
Figure 6. Pennington Bay, Kangaroo Island with hypothetical wind farm.
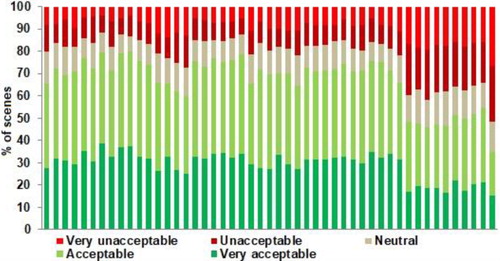
shows the acceptability ratings for all 49 scenes. Pennington Bay is the final scene on the right-hand side.
Figure 7. Acceptability of wind farms by scene.
Most wind farms were represented in the survey by more than one scene and provides the average acceptability rating for each wind farm in the three States and summarises the ratings for each State.
Figure 8. Average ratings by State.
Note: Excludes ten coastal scenes in SA.
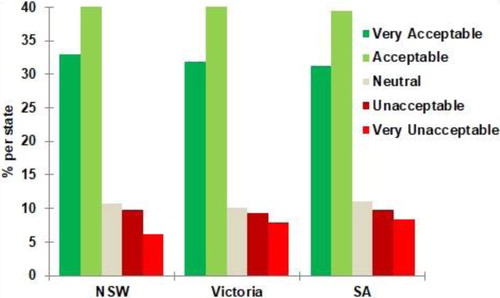
Table 6 Percent acceptability rating of wind farms by State.
The influence of various factors on the ratings was examined using multiple regression analysis. For the scenes with wind farms, it found the following:
The presence of dense vegetation increased ratings by 0.39.
The hillier the land, the higher the ratings, by 0.22 for scenes comparing flat land with hilly land.
Ratings decreased slightly with an increasing number of turbines, increasing the number from 10 to 50 reduced scenic quality ratings by only 0.20.
Placing turbines linearly along ridges increased ratings by 0.26 compared with random layouts.
The height of turbines had virtually no influence on ratings; increasing the height from 100 to 150 m actually increased ratings by 0.19.
The highest ratings were for the largest turbines; increasing them from 1.5 to 3 MW lifted ratings by 0.10.
With greater distance to the turbines, ratings increased by 0.37 at mid-distance compared with those nearby, and by 0.42 for the distant turbines.
These suggest that people prefer a smaller number of turbines and for turbines to be placed in an orderly arrangement such as linearly rather than in random layouts. Their height and generating capacity had little influence on scenic quality ratings. Both height and number are highly visible attributes, whereas only specialists would discern the difference in the size of the generators.
Assessing the influence of the height, number and generating capacity of wind turbines on their acceptability is somewhat more complex. Unlike scenic quality for which a single integer between one and ten was available, acceptability was judged by participants on a five-point Likert scale: very acceptable, acceptable, neutral, unacceptable, very unacceptable. A single integer can be derived, however, using the following algorithm:Thus, the sum of the unacceptable and very unacceptable ratings was subtracted from the sum of the very acceptable and acceptable ratings. It is assumed here that very acceptable is twice a good as acceptable, and the same for very unacceptable compared with unacceptable. The figure could be much greater or lesser, but in the absence of contrary knowledge, twice is adopted.
Example: Scene 29, Mt Mercer wind farm (Victoria) ().
Figure 9. Mt Mercer wind farm.
Very acceptable 139, acceptable 185, neutral 67, unacceptable 70, very unacceptable 61.
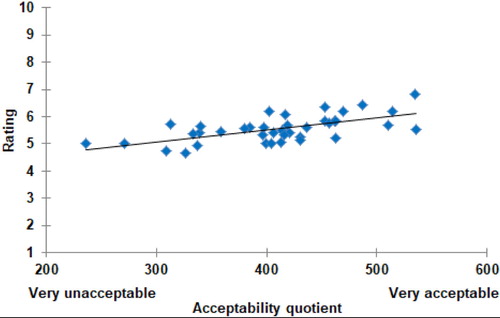
compares the acceptability score with the scenic quality rating of the landscape. The bulk of wind farms appear at the acceptable end of the scale. Curiously the trend suggests that the higher the scenic quality rating, the greater their acceptability, which is counterintuitive. It was expected that the acceptability would decline in higher quality landscapes. However, the results indicate that despite rating the scenic quality as high, participants found the wind farm acceptable.
Figure 10. Acceptability scores vs ratings (excluding coastal scenes). Trend line: y = 0.0044x + 3.77, R2 = 0.39.
Discussion
The results of this survey support the findings of opinion polls over the past decade or so that the community is very tolerant of wind farms. The unique finding of this survey was that this support exists even in reasonably high scenic quality landscapes. Protests about wind farm proposals are more likely to be about their intrusion into a rural community, their possible effects on land values, concerns about noise and impacts on wildlife.
Many comments from participants in the survey related to clean energy and wind farms being an alternative to coal which fulfils Hall, Ashworth, and Shaw (Citation2012) finding that the community view wind farms as a means of taking action against climate change by reducing greenhouse gas emissions.
The wind farm industry may be commended that in their development of wind farms they have achieved such strong community endorsement. Providing information days and tours of wind farms has communicated well with the public. Over time, the community’s concerns have been alleviated by seeing wind farms and finding them acceptable.
Participants preferred a smaller number of turbines than a large number, and for turbines to be arranged in an orderly arrangement rather than scattered randomly.
For local and state governments regulating the industry the findings suggest that while care needs to be taken with the layout, number and appearance of wind farms, and proponents need to meet all conditions of approval, the public is far more tolerant of the presence of turbines than governments might assume. This does not mean that the regulatory requirements should be relaxed; indeed, the current good standing of wind farms may be partly attributed to the care with which governments have regulated the industry.
From a community viewpoint, the findings should not cause dismay, except for those implacably opposed to wind farms – the comments provided in the survey indicate that opponents participated. There are always some for whom every wind farm must be opposed. For those who might find a wind farm being proposed in their vicinity, the findings suggest that resorting to public opinion or litigation may not be their best courses of action. Rather they should seek to work with the developer and government in reaching outcomes which minimise the adverse impacts.
The author’s focus lies with the Australian landscape. If the findings are seen as providing carte blanche to site wind farms in high quality landscapes, then this will be disastrous and may well turn the public against the industry. The challenge for spatial planners is to ensure that wind farms are located in areas without significant visual or other impacts. Early discussions between developers and planners are essential for this to be achieved. With rural communities often desperate for the employment that wind farms can provide over the long term, achieving an optimal balance between the environment, the economy and the local community can be very challenging.
The industry should concentrate wind farms in the lower quality landscapes – the flat land devoid of tree cover, or low ridges with trees or low-lying coastal areas. Australia has large areas of such suitable land with good wind resources.
Conclusion
A survey of more than 550 participants in Australia found that while participants rated wind farms as impacting the scenic quality of landscapes in which they were located, this visual impact was acceptable in virtually all cases. Given the high level of support for wind farms that the Australian community has expressed through opinion surveys, the finding is perhaps not surprising. The balancing between achieving low emissions green energy and protecting landscape quality is weighed towards the former.
While protests against wind farms by affected communities and landowners are likely to continue, it is hoped that the finding of this survey may enable Australians to reach solutions that are agreeable and beneficial to the entire community.
Disclosure statement
No potential conflict of interest was reported by the author(s).
References
- ABS (Australian Bureau of Statistics). 2018. Household Use of Information Technology, Australia, 2016-17. 8146.0.
- Anon. 2018. “South Australian Energy Poll Says We should Follow their Lead on Solar and Battery Storage.” Energy Matters. Commissioned by Climate Council.
- Ashworth, P. N., A. Pisarski, and A. Littleboy. 2006. Understanding and Incorporating Stakeholder Perspectives to Low Emission Technologies in Queensland. Brisbane: CSIRO.
- Australia Institute. 2014-2017. Surveys quoted by https://ramblingsdc.net/Australia/WindPower.html#Wind_power_in_Australia.
- Australia Institute. 2017. “Polling Brief - Renewable Energy March 2017”.
- Auswind. 2007. Wind Farms and Landscape Values: A National Assessment Framework. Perth: Australian Council of National Trusts.
- AWE (Australia Wind Energy). 2003. “Focus on Public Opinion – A Summary of Opinion Surveys on Wind Power”.
- Bird, D. K., K. Haynes, R. van den Honert, J. McAneneya, and W. Poortingab. 2014. “Nuclear Power in Australia: A Comparative Analysis of Public Opinion Regarding Climate Change and the Fukushima Disaster.” Energy Policy 65: 644–653. doi:10.1016/j.enpol.2013.09.047.
- Bond, S. 2008. “Attitudes Towards the Development of Wind Farms in Australia.” Environmental Health 8 (3): 19–32.
- Chapman, S., A. St George, K. Waller, and V. Cakic. 2013. “The Pattern of Complaints About Australian Wind Farms Does not Match the Establishment and Distribution of Turbines: Support for the Psychogenic, “Communicated Disease” Hypothesis.” PLoS ONE 8 (10): 1–11. doi:10.1371/journal.pone.0076584.
- Clean Energy Council. 2020. Clean Energy Australia Report 2020.
- Dalton, G. J., D. A. Lockington, and T. E. Baldock. 2008. “A Survey of Tourist Attitudes to Renewable Energy Supply in Australian Hotel Accommodation.” Renewable Energy 33 (10): 2174–2185. doi:10.1016/j.renene.2007.12.016.
- Global Market Insite. 2007. First Annual World Environment Review Poll Reveals Countries Want Governments to Take Strong Action on Climate Change Archived, 5 June 2007.
- Hall, N. 2014. “Can the “Social Licence to Operate” Concept Enhance Engagement and Increase Acceptance of Renewable Energy? A Case Study of Wind Farms in Australia.” Social Epistemology 28 (3-4): 219–238. doi:10.1080/02691728.2014.922636.
- Hall, N., P. Ashworth, and H. Shaw. 2012. Acceptance of Rural Wind Farms in Australia: A Snapshot. Canberra: CSIRO.
- Hindmarsh, R. 2010. “Wind Farms and Community Engagement in Australia: A Critical Analysis for Policy Learning.” East Asian Science, Technology & Society 4: 541–563. doi:10.1215/s12280-010-9155-9.
- Hobman, E., P. Ashworth, P. Graham, and J. Hayward. 2012. The Australian Public’s Preferences for Energy Sources and Related Technologies. Canberra: CSIRO.
- Hudson, M. 2017. “Wind Beneath Their Contempt: Why Australian Policymakers Oppose Solar and Wind Energy.” Energy Research & Social Sciences 28: 11–16. doi: 10.1016/j.erss.2017.03.014
- Lothian, A. 2005. Coastal Viewscapes of South Australia. Report for the Coast Protection Branch, SA Dept for Env. & Heritage.
- Lothian, A. 2008a. “Scenic Perceptions of the Visual Effects of Wind Farms on South Australian Landscapes.” Geographical Research 46 (2): 196–207. doi:10.1111/j.1745-5871.2008.00510.x.
- Lothian, A. 2008b. “Visual Impact Assessment of Some Developments in South Australia.” Australian Planner 45 (4): 35–41. doi: 10.1080/07293682.2008.10753389
- Moss, J., A. Coram, and G. Blashki. 2014. Wind Energy, Climate and Health. Evidence for the Impacts of Wind Generated Energy in Australia. Canberra: Australia Institute.
- NSW Department of Env, Climate Change & Water. 2010. Community Attitudes to Renewable Energy in NSW.
- NSW Office of Env. & Heritage. 2015. Community Attitudes to Renewable Energy in NSW.
Appendix
Wind farms photographed in New South Wales, Victoria and South Australia, 2017.