
 ?Mathematical formulae have been encoded as MathML and are displayed in this HTML version using MathJax in order to improve their display. Uncheck the box to turn MathJax off. This feature requires Javascript. Click on a formula to zoom.
Abstract
The big data paradox is a real-world phenomenon whereby as the number of patients enrolled in a study increases, the probability that the confidence intervals from that study will include the truth decreases. This occurs in both observational and experimental studies, including randomized clinical trials, and should always be considered when clinicians are interpreting research data. Furthermore, as data quantity continues to increase in today’s era of big data, the paradox is becoming more pernicious. Herein, I consider three mechanisms that underlie this paradox, as well as three potential strategies to mitigate it: (1) improving data quality; (2) anticipating and modeling patient heterogeneity; (3) including the systematic error, not just the variance, in the estimation of error intervals.
Introduction
Counterintuitively, as the size of a study increases, the probability that its confidence intervals will include the truth decreases (Citation1). Thus, studies with large sample sizes can yield misleadingly narrow confidence intervals around heavily biased results. Because large quantities of data are now available to researchers, this phenomenon has been labeled the “big data paradox” and is a major culprit behind the unreliable predictions made from the 2016 United States general election polling datasets (Citation2), Google Flu Trends (Citation3), and Delphi–Facebook, i.e. the largest public health survey ever conducted in the United States to date (Citation4). All study types, including randomized controlled trials (RCTs) are susceptible to this paradox (Citation5). We therefore need to understand why it occurs and how to best address it when interpreting research studies.
The map is not the territory
A key concept behind the big data paradox was introduced in the early twentieth century by the Polish American scientist and philosopher Alfred Korzybski who noted that “the map is not the territory” (Citation6). This means that all abstract models (“maps”) derived from an objective truth (the “territory”) are not the truth itself. We should thus not confuse our models of reality with reality itself. In theory, one may counterargue that as our models become progressively more elaborate, we will one day perfectly represent reality. The Argentinian writer Jorge Luis Borges explained in his one-paragraph short story “On Exactitude in Science” why our models can never perfectly encapsulate the truth (Citation7). He described an Empire whose cartographers were able to make a perfect map that was an exact duplicate in size and complexity of the Empire itself. The map was too cumbersome for any practical use and was immediately abandoned. This story illustrates why our models cannot, and should not, perfectly mirror the underlying reality. The perfect map reproducing precisely every detail of the territory would be as large and complex as the territory itself, down to every atom, which is physically impossible. But even if we could create such flawlessly complete maps, the purpose of maps is not to be perfectly precise but rather to help users navigate a terrain. For example, a map that is small enough to be portable will be more useful to a traveler than a perfectly scaled map of the same size as the terrain. Modern technology does allow users to carry highly detailed digital maps capable of quickly changing scales. However, depending on the task at hand, users will change the scale, resolution, and representations provided by the digital map to focus on specific points of interest such as major road arteries or COVID-19 prevalence. Similarly, scientists devise models of the world that accurately describe a system at a given resolution, but then revise these models to describe properties existing at different resolutions (Citation8,Citation9). For example, tobacco smoking should be included as a cause of lung cancer at the population level but can be omitted at the resolution of a single individual patient with lung cancer who has never been exposed to tobacco (Citation10).
The map-terrain analogy parallels the way we tailor how statistical models may represent the underlying reality based on the task at hand. For explanatory tasks, statistical models are specifically designed to test causal hypotheses when applied to data (Citation11,Citation12). Such models are developed based on our theories about the aspects of the underlying reality (the terrain) that we are interested in explaining. For example, the regression model used for the analysis of an RCT dataset may include an interaction term to test the hypothesis that a biological biomarker influences the treatment effect at the hazard ratio scale. This was the approach used to identify a treatment interaction signal between the degree of HER2 overexpression and trastuzumab efficacy in patients with HER2 positive breast cancer (Citation13). For predictive tasks, we are instead interested in mapping certain inputs, such as the prostate-specific antigen levels of a patient, to specific outputs such as the probability that the patient has prostate cancer. Statistical models used for prediction can range from elementary calculations to supervised learning algorithms, such as neural networks, that do not need to provide directly interpretable information on the underlying relationship (the terrain) between the inputs and the outputs (Citation11,Citation12,Citation14).
Borges’s story also powerfully illustrates why our models should balance complexity with simplicity (also known as parsimony). This balancing act was summarized in G. E. P. Box’s famous quote “All models are wrong, but some are useful,” which dictates that our statistical models should contain sufficient complexity to properly represent the underlying reality, and at the same time be parsimonious enough to be useful for the task at hand (Citation15). The models will always be wrong because there will always exist some distance between the underlying truth beyond our senses and our model of the truth. This distance between the truth and our model of the truth that occurs due to constraints and other assumptions imposed by our statistical model is called “bias” or “systematic error.”
Bias-variance trade-off
Patients analyzed by highly parsimonious statistical models are considered interchangeable with each other. Thus, large numbers of patients can be included, resulting in low variance (low “random error”) of the estimates produced by such models. Conversely, more complex models will have lower bias (lower “systematic error”) but also higher variance because the effective sample size is reduced (Citation16). For example, an RCT may enroll an ethnically and racially diverse cohort of men and women to determine the relative treatment effect at the hazard ratio (HR) scale of one treatment versus another (). A parsimonious model will estimate one HR with lower variance, because it used the entire cohort, and have higher bias, because it does not account for how the HR varies by sex or race/ethnicity (). Conversely, a more complex model that estimates a different HR depending on each patient’s sex and race/ethnicity will have lower bias but higher variance because each estimated HR will have a lower effective sample size available (). The optimal level of complexity of a statistical model balances this trade-off between bias and variance. In clinical practice, the bias-variance trade-off can be reframed as the patient relevance-robustness tradeoff, which recasts bias and variance into terms that are intuitively applicable to patient-centered inferences (Citation17). Lower bias in our statistical models results in higher patient relevance, whereas lower variance yields higher robustness of our inferences (). Conceptually, variance exists only because statistical models omit to include biases that are present at different resolution levels. In this sense, the concept of bias may be more fundamental than pure variance, which can only exist at the infinite resolution level (Citation17).
Figure 1. The bias-variance trade-off in randomized controlled trials (RCTs). The trial and model are designed based on prior knowledge, which informs the choice of the statistical test to be used, the variables to be included in the model, and whether or not to focus on parsimony or account for anticipated patient heterogeneity. For Bayesian models, prior probabilities are also needed. Once the RCT is activated, it may enroll a diverse patient population. The final data may then be analyzed using either a parsimonious (A) or a more complex (B) statistical model that accounts for patient heterogeneity. (A) In the first scenario, all of the enrolled patients are used to estimate one parameter for the relative treatment effect measured at the HR scale. The estimated HR will have higher bias (higher systematic error) because it assumes the heterogeneous enrolled patient population to be homogeneous, but lower variance (lower random error) because it uses every enrolled patient. (B) In the second scenario, the more complex model generates multiple HRs that take into account the diverse subgroups of patients enrolled, thus resulting in lower bias (lower systematic error). However, each estimated HR is based on a lower effective sample size, resulting in higher variance (higher random error). Figure adapted from images created with BioRender.com.
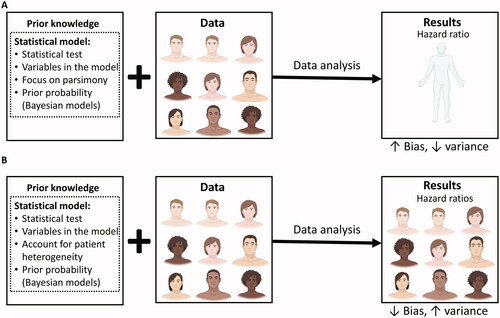
Table 1. Glossary of key terms.
There are clear parallels between the bias-variance trade-off and the balance between the complexity and usefulness of a map representing a terrain, described above. This is because low variance means that our measurements are closer to each other, thus increasing the ability of an estimated parameter, such as an HR, to reliably predict the future outcomes of patients treated with one therapy versus another. Therefore, estimated HRs with lower variance will be more useful for clinical practice than those with high variance. The relationship between the variance and bias of an estimated parameter, such as an HR, can be expressed by the equation:
(1)
(1)
The square root of the mean squared error is known as the “reducible error” or the “root-mean-square error” (RMSE) of the estimated parameter, whereas the square root of the variance is known as the “standard error.” The confidence intervals (CIs) for estimated parameters such as the HR are functions of the standard error. More specifically, the standard error is equivalent to the 68.27% CI, whereas the commonly used 95% CI is equivalent to 1.96 × standard error. Therefore, as the standard error decreases, the CIs around an estimated parameter will become more narrower (Citation18,Citation19). EquationEquation (1)(1)
(1) can be rewritten as a Pythagorean sum-of-squares relation:
(2)
(2)
The RMSE (reducible error), systematic error (bias), and standard error used in Equationequation (2)(2)
(2) are all estimated using the same units as the parameter of interest. They can therefore be used to generate intuitive error intervals for the reducible error that represent our uncertainty regarding the true value of the parameter of interest more accurately than traditional CIs. A key task during data analysis is to determine the optimal statistical modeling strategy that minimizes the reducible error by decreasing the standard error without strongly increasing the systematic error (Citation20,Citation21). Furthermore, other metrics, such as the mean absolute error, may be used instead of the RMSE to represent the reducible error (Citation19,Citation20,Citation22). The advantage of RMSE is that it considers larger deviations from the truth as worse than smaller deviations, and it is easy to interpret because it uses the same unit scale as the parameter of interest.
In addition to the reducible error that can be estimated by the data using the RMSE metric, there exists an “irreducible error” in measuring the parameter of interest that is caused by unknown elements not represented within the dataset (20). For example, an unmeasured biomarker may influence the HR in some patient subsets, or unidentified data quality issues, such as poor data curation and integration across multiple treatment centers, may increase the noise in our measurements. Thus, the total error in our estimate of a parameter will be the sum of both the reducible and the irreducible errors:
(3)
(3)
The big data paradox
All else being equal, the standard error will decrease and the CIs will narrow as the sample size of a study increases (Citation2,Citation5,Citation18,Citation19,Citation23). The big data paradox can emerge because, as the CIs become narrower, the probability that they will include the truth decreases (). The wide CIs of a small RCT may include the true value of the parameter of interest and properly reflect the uncertainty in its estimation (). The practical disadvantage of small studies with wide CIs is that the parameter values included within these intervals may be widely divergent and thus not useful in clinical practice. For example, the data from a small RCT that yielded an HR of 0.72 with a 95% CI of 0.23–2.20 are statistically compatible at the 0.95 level with a very strong effect size (HR = 0.23) favoring the new treatment over the control and a very strong effect size (HR = 2.20) favoring the control over the new treatment. These inconclusive results cannot inform clinical practice even if the true parameter value is included within these CIs.
Figure 2. The big data paradox. (A) Our target is the underlying true parameter, but its complexity can never be perfectly modeled (B) Therefore, there will always be some distance between our models of the true parameter and the true parameter itself. This distance is the sum of the bias (blue line) due to constraints and other assumptions imposed by the statistical model, and of the irreducible error (brown line) due to unknown elements that are not represented within the dataset. (C) When the sample size of a study is small, then the variance is large, yielding wide confidence intervals around the estimated parameter that are more likely to include the true parameter value. (D) If the same study has a larger sample size, then the reduced variance will yield more narrow confidence intervals that are less likely to include the true parameter.
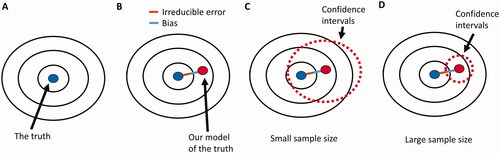
Figure 3. Potential causes of the big data paradox in an RCT. (A) when the sample size of the RCT is small, the corresponding wide CIs may include the true parameter of interest, e.g. the true HR for the relative treatment effect of one treatment versus another. (B) As the sample size of the RCT increases, the quality of the gathered data may decrease, resulting in increased irreducible error within the dataset even if the enrolled patient cohort was highly homogeneous and the statistical model bias remains the same. This can be addressed by maintaining high data quality throughout the study. (C) As the sample size of the RCT increases, the heterogeneity of the patient cohort may also increase, resulting in both increased bias and increased irreducible error, even if the data quality remains consistently high throughout the study. This can be addressed by both anticipating and modeling patient heterogeneity in the estimation of the HR. (D) As the sample size of the RCT increases, the reducible error of the estimated parameter is dominated by the systematic error (bias) and is not properly represented by CIs that are a function of the standard error (variance). This occurs even if the enrolled patient cohort is highly homogeneous and data quality remains consistently high throughout the study. It can be addressed via the use of error intervals that represent the reducible error due to both systematic and standard error.
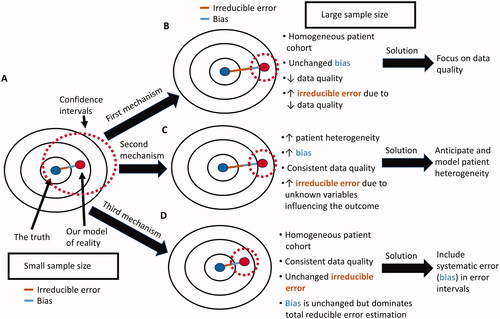
There is therefore good rationale for increasing the sample size and thereby reducing the variance of RCT estimates. Large studies, however, are susceptible to the big data paradox. In real-world applications, such as RCTs, there are three major nonmutually exclusive mechanisms behind this paradox (). The first is due to the decreased data quality that can occur as more patients enroll in a study (). Multicenter RCTs conducted across diverse institutions, regions, and continents for long time periods are particularly susceptible to this mechanism. It can be addressed by placing more emphasis on data quality rather than focusing solely on data quantity (Citation2,Citation4,Citation24). Data quality is also important in the analysis of large real-world prospective or retrospective observational studies, which may be more prone than RCTs to errors in data collection (Citation25). Data quality can be improved by explicitly providing more details on the origins of the data used in the analysis, including the steps involved in data selection, pre-processing, curation, and provenance (Citation24). In his recent overview on enhancing data quality, Meng (24) termed this quality inspection process “data minding,” and its transparent reporting “data confession.” For example, it can be disclosed that a baseline variable obtained from a complete blood count such as the neutrophil-to-lymphocyte ratio was used as a proxy for more direct measurement of systemic inflammatory markers because it is an easily accessible and affordable metric that can easily be adopted in clinical practice (Citation26,Citation27).
The second mechanism through which the big data paradox can occur is via increasing patient heterogeneity as more patients are enrolled in a trial (). The sources of this heterogeneity can be either measured within the dataset or unmeasured. Measured patient heterogeneity increases bias because the parameter of interest may vary depending on the diverse attributes of each patient. In addition, heterogeneous patient cohorts are more likely to harbor unmeasured attributes such as unknown biomarkers that can influence parameter estimation thus increasing the irreducible error. The measured and unmeasured effects of increasing patient heterogeneity can be mitigated by carefully anticipating and measuring sources of potential irreducible error prior and during data collection, and by increasing the statistical model flexibility to account for measured patient heterogeneity thus reducing model bias (Citation23,Citation24,Citation28–30). The shrinkage yielded by multilevel modeling, such as Empirical Bayes techniques, typically provides the optimal balance between bias and variance by reducing the RMSE more than other modeling approaches (Citation17,Citation19,Citation31). Thus, multilevel (also known as “hierarchical”) modeling is a reliable strategy to account for the measured patient heterogeneity introduced by increasing sample sizes (Citation32,Citation33). This is because multilevel models provide a coherent framework to investigate for signals in the data while maximizing the use of information across multiple resolultions (levels) thus minimizing artifacts from random noise (Citation34). Multilevel models contain multiple levels within a nested hierarchy allowing the borrowing of information across the various subsets (Citation35). For example, a prognostic risk model for renal cell carcinoma developed using patients from medical centers in the United States may be a subset of a larger multilevel model which contains patients from medical centers in Canada, Europe, and Asia. These subsets may themselves contains groups defined by country, or deeper levels such as treatment center. The full model (superset) can borrow information across subsets to distinguish contrasts and commonalities thus providing superior estimates of the prognostic effects of each variable of interest. In the clinical trial setting, the ideal scenario would be to conduct small RCTs tailored to specific attributes of a very homogeneous patient cohort. Each of these trials would be nested within a multilevel model that allows the borrowing of information across trials and patient subsets (Citation32).
Careful anticipation and statistical modeling of patient heterogeneity and other sources of structural causal bias introduced by increasing sample sizes is also crucial during the analysis of large, real-world observational datasets (Citation19,Citation36–38). Structural causal biases are sources of systematic (measured) and irreducible (unmeasured) errors that can be represented by causal diagrams (Citation36,Citation37,Citation39–43). A prior commentary detailed how causal diagrams can help interrogate structural causal biases in a hypothetical RCT testing the efficacy of erlotinib, an epidermal growth factor receptor (EGFR) inhibitor, compared with control chemotherapy in patients with non-small cell lung cancer (NSCLC) (Citation42). Only NSCLC tumors that harbor specific oncogenic EGFR gene mutations are driven by the EGFR pathway and are thus affected by erlotinib (Citation44). If the RCT does not collect any information on the EGFR mutation status of the NSCLC tumors for each patient treated on the trial, then the treatment effect heterogeneity introduced by such differences in EGFR mutation status between patients will be perceived as irreducible noise. Conversely, if the EGFR mutation status is determined for each patient, then the final dataset can be used to properly model the effect of this biomarker on the RCT outcome. In some scenarios, however, strong sources of heterogeneity will remain unknown and thus unmeasured. For this reason, it is prudent to carefully collect correlative blood and tissue samples from patients enrolled on RCTs and other prospective clinical studies. These biospecimens can then be used for fundamental basic and translational research to discover previously unknown sources of treatment effect heterogeneity and accordingly guide the rational design of subsequent clinical trials (Citation45).
The last mechanism of the big data paradox occurs even when the additional patients enrolled do not increase the bias or the irreducible error of the RCT (). As the sample size of the RCT increases, the standard error shrinks, and the total error of the estimated parameter is mainly due to irreducible error and systematic error (bias). Because CIs are a function of the standard error and not of the total error, they will become misleadingly narrow, instilling a false sense of confidence regarding the accuracy of the estimated parameter. It has accordingly been suggested to replace the term “confidence” in CIs with the more modest label “compatibility intervals” (Citation46). Furthermore, the big data paradox that occurs via this mechanism can be addressed by replacing the traditional calculation of CIs with error intervals that represent the reducible error that can occur due to both systematic and standard error. The current approach of focusing only on the standard error implies that this error is more costly than systematic error. However, high systematic error can lead to perniciously false inferences and unreliable predictions even when standard error is low (Citation2–4). Error intervals that are based on reducible error metrics, such as the RMSE, will more properly consider systematic and standard errors to be similarly costly. For example, prediction intervals, which can be defined as the intervals between ±2 × RMSE (Citation47,Citation48), incorporate both systematic and random error. Thus, whereas confidence intervals narrow in inverse proportion to the square root of the effective sample size, the width of the prediction intervals will remain virtually unaffected (Citation49). But even after accounting for all reducible error in the data, we should maintain epistemic humility because there will always exist some degree of irreducible error that cannot be quantified and accurately represented by error intervals.
Conclusions
In summary, the big data paradox is becoming an increasingly common challenge due to the larger scale of contemporary research. Experimental studies such as RCTs are not immune to this paradox, and efforts should be made to mitigate it via three different strategies: (1) greater focus on data quality; (2) more flexible statistical modeling that anticipates and accounts for the increased heterogeneity of larger patient cohorts; (3) replacement of CIs with intervals that represent both the systematic and standard errors.
Acknowledgements
The author thank Drs Bora Lim (Associate Professor, Baylor College of Medicine, Houston, TX, USA) and Christopher Logothetis (Professor, The University of Texas MD Anderson Cancer Center, Houston, TX, USA) for helpful conversations, as well as Sarah Townsend (Senior Technical Writer; Department of Genitourinary Medical Oncology, The University of Texas MD Anderson Cancer Center, Houston, TX, USA) for editorial assistance.
Disclosure statement
Pavlos Msaouel reports honoraria for scientific advisory boards membership for Mirati Therapeutics, Bristol Myers Squibb, and Exelixis; consulting fees from Axiom Healthcare; non-branded educational programs supported by Exelixis and Pfizer; leadership or fiduciary roles as a Medical Steering Committee member for the Kidney Cancer Association and a Kidney Cancer Scientific Advisory Board member for KCCure; and research funding from Takeda, Bristol Myers Squibb, Mirati Therapeutics, and Gateway for Cancer Research.
Additional information
Funding
References
- Rothman KJ. Epidemiology: an introduction. 2nd ed. OUP: Oxford; 2012. p. 280.
- Meng X-L. Statistical paradises and paradoxes in big data (I): law of large populations, big data paradox, and the 2016 US presidential election. Ann Appl Stat. 2018;12(2):685–726. doi:https://doi.org/10.1214/18-AOAS1161SF.
- Lazer D, Kennedy R, King G, Vespignani A. Big data. The parable of Google Flu: traps in big data analysis. Science. 2014;343(6176):1203–1205. doi:https://doi.org/10.1126/science.1248506.
- Bradley VC, Kuriwaki S, Isakov M, Sejdinovic D, Meng X-L, Flaxman S, et al. Unrepresentative big surveys significantly overestimated US vaccine uptake. Nature. 2021;600(7890):695–700. doi:https://doi.org/10.1038/s41586-021-04198-4.
- Senn S. Empirical studies of balance do not justify a requirement for 1,000 patients per trial. J Clin Epidemiol. 2022; doi:https://doi.org/10.1016/j.jclinepi.2022.02.010.
- Korzybski A. Science and sanity: an introduction to non-Aristotelian systems and general semantics. Vol. 44. Lakeville (CN): International Non-Aristotelian Library Pub. Co. Distributed by Institute of General Semantics; 1935.
- Borges JL. A universal history of infamy. 1st ed. New York (NY): Dutton; 1972.
- Kim J. Events as property exemplifications. In: Brand M, Walton D, editors. Action theory. Dordrecht: Reidel; 1976. p. 310–326.
- Quine WV. Events and reification. In: Lepore E, McLaughlin B, editors. Actions and events: perspectives on the philosophy of Davidson. Oxford (UK): Blackwell; 1985. p. 162–171.
- Rothman KJ, Greenland S. Causation and causal inference in epidemiology. Am J Public Health. 2005;95(Suppl 1):S144–S150. doi:https://doi.org/10.2105/AJPH.2004.059204.
- Shmueli G. To explain or to predict? Statist Sci. 2010;25(3):289–310. doi:https://doi.org/10.1214/10-STS330.
- Efron B. Prediction, estimation, and attribution. J Am Stat Assoc. 2020;115(530):636–655. doi:https://doi.org/10.1080/01621459.2020.1762613.
- Eisenhauer EA. From the molecule to the clinic-inhibiting HER2 to treat breast cancer. N Engl J Med. 2001;344(11):841–842. doi:https://doi.org/10.1056/NEJM200103153441110.
- Hernán MA, Hsu J, Healy B. A second chance to get causal inference right: a classification of data science tasks. CHANCE. 2019;32(1):42–49. doi:https://doi.org/10.1080/09332480.2019.1579578.
- Box GEP. Robustness in the strategy of scientific model building. In: Launer RL, Wilkinson GN, editors. Robustness in statistics. Cambridge (Massachusetts): Academic Press; 1979. p. 201–236.
- Geman S, Bienenstock E, Doursat R. Neural networks and the bias/variance dilemma. Neural Comput. 1992;4(1):1–58. doi:https://doi.org/10.1162/neco.1992.4.1.1.
- Liu K, Meng X-L. There is individualized treatment. Why not individualized inference? Annu Rev Stat Appl. 2016;3(1):79–111. doi:https://doi.org/10.1146/annurev-statistics-010814-020310.
- Searle SR, Casella G, McCulloch CE. Variance components. New York (NY): Wiley; 1992.
- Greenland S. Principles of multilevel modelling. Int J Epidemiol. 2000;29(1):158–167. doi:https://doi.org/10.1093/ije/29.1.158.
- James G, Witten D, Hastie T, et al. An introduction to statistical learning: with applications in R. New York (NY): Springer; 2013.
- Greenland S, Daniel R, Pearce N. Outcome modelling strategies in epidemiology: traditional methods and basic alternatives. Int J Epidemiol. 2016;45(2):565–575. doi:https://doi.org/10.1093/ije/dyw040.
- Chai T, Draxler R. Root mean square error (RMSE) or mean absolute error (MAE)? Geosci Model Dev. 2014;7:1247–1250. doi:https://doi.org/10.5194/gmdd-7-1525-2014.
- Senn S. Mastering variation: variance components and personalised medicine. Stat Med. 2016;35(7):966–977. doi:https://doi.org/10.1002/sim.6739.
- Meng X-L. Enhancing (publications on) data quality: deeper data minding and fuller data confession. R Stat Soc Ser A. 2021;184(4):1161–1175. doi:https://doi.org/10.1111/rssa.12762.
- Reynolds MW, Bourke A, Dreyer NA. Considerations when evaluating real-world data quality in the context of fitness for purpose. Pharmacoepidemiol Drug Saf. 2020;29(10):1316–1318. doi:https://doi.org/10.1002/pds.5010.
- Chen X, Meng F, Jiang R. Neutrophil-to-lymphocyte ratio as a prognostic biomarker for patients with metastatic renal cell carcinoma treated with immune checkpoint inhibitors: a systematic review and meta-analysis. Front Oncol. 2021;11(746976). doi:https://doi.org/10.3389/fonc.2021.746976.
- Msaouel P, Goswami S, Thall PF, Wang X, Yuan Y, Jonasch E, et al. A phase 1-2 trial of sitravatinib and nivolumab in clear cell renal cell carcinoma following progression on antiangiogenic therapy. Sci Transl Med. 2022;14(641):eabm6420. doi:https://doi.org/10.1126/scitranslmed.abm6420.
- Msaouel P, Lee J, Thall PF. Making patient-specific treatment decisions using prognostic variables and utilities of clinical outcomes. Cancers. 2021;13(11):2741. doi:https://doi.org/10.3390/cancers13112741.
- De Gonzalez AB, Cox DR. Interpretation of interaction: a review. Ann Appl Stat. 2007;1(2):371–385.
- Xu Y, Müller P, Wahed AS, Thall PF. Bayesian nonparametric estimation for dynamic treatment regimes with sequential transition times. J Am Stat Assoc. 2016;111(515):921–935. doi:https://doi.org/10.1080/01621459.2015.1086353.
- Gelman A. Bayesian data analysis. 3rd ed. Boca Raton (FL): CRC Press; 2014.
- Thall PF, Wathen JK, Bekele BN, Champlin RE, Baker LH, Benjamin RS, et al. Hierarchical Bayesian approaches to phase II trials in diseases with multiple subtypes. Stat Med. 2003;22(5):763–780. doi:https://doi.org/10.1002/sim.1399.
- Xu Y, Thall PF, Hua W, Andersson BS. Bayesian non-parametric survival regression for optimizing precision dosing of intravenous busulfan in allogeneic stem cell transplantation. J R Stat Soc Ser C Appl Stat. 2019;68(3):809–828. doi:https://doi.org/10.1111/rssc.12331.
- Greenland S, Hofman A. Multiple comparisons controversies are about context and costs, not frequentism versus Bayesianism. Eur J Epidemiol. 2019;34(9):801–808. doi:https://doi.org/10.1007/s10654-019-00552-z.
- Gelman A, Hill J. Data analysis using regression and multilevel/hierarchical models. Cambridge; New York (NY): Cambridge University Press; 2007.
- Carmona-Bayonas A, Jiménez-Fonseca P, Gallego J, Msaouel P. Causal considerations can inform the interpretation of surprising associations in medical registries. Cancer Invest. 2022;40(1):1–13. doi:https://doi.org/10.1080/07357907.2021.1999971.
- Shapiro DD, Msaouel P. Causal diagram techniques for urologic oncology research. Clin Genitourin Cancer. 2021;19(3):271 e1–271 e7. doi:https://doi.org/10.1016/j.clgc.2020.08.003.
- Greenland S, Mansournia MA. Penalization, bias reduction, and default priors in logistic and related categorical and survival regressions. Stat Med. 2015;34(23):3133–3143. doi:https://doi.org/10.1002/sim.6537.
- Mansournia MA, Higgins JPT, Sterne JAC, Hernán MA. Biases in randomized trials: a conversation between trialists and epidemiologists. Epidemiology. 2017;28(1):54–59. doi:https://doi.org/10.1097/EDE.0000000000000564.
- Pearl J. Causality: models, reasoning, and inference. 2nd ed. Cambridge (UK); New York (NY): Cambridge University Press; 2009.
- Greenland S, Pearl J, Robins JM. Causal diagrams for epidemiologic research. Epidemiology. 1999;10(1):37–48.
- Msaouel P. Impervious to randomness: confounding and selection biases in randomized clinical trials. Cancer Invest. 2021;39(10):783–788. doi:https://doi.org/10.1080/07357907.2021.1974030.
- Msaouel P, Grivas P, Zhang T. Adjuvant systemic therapies for patients with renal cell carcinoma: choosing treatment based on patient-level characteristics. Eur Urol Oncol. 2021;5:265–267. doi:https://doi.org/10.1016/j.euo.2021.09.003.
- McLoughlin EM, Gentzler RD. Epidermal growth factor receptor mutations. Thorac Surg Clin. 2020;30(2):127–136. doi:https://doi.org/10.1016/j.thorsurg.2020.01.008.
- Logothetis CJ, Gallick GE, Maity SN, Kim J, Aparicio A, Efstathiou E, et al. Molecular classification of prostate cancer progression: foundation for marker-driven treatment of prostate cancer. Cancer Discov. 2013;3(8):849–861. doi:https://doi.org/10.1158/2159-8290.CD-12-0460.
- Rafi Z, Greenland S. Semantic and cognitive tools to aid statistical science: replace confidence and significance by compatibility and surprise. BMC Med Res Methodol. 2020;20(1):244. doi:https://doi.org/10.1186/s12874-020-01105-9.
- Nicholls A. Confidence limits, error bars and method comparison in molecular modeling. Part 1: the calculation of confidence intervals. J Comput Aided Mol Des. 2014;28(9):887–918. doi:https://doi.org/10.1007/s10822-014-9753-z.
- Council NR. Improving information for social policy decisions – the uses of microsimulation modeling: volume I. In: Constance F. Citro, Eric A. Hanushek, editors. Review and recommendations. Washington, DC: The National Academies Press; 1991. p. 89–96.
- Imrey PB, Dawid AP. A commentary on statistical assessment of violence recidivism risk. Stat Public Policy. 2015;2(1):1–18. doi:https://doi.org/10.1080/2330443X.2015.1029338.