
 ?Mathematical formulae have been encoded as MathML and are displayed in this HTML version using MathJax in order to improve their display. Uncheck the box to turn MathJax off. This feature requires Javascript. Click on a formula to zoom.
Abstract
Multivariate normal distribution is base for many statistical techniques, including ordinary least square inference. Here we show that in order to make research on Internationalization of Companies, more flexible approach is needed, namely partial least squares (PLS). It is a nonparametric technique, used in Structural Equation Modeling (SEM), which makes no distributional assumptions and also may be applied with small sample sizes. In this study we discuss on regularity conditions for PLS from the perspective of semi-continuous covariance which fills the gap in the current studies. The stochastic aspects, especially those related to usage of PLS-SEM, can be well integrated to the topologically grounded regression, where jumps in the covariances can occur. The purpose of the research is to analyze and understand the impact of the Incentive System (IS) for Innovation, within the scope of the National Strategic Reference Framework (QREN) 2014-2020, on the Internationalization of Portuguese Small and Medium Enterprises (SMEs). We study stochastic aspects of theoretical model which aggregates the variables Product Innovation, Marketing Innovation, Organizational Innovation and Working Conditions as determinants of Internationalization of Companies.
Data were collected based on a quantitative methodology, through a self-completion questionnaire using the Likert psychometric scale, which registered 120 participants. Organizational Innovation (exogenous latent construct) and Product Innovation have shown a statistically significant indirect effect on the Internationalization of Companies (endogenous latent construct) through Marketing Innovation. The latter has a direct effect on the Internationalization (target construct). However, Working Conditions has the greatest impact on Internationalization, meaning that measures such as increasing wages, decreasing the use of temporary work and precarious work conversion into labor effective relations have a very relevant direct effect on the Internationalization of Portuguese SMEs.
1. Introduction
Application of partial least squares models (PLS) needs proper stochastic justification, related to impossibility to rely on multivariate normality. Here we provide one important justification which is related to the covariance structure properties. Stehlík et al. [Citation1] introduced a,b,c) class of semicontinuous covariance matrices, which for the sake of simplicity has been illustrated for one-dimensional processes. In the present paper the following regularity assumptions on covariance structure. We assume the class of positive definite functions such that
for all
for all δ mapping
That means a,b,c) covariance function can make a jumps, which can many times happen in statistical modeling. Such class easily extends to construction for higher dimensions, e.g. for bivariate covariances
and
with adjustments
As we know from Crum [Citation2], isotropic covariance function positive definite on Euclidean space R with dimension m > 1 is necessarily continuous except perhaps at lag zero, i.e. at the origin. Since we work here in dimension m = 2, if we allow discontinuity along the border, our covariance will be non-isotropic. This differs qualitatively from one-dimensional case m = 1 where the discontinuity points of isotropic and positive definite covariance function can be a dense set. Such kind of covariances are studied in Stehlík et al. [Citation1]. To avoid the complexity of the modeling we can in a feasible way consider positive definite isotropic covariance on a ray passing over the regions.
The application is within the institutional framework of the Portuguese economy, to analyze and understand the impact of the Portugal 2020 Innovation Incentive System (IS) on the internationalization of Portuguese Small and Medium Enterprises (SMEs). Internationalization is, like the promotion of competitiveness, the promotion of social inclusion, employment and social cohesion and State reform, one of the priorities of economic, social, environmental and territorial development policies in Portugal (see [Citation3]). In 2014, Portugal signed a Partnership Agreement with the European Commission, designated Portugal 2020, for a programming period from 2014 to 2020, which established programming principles for the implementation of the Europe Strategy 2020 and which enshrined economic, social development policies, environmental and territorial aspects necessary to support, stimulate and ensure a more competitive and prosperous country (see [Citation3]). Also in 2014, Portugal recognized that the achievement of the priorities of the public policy of economic dynamism-promotion of competitiveness and internationalization of the economy-depended on the empowerment of the Portuguese economic fabric of instruments capable of overcoming the existing constraints to the implementation of the policy and of enhancing results in assessment site (see [Citation4]).
The promotion of the incorporation of elements of Innovation in the business models of Portuguese SMEs, through the IS of the previous National Strategic Reference Framework (QREN) (2007-2013) [Citation5], was evaluated as one of the instruments that most contributed to the competitiveness and internationalization of business models, especially for SMEs (Agency for Development and Cohesion, IP, 2018, p. 34 [Citation6]). The assessment of the impact of IS on the overall performance of Portuguese companies concluded that previous IS tended to favor companies with more sophisticated and financially robust business practices; that over the years, the positive impact of IS has increased in the fields of Innovation, in the qualification of company employees, in the field of expansion of national companies to international markets and in the field of productivity; whereas the working conditions of human resources have changed, through the increase in the number of open-ended contracts in the companies supported by the IS, but also through the increase in the number of temporary employees in the same companies; whereas the income condition of human resources also changed in the companies supported, through an increase in the average earnings per employee; and that the effectiveness of IS and the production of results for each Euro of public funds invested is greater in companies with difficulties in accessing finance and in companies that are not covered by other competitiveness policy instruments ([Citation5]). The evaluation by the European Commission of the impact of IS on European SMEs also concluded that the effects of IS can be heterogeneous and range from catalysts of new investments, to amplifiers of the investment dimension, to accelerators of the investment realization cycle or to produce changes in the funding structure (see [Citation7]). The IS for Productive Innovation within the scope of the NSRF (National Strategic Reference Framework) 2014-2020 have as their main objective the support of projects that contribute to the promotion of the increase of tradable and internationalizable production and the change of the productive profile of the economic fabric, through the development of innovative solutions based on Research and Development results and the integration and convergence of new technologies and knowledge; strengthening the business capacity of SMEs for the development of goods and services, through business investment in innovative and qualified activities that contribute to their progression in the value chain; the increase in the management capabilities of companies and the specific qualification of assets in areas relevant to the Innovation, Internationalization and modernization strategy of companies, in order to enhance the development of productive activities that are more intensive in knowledge and creativity and with a strong incorporation of value national added value-Product/service innovation, Innovation in organizational management practices and Innovation in the marketing of goods and products. In the literature, Innovation and technological development, for example, are referred to as the epicenter of the economic growth process and mark the evolution of the industrial structure of countries, resulting from the accumulation of knowledge and the diffusion of Innovation across all sectors of national economies, disseminating new capabilities among companies and displacing knowledge hitherto concentrated in sectors or regions but they are sides of the same coin, insofar as technological development influences the behavior of the industrial and economic structure of countries, and this same structure influences the degree of Innovation. Despite this apparent confluence, conceptual and methodological challenges persist in understanding the relationship between Innovation and technological development with organizational internationalization, namely, does the appropriation of elements of Innovation manifest itself in the expansion to other markets, other than the national one? The research chose to analyze and understand the impact of IS on Innovation, within the scope of the NSRF 2014-2020, on the Internationalization of SMEs because this object of study-SMEs-is what best characterizes the Portuguese economic fabric, consisting of 99.9% by SMEs and in 2018, 96.1% of all Portuguese companies were micro-enterprises (see [Citation8]). In addition, the State of the Art on this topic is unanimous in claiming the inexistence/insufficient production of research on this topic, having SMEs as an object of study, in contrast to studies that elect large companies (Ratten and Dana [Citation9]); (Higon and Driffield [Citation10]) and where Internationalization does not encounter the constraints inherent to the small size of the company. The following research questions arise from the main questions related to the research theme, and which the literature returns:
What is the impact of the IS on Innovation in promoting the Internationalization of Portuguese SMEs?
Which of the elements of Productive Innovation-Product Innovation; Organizational Innovation; or Marketing Innovation, competes more or has a greater effect on Internationalization?
What is the impact of changing Working Conditions in companies supported by the IS on Innovation and Internationalization of Portuguese SMEs?
In the case of a positive demonstration of the effectiveness of public investment in Innovation, through IS’s, what lessons can be learned for private investment?
Thus, and considering the main key ideas from economic perspective, e.g. the internationalization of the Portuguese economic fabric is a priority of the public policy of economic dynamism; one of the instruments considered to be most effective in achieving this public policy priority has been public support, in the form of an IS for Innovation; The two previous key ideas are reinforced by the conclusions and recommendations of the assessment instruments of the previous QREN (QREN, 2011 and 2012); ([Citation11,Citation12]); The end of the QREN Portugal 2020 results in the necessary assessment of its impacts on the public policy of economic dynamism, therefore, it is important to know whether public investment in Innovation, through the IS of the NSRF 2014-2020, produced the expected impacts, and whether the hypotheses built around either the understanding of the state of art or the literature can be validated:
Hypothesis 1: Product Innovation is directly and positively related to the Internationalization of Portuguese SMEs;
Hypothesis 2: Marketing Innovation is directly and positively related to the Internationalization of Portuguese SMEs;
Hypothesis 3: Organizational Innovation is directly and positively related to the Internationalization of Portuguese SMEs;
Hypothesis 4: Changes in Work Conditions in beneficiary SMEs are directly and positively related to the Internationalization of Portuguese SMEs.
The general objective of the investigation is to analyze and understand the impact of the IS on Innovation, within the scope of the QREN [Citation5], on the Internationalization of Portuguese SMEs. From this attempt to analyze and understand impacts, other secondary objectives derive, but are linked to the main objective:
Analyze and understand the effectiveness of the IS for Innovation, as an instrument favored by the State in the implementation of the public policy of economic dynamism;
Analyze and understand the effectiveness of other variables not privileged by the State in the implementation of the public policy of economic dynamism, as is the case of changes in the condition toward work, of the human resources of the companies supported by the IS to Innovation;
Analyze and understand, from the set of independent variables mobilized, which one has the greatest explanatory power of the phenomenon of Internationalization of Portuguese SMEs;
Analyze and understand the explanatory power of Innovation in Portuguese SMEs’ expansion movements to international markets;
Check the current status of classical literature, which advocates that the size of the company is the factor with the greatest impact in explaining Internationalization;
Produce a set of lessons learned from the experience of companies supported by the IS for Innovation, within the scope of QREN 2014–2020, aimed at attracting and raising awareness of the private sector for investment in Innovation.
In the context of the Portuguese economy and in the context of the current public policy of economic dynamism, research is of particular importance for understanding the impact of measures to encourage Innovation, to strengthen qualification and modernize the Portuguese economic and productive fabric and the impact of Innovation in promoting organizational internationalization. In addition to the contribution to understanding the impacts, the contribution to understanding the context. We know that the Portuguese business fabric is mainly composed of Micro and SMEs and the assessment of impacts in this specific context can allow efficiency gains in public management.
In addition to the factors already mentioned, the importance of studies that demonstrate the impact of the size of companies on Internationalization (Zahara [Citation13]); (McDougall et al. [Citation14]) and the importance of studies that demonstrate the effectiveness of public investment in Innovation and consequently in the promotion of Internationalization, considering the desirable and progressive replacement of public intervention by private investment.
The literature also indicates that activities of productive innovation and technological development are rarely mobilized as explanatory factors of the Internationalization of SMEs (Nassimbeni [Citation15]), being more frequent the mobilization of explanatory variables such as the dimension, or degree of development. This investigation is also particularly relevant as it contributes to the understanding of other explanatory variables of Internationalization in small companies, other than the most common variables.
The paper is organized as follows. In the next Section 2 we provide theoretical background for regression with jumps in covariance which provides better justification of used PLS methodology. This also naturally extends Sacks-Ylvisaker conditions for good asymptotic properties of the estimators in the context of regression designs for correlated error models.
In Section 2 we theoretically frame the study and discusses the main ideas and theories around the theme and demonstrates how the literature has not been able to fully explain the process of Internationalization of SMEs, both regionally and globally. In Section 3 we give the importance of reflection on public support given to the private sector and the importance of human resource management in the competitiveness of companies was also included here. We describe the statistical method used-Structural Equation Modeling, the estimator used consistent PLS (PLSc), and the importance of carrying out an evaluation routine as suggested in the literature. We present the reason why we considered reflective and formative constructs (or latent variables), which will be evaluated differently. The procedure used for data collection and the sample obtained are described. We also describe the behavior of the observed variables and match the results with the hypotheses initially presented. In Section 4 we provide short discussion on results and on the practical implications in Human Resource Management.
2. Sacks-Ylvisaker conditions and their relation to topological regression
Sacks-Ylvisaker [Citation16] and in two follow-up papers studied designs for regression problems for correlated errors and we can consider such regularities as limiting cases when one can expect to receive a reasonable regression estimators. This motivates us to show, that their conditions under generic circumstances implies relaxed a,b,c) conditions introduced in [Citation1]. The requirement to use PLS can be thus justified as follows: if we show that we have violations from continuity of covariance, we can consider it as justification to apply also PLS methodologies. Technical aspects of Sacks-Ylvisaker conditions are discussed in this section.
Here we cite the Sacks-Ylvisaker [Citation16] conditions for covariance kernels K in the univariate case, We denote one-sided limits at the diagonal in
in the following way: Let
and let
denote the closure of a set A. Suppose that L is a continuous function on
such that
is continuously extendable to
for
By Lj we denote the extension of L to
which is continuous on
and on
Furthermore, by
we denote
We say that a covariance kernel K on
satisfies the Sacks-Ylvisaker conditions of order
if the following three conditions hold:
the function
Remark 1.
Notice that the regularity conditions a,b,c) introduced in [Citation1] are designed only for the isotropic random field. However, Sacks-Ylvisaker-conditions are satisfied also by the anisotropic fields, e.g. Brownian motion with covariance kernel satisfies Sacks-Ylvisaker with
Observe, that due to A) and B) any process with covariance kernel K has exactly r derivatives in the mean square sense, i.e. for r = 0 it is a mean square continuous process. Examples which satisfy assumptions A) and B) are easy to find. One class is with
with
never 0 and
Another class of examples is given by the stationary covariance function
where
As for examples which satisfy the A,B,C) is
Brownian motion kernel
Slepian kernel
Ornstein-Uhlenbeck kernel
Class of convex stationary covariance functions of the form
where p is the density such that
and
for some a.
For r = 0 the conditions A,B,C) are satisfied in particular by kernels (1),(2) and (3). Kernels of higher regularity can be obtained by r-fold integration of a corresponding process with deterministic or stochastic boundary conditions. Modifications of A,B,C) are used by several authors. The major difficulties in applying the results of Sacks-Ylvisaker are in obtaining explicit information about the reproducing kernel spaces. The most easily handled reproducing kernel spaces from computational point of view are those which correspond to covariance kernel having the form For the kernels of the another form, the amount of knowledge on kernel space is relatively small. The other difficulty for practical application of some kernels satisfying Sacks-Ylvisaker is that, although these are much less smooth than for instance analytical Gaussian covariance kernel, they are too smooth for some real applications. The particular remedy for collapsing could be employing the so called ‘nugget’ which decreases the smoothness of the process. In the following theorem we describe the relationship between the A,B,C) and a,b,c) regularity conditions. Here we consider relation for every
and any
(1)
(1)
Theorem 2.1.
Let X be an isotropic random field on with covariance kernel K satisfying Sacks-Ylvisaker conditions A,B,C) and such that
Then there exist an isotropic random field on R+ with a covariance kernel
satisfying regularity conditions a,b,c) and such that for all
such that
we have:
where J0 is the Bessel function of the first kind of order 0, G is bounded and non-decreasing function and
for all
and
otherwise, where
is the first minimum of J0 at
Remark 2.
The idea of the proof is to construct a continuous extension of K. For instance, if is the kernel of the Slepian process, then
is well defined in the
The maximal attainable distance is 1, and
where
We can define
for all
and thus corresponding
fulfills the desirable properties. The other illustrating example is a subclass satisfying A,B,C)
with
Employing the Lebesgue’s Dominated Convergence Theorem we have
Function
is continuous and non-increasing. Thus for every isotropic C on
we can find a covariance function
on
that
for all
and
otherwise.
Let us denote by the set of all covariances of random fields satisfying the A,B,C), by
the set of all covariances of isotropic random fields and by
the set of all covariances of random fields satisfying the a,b,c). Then we have
but
To illustrate
consider the Gaussian covariance function
but
since B) does not hold. For more explanation: if
and assumption A) is satisfied then K(s, t) is differentiable everywhere in
and thus it is too smooth process and therefore does not belong to the class
because [Citation16] were not able to extend their method based on reproducing kernel Hilbert spaces to such smooth processes.
2.1. Multidimensional case
Yaglom [Citation17] considered two different multidimensional generalizations of the concept of a homogeneous and isotropic field in R Here we can consider multidimensional homogeneous fields for which the mean value vector and the matrix of correlation (i.e. each component of the mean vector and each element of the correlation matrix separately) are invariant with respect to all orthogonal transformations of their functional arguments (in the case of fields considered here this is equivalent to the requirement that the mean vector be constant and that all elements of the correlation matrix depend only on the length of the lag vector). We shall call such multidimensional fields multidimensional homogeneous and isotropic scalar fields. In such a setup we can postulate an analogous result as was formulated in Theorem 2.2 for the multidimensional case.
Theorem 2.2.
Let X be a n-dimensional isotropic random field on with covariance kernel K satisfying Sacks-Ylvisaker conditions A,B,C). Then there exist an isotropic random field on
with a covariance kernel
satisfying regularity conditions a,b,c) and such that for all
we have
(2)
(2)
(3)
(3) and
for all
and
otherwise, where
is the first minimum of the spherical Bessel function
at
Here
is maximal such bound, that both integral inequalities Equation(2)
(2)
(2) and Equation(3)
(3)
(3) hold.
3. Structural equation modeling for SMEs internationalization
Structural Equation Modeling (SEM) is a statistical method that mainly combines elements of factor analysis and multiple linear regression. Its main objective is to examine a structure of relationships expressed through a set of equations that illustrate all the relationships between the latent variables under study. To apply SEM, two types of methods are available, covariance based (CB) and variance based (VB). Although they complement each other, they differ statistically and have different objectives and requirements. The VB estimator PLS estimates the model parameters in order to maximize the explained variance of the available endogenous latent constructs through ordinary least squares regressions and also emphasizes prediction while it simultaneously relaxes the demands on data. Two of the reasons commonly considered for the use of PLS is the fact that the data do not have a multivariate normal distribution and the parameter estimates obtained are more accurate than estimates using CB-SEM in small sample studies ([Citation18]). This is the situation that occurs with the data of this study, since in the application of the Mardia test for multivariate normality in R, the p-values obtained for skewness and kurtosis coefficients were approximately zero.
In 2020, the group of SMEs that benefited from the IS to Productive Innovation was 895 companies (see [Citation19, Citation20]) and the study sample is composed of a total of 120 companies (approximately 13.4%), well above the minimum number of observations recommended by the literature. To obtain the minimum sample size, which is the number of observations needed to represent the underlying population and to meet the technical requirements of the PLS, we used the inverse square root method. Although the PLS-SEM has good convergence characteristics and achieves high levels of statistical power even for small sample sizes (Hair et al. [Citation21]), for the theoretical model (in ), the minimum sample size is nmin = 69 observations for a value of the path coefficient (pmin) with a minimum magnitude between 0.21 and 0.3, to achieve a statistical power of for detecting a medium effect size of
and assuming 5% probability of error.
Figure 1. Model considered after the application of the CTA-PLS algorithm.
The participating companies come from the various sectors of economic activity, and are geographically distributed across the districts of Coimbra, Leiria, Santarém and Lisbon. The most important sectors of activity were the manufacturing sector, which represented 13.3% of the companies surveyed, the extractive industry sector together with the civil construction sector, both representing 11.7% and the agriculture sector, animal production, hunting, forestry and fishing, which represented 10.8% of the business area of the participating companies (see ).
Table 1. Distribution of participating companies by sector of activity.
For reasons of saving resources and complying with a previously defined schedule, it was not possible to apply a random sampling method, which to a certain extent can compromise the representativeness of the sample. An attempt was made to overcome the impossibility of random selection, with the introduction of factors that would guarantee the greatest possible representation, such as the geographical heterogeneity of companies, the heterogeneity of their sectors of activity, the fact that they all share the benefit of the same incentive system and the fact that only participants (i.e. company employees) were selected whose level of literacy/knowledge of the internal dynamics of the company they represented allowed them to respond based on the mastery of the underlying concepts. The selected companies were previously contacted by telephone for the purposes of information and dissemination of the research objectives, for the purpose of providing clarifications regarding issues of confidentiality and anonymity, for the purpose of providing clarifications regarding questions of eligibility criteria for participation, and to obtain prior authorization. The questionnaire survey was made available through a link with limited access to employees with management and administration roles, as it was necessary to ensure that participants understood the underlying concepts. Data were collected based on a quantitative methodology, through a self-completion questionnaire, using the Likert psychometric scale, consisting of 5 items: I totally disagree; partially disagree; indifferent; partially agree; I totally agree. The use of this scale is justified by the increase in the rate of return of questionnaires, in the quality of the answers, in the agility and simplicity, in the reduction of blank answers or null answers, in the reduction of the respondents’ frustration, when compared with other similar scales (Babakus and Mangold [Citation22]). The questionnaire was built based on an adaptation of a questionnaire previously validated in the literature (Jantunen [Citation23]) and included questions related to the latent variables Working Conditions, Product Innovation, Marketing Innovation, Organizational Innovation and Internationalization of Companies, and a question framework for companies in the respective sector of activity. The original questionnaire (Jantunen [Citation23]) from 2005 was developed for the American reality, however, it was adapted in 2017 by a team of researchers from the University of Aveiro, Portugal, in an investigation relatively similar to this one (Ribau et al. [Citation24]). The variable Internationalization of Companies was operationalized through the items:
Int 1 The company’s export volume has increased in recent years;
Int 2 The company’s international market share has increased in recent years;
Int 3 The company’s participation in international fairs and events has been more frequent in recent years;
Int 4 The company has conquered new markets in recent years;
Int 5 The company has strengthened its strategic position in recent years.
The variable Working Conditions was operationalized through the items:
WC 1 In recent years, the use of temporary work has decreased in the company;
WC 2 In recent years, the number of workers with precarious employment contracts has decreased in the company;
WC 3 In recent years, expenses with salaries and compensation have increased in the company;
WC 4 In recent years, the qualification of employees has increased in the company.
To operationalize the Product Innovation variable, the following items were used:
PI 1 In recent years, the company has introduced new products or services to the market or improved existing ones;
PI 2 In recent years, the company has promoted Research and Development activities;
PI 3 In recent years, the company has supported the development of new ideas.
To operationalize the Marketing Innovation variable, the following items were used:
MI 1 In recent years, the company has increased its search for new markets and opportunities;
MI 2 In recent years, the company has been monitoring consumer behavior more closely;
MI 3 In recent years, the company has invested more in its own brand.
And for the operationalization of the Organizational Innovation variable, the following items were used:
OI 1 In recent years, the effectiveness of organizational processes has increased in the company;
OI 2 In recent years, the quality of organizational processes has increased in the company;
OI 3 In recent years, investment in the company’s digital capability has increased.
3.1. Analysis steps
SEM and the PLSc estimator, which corrects the bias to consistently estimate SEM with common factors while maintaining all the strengths of the traditional PLS method, require a set of relatively complex calculation and analysis procedures. For this reason, the estimated model that is intended to be evaluated by comparing the relationships inherent to the measurement model and the structural model arising from the hypotheses formulated by the theoretical model and the observed relationships underlying the data collected, must comply with a well-defined analysis strategy. Defined and established a priori in order to ensure that both the structural model and the measurement model are correctly specified, and that the results are valid. The investigation considered the guidelines of Hair et al. ([Citation21, Citation25]) and Benitez et al. [Citation26] and was developed along the following systematic stages of analysis:
Design and construction of a theoretical model (causal relationship paths) based in the specialized literature and on the know-how of authors;
Study of the type of the constructs, application of Tetra Confirmatory Analysis and estimation of the model;
Evaluation of the reflective measurement model;
Evaluation of the formative measurement model;
Evaluation of the structural model.
3.2. Evaluation of the measurement and structural model
The main objective of evaluating the measurement model is to verify whether the items (or indicators, or observed or manifest variables) of each of the constructs that the research mobilized as having an effect on the phenomenon, effectively and accurately measure their respective concept, contrary to what happens with the evaluation of the structural model, whose main objective is to define causal or association relationships between the variables. However, the verification of an item’s ability to accurately measure the proposed concept depends on the nature of the construct. When the constructs are reflective, the validation of the measurement model uses the following evaluation criteria: reliability and validity. The validation of the formative measurement model mobilizes evaluation criteria that are different from the reflective model. To evaluate the formative measurement model, weights and factor loadings are verified.
Note that, to evaluate the results of the estimated model, we considered the rules of thumb that have been made available in the literature and that serve as general guidelines (Hair et al. [Citation5, Citation27]; Benitez et al. [Citation28]). The bootstrap resampling procedure (Bias Corrected and accelerated - BCa) was also used and to ensure the stability of the results we considered 10 000 subsamples, with the original sample size. We then obtained 95% bootstrap BCa confidence intervals (CI), t-Statistics and p-values.
3.3. Confirmatory tetra analysis
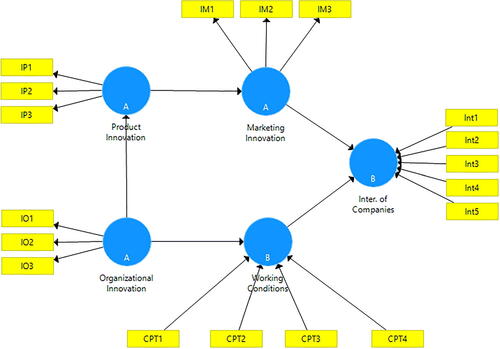
In the initial phase of the collected data analysis, we considered the analysis and evaluation of the measurement model. Some authors (Ringle et al. [Citation28]) argue that this first moment must be preceded by a correct definition of the behavior of the constructs, because the result of the definition impacts both the results of the evaluation of the measurement model and the final model. And suggest carrying out an evaluation routine of the type Tetra Confirmatory Analysis (CTA-PLS) to avoid potentially unrepresentative consequences of the measurement model and the final model. Understanding what distinguishes reflective and formative constructs is particularly important for understanding the model. The CTA-PLS is a technique that allows testing whether the relationship between the observed/manifest variables/indicators/items and the constructs is formative or not, regardless of the structural model presented. According to the recommendation of the same authors, whenever the constructs do not have the same number of manifest variables, one should, using replacement (the term replacement is understood here as the use of a borrowed variable), and not the exchange of one for another, evenly distribute the variables among the constructs with a lower number of items. This was the case, therefore, the constructs Organizational Innovation, Product Innovation and Marketing Innovation in , because they were operationalized by only three manifest variables, received a borrowed manifest variable from the neighboring constructs, so that it was possible to apply the CTA-PLS.
We then applied the CTA-PLS to the model in , where to ensure the stability of the model, we used the bootstrapping resampling (5000 samples were considered in the application of this algorithm) for a significance level of We obtained the results presented in that reveal the combinations between the indicators associated with each construct. When reading , we considered the last two columns, relative to the limits (lower and upper) of the confidence interval. If the limits do not contain zero, the construct is formative, but if they do contain zero, the construct is reflexive. It is enough that there is at least one interval that does not have zero, for the construct to be formative, as is the case of the constructs Working Conditions and Internationalization of Companies.
Table 2. Results obtained with the application of the CTA-PLS algorithm.
illustrates the mixed model resulting from the application of the CTA-PLS algorithm. The blue circles represent latent or unobservable variables; the yellow rectangles are used to distinguish the manifest variables and the arrows represent the relationships between latent and manifest variables and vice-versa. The model represented in is a mixed model, with reflective constructs-those indicated in the blue circles with the letter A and formative constructs-those indicated in the blue circles with the letter B. The formative constructs are formed by manifested variables, so the arrows go from the manifest variables to the constructs, while in reflective constructs the arrows go from the constructs to the indicators.
Figure 2. Estimated model obtained with PLSc (outer loadings, path coefficients and coefficients of determination).
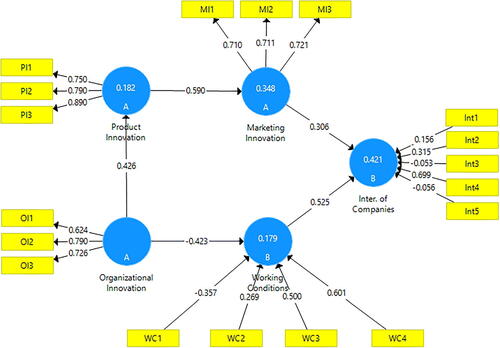
To obtain the estimated model of the stop criterion (10E-07) of the PLSc-SEM algorithm was reached before the maximum number of 300 iterations, defined in the parameter settings. In this case, the algorithm converged in iteration 23 (starting at zero), which is considered a fast and stable solution (Hair et al. [Citation27]).
The structural equations related to the estimated model in are:
Product Innovation =
Marketing Innovation =
Working Innovation =
Inter. of Innovation =
3.4. Results of statistical modeling
For assessing the reflective measurement (outer) model we examine:
Indicators loadings: the standardized loading values in and are above threshold 0.708 (except for the indicators: WC1, OI1 and Int5), indicating that the respective construct explains more than 50% of the indicators variance and, therefore, providing acceptable indicator reliability. They are also statistically significant with p-values () lower than the usual significance levels, namely less than 0.001, suggesting that the measures are reliable.
Internal consistency reliability: values of the measure of internal consistency reliability ρA are presented in . It is considered as an approximately exact measure of construct reliability, since Cronbach’s alpha can be very conservative and the composite reliability maybe too liberal. The Dijkstra-Henselers ρA values in the three constructs are greater than 0.7 (recommended minimum threshold) and less than 0.95 (equal or greater values can be problematic), indicating high levels of reliability. The upper bounds of the 95% bootstrap BCa CI are all lower than 0.95 and all values are also statistically significant with p-values
Convergent validity: the metric used for evaluating a constructs convergent validity is the Average Variance Extracted (AVE). In the AVE values are higher than 0.5, indicating that the constructs explains at least 50% of the indicators variance. All of them are also statistically significant (with p-values < 0.001) and therefore we can say that the model converges with a satisfactory results.
Discriminant validity: the HTMT (Heterotrait-Monotrait ratio) was used to assess discriminant validity of the constructs, which can be considered for a threshold of 0.85 (for conceptually different constructs). In all values are below 0.85 and also all upper bound of the
Table 3. Outer loadings: mean, StDev, t-values and p-values.
Table 4. Internal consistence reliability: ρA, bias, 95% bootstrap BCa CI and p-values.
Table 5. Convergent validity: Average Variance Extracted (AVE), Bias, 95% bootstrap BCa CI and p-values.
Table 6. Discriminant validity: Heterotrait-Monotrait ratio (HTMT), bias, 95% bootstrap BCa CI.
3.5. Evaluation of the formative measurement model
For assessing the formative measurement (outer) model we examine:
Collinearity: the Variance Inflation Factor (VIF) was used to examine the outer collinearity. Probable (i.e. critical) collinearity issues when VIF is higher than 5 and ideally all values should be less than 3. Although all VIF values are below 5 in , three indicators present values slightly above 3 and only one indicator has VIF close to 4 (formative constructs: Working Conditions and Internationalization of Companies). Thus, it appears to be an unproblematic situation in terms of collinearity.
Outer-Weights: in , some manifest variables of the formative constructs Working Conditions and Internationalization of Companies have small weights and that proved to be not statistically significant, for a significance level of
Table 7. Collinearity analysis in outer model: Variance Inflation Factor (VIF).
Table 8. Outer weights: mean, StDev, t-values and p-values.
3.6. Evaluation of the structure model
To assess the structural (inner) model we examine:
Overall model fit: in addition to the bootstrap-based test to statistically assess the overall model fit we also used as a measure of approximate fit the standardized root mean square residual (SRMR), the squared Euclidean distance (dULS) and the geodesic distance (dG), to obtain empirical evidence for the proposed model and the postulated theory. As all values of the discrepancy measures (SRMR, dULS and dG), in , were below the
Collinearity: the Variance Inflation Factor (VIF) was used to examine the inner collinearity to make sure that it does not bias the regression results. Since all VIF values are less than 3 (), then there are no collinearity issues among the predictor constructs presented in .
Explained variance on the endogenous constructs: the coefficient of determination R
Predictive accuracy: to evaluate the models predictive accuracy we considered the Stone-Geisser Q
Predictive power: to assess the models out-of-sample predictive power, using a holdout sample, we applied the PLSpredict. Considering the Internationalization of Companies the models key endogenous construct, we examined the prediction errors for all endogenous constructs indicators. We started by evaluating the Q
After proving the explanatory and predictive power of the model, we now assess the relevance and statistical significance of the path coefficients.
Statistical significance and relevance of the path coefficients: all standardized structural path coefficients in are statistically significant different from zero at a 1% significance level (p-values are below 0.01 and the
Models comparisons: we employed the Bayesian information criterion (BIC), due to its high model selection accuracy, to evaluate the out-of-sample prediction without using a holdout sample. This metric can be used to compare alternative model configurations. In we can see that the model with the Internationalization of Companies endogenous construct minimizes the BIC value (−52.161).
Table 9. Fit summary of the saturated and estimated models.
Table 10. Collinearity analysis in inner model: Variance Inflation Factor (VIF).
Table 11. Variance explained: Coefficient of determination (R), Bias, 95% bootstrap BCa CI and p-values.
Table 12. Predictive relevance Q
Table 13. Predictive performance of the PLS model vs. benchmark LM, considering the full dataset.
Table 14. Path coefficients with the 95% bootstrap BCa CI and p-values.
Table 15. Predictive relevance Q
In the next section we provide covariance violations based on Stehlík et al. [Citation1]. These results are justifying usage of PLS.
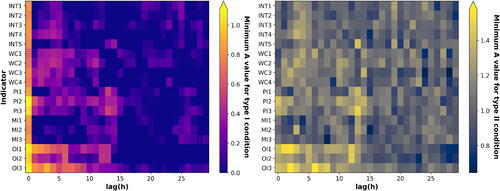
3.7. Violations of types I and II of positive definiteness
We perform autocovariance analysis for each of the Indicators in order to find violations of types I and II of positive definiteness from Stehlík et al. [Citation1]. This is done by finding the unbounded intervals of jump size A > 0 in case of violation conditions, for more details see Lemma 1 and Lemma 2 from Stehlík et al. [Citation1]. The values shown in suggest the use of covariance constructed by a,b,c) class, with a corrected factor instead of classical covariance estimation.
Figure 3. The minimum A value for which each of the Indicators violates conditions (2) in left panel and condition (3) in right panel. Unbounded intervals beginning in each of these minimum values for A at given lag h (x-axis) which violate positive definiteness of each Indicator (y-axis) autocovariance.
4. Conclusions and discussion
Recently, semicontinuous covariance functions have been used by several authors. An appropriate discussion on the regularity conditions for PLS is up to the best knowledge of the authors still missing. The covariance function satisfying conditions a,b,c) still possesses some important features of the continuous covariance, e.g. justifying the increasing domain asymptotics, however, as we have shown in the application, economical analysis has higher complexity and application of PLS is needed. Therefore a natural idea may appear here to employ a semicontinuous covariance functions from class a,b,c) in order to check for necessity of PLS. For computation we used SmartPLS Version 3.3.9 (Ringle et al. [Citation27]) and software R.
The research aimed to analyze and understand the effectiveness of the IS for Innovation, as an instrument privileged by the State in the implementation of public policy of economic dynamism, and the effectiveness of other variables not privileged by the State in the implementation of this same policy, as is the case of the conditions in that the work is performed. The study showed that in Portuguese SMEs, the IS to Innovation manages to translate itself into an instrument of Internationalization when associated with strategies for monitoring consumer behavior, when productive Innovation coincides with an effort in the search for new markets and opportunities and when companies invest in creating their own brand. The investigation also verified that the conditions in which the work is performed have a very significant impact on the internationalization of Portuguese SMEs, and that the increase in wages, the change from the precarious employment relationship, to an effective one and the increase in the qualification of workers, had a greater explanatory power in the process of Internationalization of Companies, than, for example, the development of a new product. The investigation also intended to analyze and understand, from the set of variables mobilized, which one had the greatest explanatory power in the phenomenon of Internationalization of Portuguese SMEs, and in this sense, it was concluded that changes in the conditions in which the work is performed, namely changes in the salary policy, through an increase in salaries, changes in the employee retention policy, through the reduction in the use of temporary work, and changes in the recruitment policy and design of the qualifications profile for a certain function, contributed more (i.e. it has greater statistical relevance) for the Internationalization of the SMEs surveyed than the innovative process. Regarding this objective, it is also important to mention the importance that the Marketing Innovation variable assumed in explaining the process of Internationalization of the surveyed SMEs. The innovative process, using the development of a new product, has no effect on the internationalization process if there is not, in complementarity, an effort to mobilize marketing strategies for that same product. In addition, even if there is no room for production innovation, successful internationalization is possible, only with the use of prospecting activities new markets and opportunities, getting to know the consumer well and investing in the creation of their own brand. The size of the company is not the factor with the greatest impact in the explanation of Internationalization, as it was possible to verify from the study, however, the explanatory power of Innovation in the expansion movements for international markets of Portuguese SMEs is closely associated with the search for new markets and new opportunities and economic diplomacy. The empirical evidence of the investigation supported the research Hypotheses 2 and 4 mentioned in the introduction. As observed in the research structural model, the variables Marketing Innovation and Working Conditions were directly and positively related to the Internationalization of Portuguese SMEs. The empirical evidence of the investigation did not support Hypotheses 1 and 3. As observed in the structural model, Product Innovation was only related to Internationalization through Marketing Innovation (mediating variable), while Organizational Innovation was related negatively, through the Working Conditions. The impact of the results obtained on the Human Resources Management of SMEs requires this line of investigation being deepened. There is a need to better analyze and understand the impact of recruitment and retention policies, salary policies and the skills profile on SMEs. Internationalization is a priority of public policy of economic dynamism, and the literature begins to support and return evidence of the impact that changes in the conditions of work provision are producing on Internationalization. The collected sample supports and, in a certain way, confirms that SMEs with high qualification profiles, that practice higher salaries, and that chose to retain their employees using the employment contract, to the detriment of temporary work, are more successful in the expansion process.
Acknowledgements
We acknowledge support of the Editor and the informative and insightful suggestions of Referees.
Additional information
Funding
References
- Stehlík, M., Helperstorfer, C., Hermann, P., Šupina, J., Grilo, L. M., Maidana, J. P., Fuders, F., Stehlíková, S. (2017). Financial and risk modelling with semicontinuous covariances. Inf. Sci. 394–395:246–272. DOI: 10.1016/j.ins.2017.02.002.
- Crum, M. M. (1956). On positive definite functions. Proc. London Math. Soc. s3-6(4):548–560. DOI: 10.1112/plms/s3-6.4.548.
- Governo de Portugal (2014). Acordo de Parceria 2014-2020 Portugal 2020. Lisboa, Portugal: Documentação oficial do governo de Portugal.
- Governo de Portugal (2014). Decreto-lei n. ° 137/2014.
- QREN (2011). Plano global de avaliação do QREN e dos programas operacionais 2007-2013. Lisboa, Portugal: QREN Portugal; 2007–2013.
- Agência para o Desenvolvimento e Coesão, IP (2018). Relatório de avaliação dos FEEI no desempenho das empresas Portuguesas. Lisboa, Portugal: ISCTE - IUL. Technical report.
- Comissão Europeia (2011). Relatório Anula Sobre as PME Europeias. Rotterdam, Cambridge: Ecorys.
- Pordata (2020). Pequenas e médias empresas em dimensão. https://www.pordata.pt/Portugal/Pequenas+e+m%C3%A9dias+empresas+em+percentagem+do+total+de+empresas+total+e+por+dimens%C3%A3o-2859)
- Ratten, V., Dana, L.-P., Han, M., Welpe, I. (2007). Internationalisation of SMEs: European comparative studies. IJESB. 4(3):361–379. DOI: 10.1504/IJESB.2007.013257.
- Higón, D. A., Driffield, N. (2011). Exporting and innovation performance: Analysis of the annual small business survey in the UK. Int. Small Bus. J. 29(1):4–24. DOI: 10.1177/0266242610369742.
- Governo de Portugal (2007). Decreto-lei n. ° 312/2007.
- Governo de Portugal (2008). Decreto-lei n. ° 74/2008.
- Zahra, S. A. (2005). A theory of international new ventures: A decade of research. J. Int. Bus. Stud. 36(1):20–28. DOI: 10.1057/palgrave.jibs.8400118.
- McDougall, P. P., Shane, S., Oviatt, B. (1994). Explaining the formation of international new ventures: The limits of theories from international business research. J. Bus Venturing. 9(6):469–487. DOI: 10.1016/0883-9026(94)90017-5.
- Nassimbeni, G. (2001). Technology, innovation capacity, and the export attitude of small manufacturing firms: A logit/tobit model. Res. Pol. 30(2):245–262. DOI: 10.1016/S0048-7333(99)00114-6.
- Sacks, J., Ylvisaker, D. (1966). Designs for regression problems with correlated errors. Ann. Math. Statist. 37(1):66–89. DOI: 10.1214/aoms/1177699599.
- Yaglom, A. M. (1957). Some classes of random fields in n-dimensional space, related to stationary random processes. Theory Probab. Appl. 2(3):273–320. DOI: 10.1137/1102021.
- Reinartz, W., Henseler, J., Haenlein, M. (2009). An empirical comparison of the efficacy of covariance-based and variance-based sem. Int. J. Res. Market. 26(4):332–344. DOI: 10.1016/j.ijresmar.2009.08.001.
- Portugal 2020 (2020). Lista de operações apoiadas – à data de 30 de setembro de 2020. compete 2020 – programa operacional competitividade e internacionalização. Report.
- Programa Compete 2020 (2020). Lista de projectos aprovados. Report.
- Hair, J. F., Hult, G. T. M., Ringle, C. M., Sarstedt, M., Danks, N. P., Ray, S. (2022). Partial Least Squares Structural Equation Modeling (PLS-SEM) Using R. Cham: Springer.
- Babakus, E., Mangold, G. (1992). Adapting the servqual scale to hospital services: An empirical investigation. Health Serv. Res. 26(6):767–786.
- Jantunen, A. (2005). Knowledge-processing capabilities and innovative performance: An empirical study. Eur. J. Innov. Manag. 8(3):336–349. DOI: 10.1108/14601060510610199.
- Ribau, C. P., Moreira, A. C., Raposo, M. (2017). SMEs innovation capabilities and export performance: An entrepreneurial orientation view. J. Bus. Econom. Manag. 18(5):920–934. DOI: 10.3846/16111699.2017.1352534.
- Hair, J. F., Hult, G. T. M., Ringle, C. M., Sarstedt, M. (2016). Primer on Partial Least Squares Structural Equation Modeling (PLS SEM), 2nd edition. Thousand Oaks, CA: SAGE Publications, Inc.
- Benitez, J., Henseler, J., Castillo, A., Schuberth, F. (2020). How to perform and report an impactful analysis using partial least squares: Guidelines for confirmatory and explanatory is research. Inform. Manag. 57(2):103168. DOI: 10.1016/j.im.2019.05.003.
- Ringle, C. M., Wende, S., Becker, J. M. (2015). Smartpls 3. Boenningstedt, Germany: SmartPLS GmbH.
- Ringle, M., Wende, S., Will, A., Gudergan, S. P. (2008). Confirmatory tetrad analysis in PLS path modeling. J. Bus. Res. 61(12):1238–1249. DOI: 10.1016/j.jbusres.2008.01.012.
- Stone, M. (1974). Cross-validatory choice and assessment of statistical predictions. J. R. Stat. Soc. Ser. B (Methodol). 36(2):111–133. DOI: 10.1111/j.2517-6161.1974.tb00994.x.
- Geisser, S. (1974). A predictive approach to the random effect model. Biometrika. 61(1):101–107. DOI: 10.1093/biomet/61.1.101.
- Abramowitz, M., Stegun, I. A. (1965). Handbook of Mathematical Functions with Formulas, Graphs, and Mathematical Tables. New York: Dover Publications Inc.
Appendices
Proof of Theorem 2.1
We use Theorem of Yaglom, 1957 [Citation17]: C(t) to be the covariance function of a mean square continuous, isotropic random field in it is necessary and sufficient that
(4)
(4)
where
is bounded, non-decreasing function and J0 is the Bessel function of the first kind of order 0 (see Abramowitz and Stegun [Citation31]).
As we defined in relation Equation(1)(1)
(1) , we have
where K is a covariance of isotropic random field satisfying Sacks-Ylvisaker conditions A,B,C) and
Thus, condition a is verified, since
Now, we have according to Equation(4)(4)
(4)
for some bounded and non-decreasing function
Let
be the first minimum of J0 at R+ (see [Citation31]). Then we define a function
for
and
for all
We define the covariance kernel
by
Notice that
is bounded and non decreasing and thus
is according to Equation(4)
(4)
(4) the covariance kernel of isotropic random field.
Let us have then
for all
(we can neglect
since for such value is
) Thus we have
and
is non-increasing.
Finally, let us verify c) Employing the Lebesgue’s Dominated Convergence Theorem and fact that
we have
□
Proof of Theorem 2.2
For the multidimensional and isotropic field we have representation (see Yaglom [Citation17]) for every entry of covariance matrix in the form
where
Thus we construct
analogously with Theorem 2. □