
 ?Mathematical formulae have been encoded as MathML and are displayed in this HTML version using MathJax in order to improve their display. Uncheck the box to turn MathJax off. This feature requires Javascript. Click on a formula to zoom.
ABSTRACT
The evaporation of a sessile droplet is here investigated numerically with a design of experiment approach. Boundary conditions are chosen based on forced convection in humid air, i.e., mimicking the conditions inside a dishwasher. Computational fluid dynamic simulations of an axisymmetrical droplet placed on a heated plate show that relative humidity, initial contact angle, plate temperature, and temperature difference between plate and air all have significant effect on the initial evaporation rate. For the studied conditions, relative humidity is the most significant factor while the magnitude of the velocity and type of internal flow are insignificant within a 95% confidence interval.
Introduction
Energy efficiency in home appliances has been the target of many studies during the last decades. The research and development has, for example, resulted in a substantial reduction of energy consumption per cycle for dishwashers, with improved drying cycle as one of the focus areas for enhanced energy efficiency.[Citation1] The application of an open adsorption systems was, for example, investigated by Hauer et al.[Citation2] while the effect of the final rinse temperature for a dishwasher with internal air circulation was studied by Jeong and Lee.[Citation3] Bengtsson and Berghel[Citation4] presented a concept study where drying was improved by condensation of moist air on a cold surface inside the dishwasher. To further improve drying and to control deposition of particles withheld in the water, the fundamentals of evaporating sessile droplets are of high importance.
Evaporation of droplets on a hot plate has been studied for numerous setups.[Citation5Citation6Citation7Citation8Citation9Citation10Citation11] Crafton and Black[Citation12] studied evaporation of small water and n-heptane droplets on heated copper and aluminum surfaces experimentally, while the influence of internal Marangoni convection (MC) in heated water droplets were investigated numerically in the work by Ruiz and Black.[Citation7] Increased drying rate due to internal Marangoni flow has been verified numerically by several authors.[Citation13Citation14Citation15] The effect of Marangoni flow in water droplets is, on the other hand, not as clearly manifested experimentally. Marangoni convection was observed in the experiments presented by Thokchom et al.[Citation16] and Wang and Zhao,[Citation17] where heated water droplets were examined, but only a very weak contribution, if any, of Marangoni convection was observed by Savino et al.[Citation18] and Hu and Larson.[Citation19] Small influence of Marangoni convection in water droplets is also in agreement with the findings by Xu et al.,[Citation10] where the effect of substrate size and conduction was further examined.
In addition to internal flow, the initial droplet–substrate contact angle has also been studied. As shown in the work by Chandra et al.,[Citation20] a small contact angle will generally increase the drying rate due to larger contact area and decreased droplet height. A significant increase in lifetime of the droplet with increased contact angle was further observed in the work presented by Schweigler et al.[Citation21] Regarding pinning of the contact line, Deegan et al.[Citation22] found two modes for pure liquids; in the first mode, the base area remained at its initial value, while in the second mode, the contact area diminished with maintained contact angle. The two modes were also observed for the conditions studied by Wang et al.[Citation23].
External flow, temperature, and relative humidity may, in their turn, also play an important role in the evaporation of droplets. Evaporation of sessile droplets in a humid environment was particularly studied experimentally by Cioulachtjian et al.,[Citation24] where saturated moist air and saturated vapor conditions were compared showing a large difference in drying rate. Relative humidity between 50 and 85% was together with several air velocities and temperatures investigated experimentally for sessile droplets in the work by Leqoc et al.,[Citation25] showing that, for the studied conditions, the relative humidity is the most significant factor affecting the drying rate. The importance of relative humidity was furthermore demonstrated in the work by Wu et al.[Citation26]
Natural convection (NC) induced by vapor and heat transport might together with forced convection (FC) increase the transfer coefficients at the droplet surface.[Citation27] Kelly-Zion et al.[Citation28] studied the influence of vapor diffusion and natural convection on the evaporation rate and concluded that diffusion-controlled evaporation underpredicts the evaporation rates attained in their study. Numerically, there are various approaches to model the influence of external flow conditions on the evaporation rate of sessile droplets. For the case of low velocities in the surrounding flow, a common method is to apply a constant Nusselt number (Nu = hd/k) and Sherwood number (Sh = hmd/Dav), corresponding to conduction and diffusion, respectively.[Citation7,Citation13] Mollaret et al.[Citation29] and Strotos et al.[Citation14] both determined the nonconstant mass flux through modeling the diffusion of vapor through Fick’s law. The heated plate was furthermore included in the work by Lu et al.[Citation13] and Strotos et al.[Citation14] In the work by Ljung et al.[Citation30], also the natural convection arising from vapor and heat transfer was accounted for. The influence of local and average heat and mass transfer boundary conditions at the droplet surface was furthermore discussed in Ljung et al.[Citation31] Effect of radiation on the evaporation of water droplets was investigated by Lee et al.[Citation32]
The transient behavior of the evaporation rate is influenced by the interaction between several parameters, e.g., size, droplet surface area, plate temperature, internal heat transfer, etc. For water droplets, experimental results on the evolution of evaporation rate over time are presented in, e.g.,[Citation11Citation12Citation13,Citation29] Mollaret et al.[Citation29] showed a linear behavior of the volume decrease (hence constant evaporation rate) for substrate temperatures of approx. 353 K and above. For colder plates, the linear trends were observed until depinning. Essentially constant evaporation rate for plate temperatures of 333 K and higher was furthermore observed by Crafton and Black.[Citation12] Global linear behavior of volume decrease was furthermore observed in Sobac and Brutin[Citation11] for an initial contact angle of 68° at temperatures of approx. > ≈323 K. At lower temperatures and larger contact angle, a decrease in drying rate during evaporation was observed. The results in Lu et al.[Citation13] indicate a correlation between initial evaporation rate and time of evaporation although there is not a clear linear relationship. Given these results, the work presented in this paper will not account for the transients of drying rate, but rather focus on how different parameters influence the initial evaporation. The work thus aims to numerically disclose how external flow, internal flow, and contact angle influence the evaporation rate of water droplets. Simulations are run with rigid droplet geometries and boundary conditions are selected with the environment in a dishwasher in mind, including natural convection and forced convection in air surrounding the droplet.
Method
All simulations are performed with the Computational Fluid Dynamics (CFD) software ANSYS CFX 15 while the numerical design of experiment (DOE) analysis is conducted through the software MODDE. Fractional factorial design is first adopted to establish significant factors. A cross-correlation function (CCF) model is then applied to investigate interactions between the significant factors. A confidence interval of 95% is used in all analysis.
Modeling of heat transfer and evaporation
The equations describing heat and mass transfer at the droplet surface are here presented while details of the governing equations for transport of air, vapor, and liquid water are displayed in Appendix A. For a droplet subjected to evaporation, the source of energy at the surface may be expressed as
The heat transfer coefficient is derived from
The local evaporation rate at the surface is in its turn determined from Fick’s law according to
The corresponding mass transfer coefficient is calculated from
If the value of hm is known from the literature, previous results, etc., the mass flux may also, in addition to Eq. (4), be determined from Eq. (5), which may furthermore be expressed as the difference in concentration between the saturated vapor at the surface and the surrounding relative saturation as[Citation34]
The saturated pressure, pv,sat, (T) is derived from Antonie’s equation according to Himmelblau and Riggs[Citation35]
Here RS corresponds to the relative humidity, RH, of water vapor in air.
If a temperature gradient exists at the interface of two immiscible fluids, Marangoni convection is initiated as the fluid tends to flow toward areas of higher surface tension. The shear stress, τ, at the interface can be stated as a function of surface tension, σ, and temperature following[Citation36]
Carey[Citation37] presented a correlation of the surface tension following
Geometry
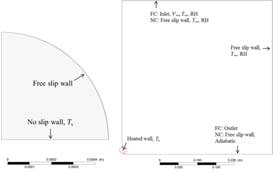
The sessile droplet is placed on a substrate with fix surface temperature, mimicking the experimental setup presented by Crafton and Black.[Citation12] The simulations are run with axisymmetrical geometries, where the droplet boundary is rigid. Gravitational effects on the droplet shape are not included, hence a spherical droplet shape is assumed. The dimensions of the external domain are selected with both NC-driven flows as well as FC in mind. The droplet geometry together with boundary conditions is presented in (left), while the domain surrounding the droplet is presented in (right).
Figure 1. Boundary conditions of the internal droplet geometry (left) and external geometry (right), where the droplet area is circumscribed.
Simulation approach
The executions of simulations are performed in two steps. First heat and mass transfer coefficients (Eqs. (2) and (5)) are estimated at the droplet surface from simultaneous simulations of both droplet and external domain (). The domains are coupled through surface averaged boundary conditions. A limitation in the model implies that the saturation of moisture at the droplet surface must be specified through a source term. The saturation of vapor is therefore controlled through a mass source limited by a step function (i.e., the source term is turned on/off depending on the RH at the surface). To decrease numerical instability, hence nonconverging solutions, the step function is constructed to keep the surface average RH at a maximum of 0.5% from its theoretical value, i.e., RH = 100%, rather than at a fix value. The simulations are run in transient mode until steady state is reached. To increase the numerical accuracy of the evaporation rate and to include also geometrical effects on the transfer coefficients, a second step of simulations is performed. The local heat and mass transfer coefficients retrieved in the simultaneous simulations are then applied to the droplet surface ( left) together with Eqs. (1) and (6), to determine the evaporation rate with local surface effects accounted for. Simulations where only the droplet is considered are run in steady-state mode with an Root mean square (RMS) convergence criterion of 1e−7. A specified blend advection scheme with blend factor 1.0 is applied in all simulations.
Results and discussion
Mesh convergence is first assured and the results are then compared to experiments found in the literature. A DOE approach is applied to the simulations to determine significant factors and interactions between the variables velocity, V∞, relative humidity, RH, surface temperature, Ts, temperature differences, ΔT = Ts − T∞, contact angle, θ, and type of internal flow.
Mesh
A structured, axisymmetrical mesh with one element in the axial direction is considered. To ensure mesh convergence, a grid refinement study is performed with three mesh sizes. The boundary conditions Ts = 333.15 K, ΔT = 5 K, RH = 80%, and V∞ = 0.5 m s−1 are chosen for the study. Natural convection and conduction are accounted for inside the droplet. Results from three consecutive meshes (351,536, 506,471, and 727,841 nodes, respectively) are presented in , showing a difference between Mesh nos. 1 and 3 of less than 1% if area average drying rate, DR, is considered. Mesh no. 3 is therefore used in all further studies. The mesh in the close proximity of the droplet is displayed in .
Figure 2. Mesh no. 3 in the close proximity of the droplet.
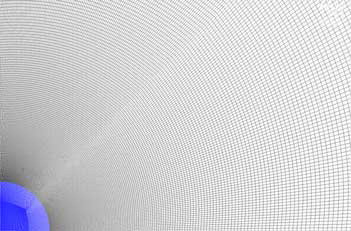
Table 1. Mesh study.
Comparison with experiment
Two separate experiments, Sobac and Brutin,[Citation11] and Crafton and Black,[Citation12,Citation38] are considered for validation of the simulations. Both studies are similar in regard to the geometry of the experimental cell.
The computational domain is first setup according to the experiments by Crafton and Black.[Citation12] Additional information about the experiments can be retrieved in Crafton.[Citation38] During the experiments, water droplets were placed on a cylindrical heater with a polished surface. The diameter of heated surface was 9.53 mm. All measurements were conducted at room conditions and the evaporation rates were determined from the change in droplet volume, which was obtained from videotape recordings. The measurement error for the evaporation rates was approximated to 3.9% for water droplets. The simulations are designed to fit the experimental results of a water droplet evaporating on an aluminum surface at Ts = 333.15 K, for which a rather constant evaporation rate was observed in the experiments. To mimic the experimental work, a contact diameter of 0.98 mm is adopted on a droplet with a fix contact angle, θ = 110°, representing the initial stages of evaporation. The exact temperature and humidity is not specified for each experiment, instead an interval is given. Humidity in the surrounding air is therefore not included. Conduction and natural convection are accounted for in the external flow, and the temperature of the surrounding walls, T∞, is set to be 298.15 K. The internal flow was not examined during the experiments; NC with and without MC is therefore investigated separately in the numerical simulations for comparison.
The temperature and velocity fields surrounding the droplet are together with the internal fields displayed in , where the internal flow includes Marangoni convection. The distribution of moisture around the droplet is in its turn displayed in . Please note that the figures only present the flow in the close proximity of the droplet, hence part of the surrounding domain is excluded to increase visibility. The small velocities in the close proximity of the droplet will lead to a mass transfer coefficient close to diffusion (i.e., Sh = hmd/Dab = 2 for a sphere[Citation39]), hence the effects of flow induced by natural convection and buoyancy in the external flow are small for the present case. Comparisons of the attained DR from simulations are displayed in . The two values of DR from the experiments are acquired from two different measurements[Citation38]. The smallest differences, <5%, are attained when conduction, natural convection, and Marangoni convection are driving the internal flow.
Figure 3. Temperature and velocity fields both within the droplet and in the surrounding domain. Please note that the computational domain is extended 0.4 m above and beside the droplet, hence part of the domain is not visible in the figure.
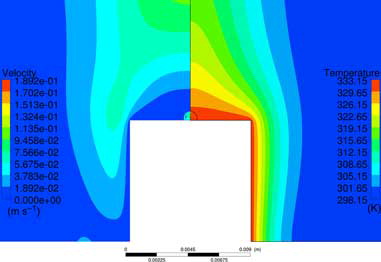
Figure 4. Moisture distribution around the droplet. Please note that the computational domain is extended 0.4 m above and beside the droplet, hence part of the domain is not visible in the figure.
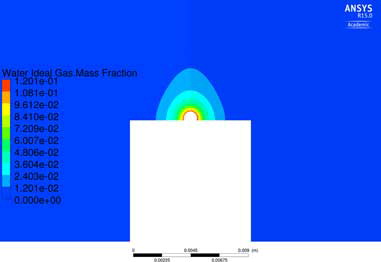
Table 2. Validation of numerical results with different setups.
The details of the second experiment are retrieved in Sobac and Brutin.[Citation11] The studied droplet has a volume of V = 3.64 µL, corresponding to a contact radius of r = 1.44 mm. The horizontal heated surface in Sobac and Brutin[Citation11] shows a difference in radius of only approx. 0.2 mm when compared to[Citation12] and the droplet is therefore applied in the same setup as presented in . Only the horizontal surface is heated in this comparison. The external temperature is set to T∞ = 298.55 K and the humidity RH = 47.5%. The smallest differences between simulation and experiment, <1%, are attained when conduction and natural convection are driving the internal flow, see . A difference of around 20% is observed when Marangoni convection is included in the simulations.
It is not apparent whether Marangoni convection is present in the experiments or not. The numerical model presented by Ruiz and Black,[Citation7] including Marangoni convection, agreed well with the experiments presented in Crafton and Black[Citation12] for a substrate temperature of 95°C. Several experimental investigations have at the same time reported minor influence from Marangoni convection in water droplets, e.g.,[Citation18Citation19]. With the limitations in conformity between the numerical setup and the experiments, the accuracy of the numerical model as presented in is considered sufficient for the scope of this work.
DOE
The geometry presented in , mimicking the experiments in,[Citation12] is now applied to the DOE study. The drying rate, DR, is chosen as response variable in the DOE. The factors of the DOE are chosen based on the humid conditions in a dishwasher, see . MC combined with NC is compared to simulations with only natural convection to clarify the role of internal convective transport on DR. Conduction is included in all simulations. For the first study, 16 setups are evaluated with a resolution IV fractional factorial design to determine significant factors.
Table 3. Factors of the DOE together with corresponding results from simulations.
In the simulations presented in , forced convective flow is applied, moving from top to bottom to ensure axisymmetry (). A no-slip adiabatic boundary condition is applied at the side of the heated surface and an outlet with constant average pressure is applied at the bottom of the geometry.
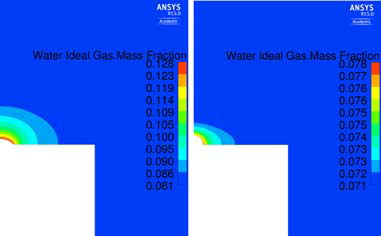
Velocity and temperature fields for the part of the domain closest to the droplet are displayed in for run nr 4 (left) and nr 13 (right) representing the cases with highest and lowest DR, respectively. The moisture distribution for the two setups is displayed in . Although the velocity is higher in run nr 13, run nr 4 will show larger gradients of moisture in the flow surrounding the droplet, and hence a larger DR.
Figure 5. Flow and temperature distribution surrounding the droplet. Left: Run no. 4 presented in (Vin = 0.1 m s−1; Ts = 333.15 K; RH = 80%; ΔT = 5 K, θ = 45°). Right: Run no. 13 presented in (Vin = 0.5 m s−1; Ts = 323.15 K; RH = 100%; ΔT = 2 K, θ = 90°).
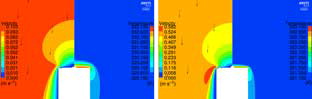
Figure 6. Moisture distribution around the droplet. Left: Run no. 4 presented in (Vin = 0.1 m s−1; Ts = 333.15 K; RH = 80%; ΔT = 5 K, θ = 45°). Right: Run no. 13 presented in (Vin = 0.5 m s−1; Ts = 323.15 K; RH = 100%; ΔT = 2 K, θ = 90°).
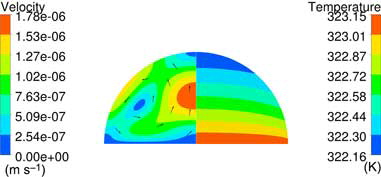
Corresponding internal flow is displayed for run nr. 4 and 13 in and , respectively, showing differences in both magnitude and direction of the flow between the setups. Marangoni convection, , will induce a downward flow at the apex of the droplet while natural convection induces a flow toward the apex, see . In the temperature field furthermore shows behavior close to conduction due to the low internal velocity. The flow directions and temperature contours presented in and comply qualitatively with the vectors and isotherms presented in Ruiz and Black[Citation7] and Lu et al.[Citation13] for the different types of internal flows.
Figure 7. Internal flow in setup 4; Vin = 0.1 m s−1; Ts = 333.15 K; RH = 80%; ΔT = 5 K, θinit = 45°. Conduction, NC, and MC are considered in the internal flow.
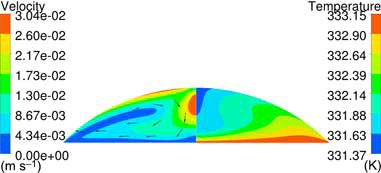
Figure 8. Internal flow in setup 13; Vin = 0.5 m s−1; Ts = 323.15 K; RH = 100%; ΔT = 2 K, θinit = 90°. Conduction and NC are considered in the internal flow.
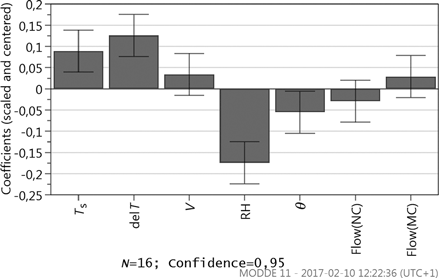
Results from the resolution IV fractional factorial design, where a log transformation is applied to attain normal distribution, further show the influence of the internal transport. Marangoni convection will increase the DR when compared to natural convection; see , where a coefficient plot displays the scaled and centered coefficients of the model terms. The effect is however not significant within a 95% confidence level when compared to the other parameters, i.e., the displayed uncertainty range crosses y = 0. The significant factors are in their turn RH, Ts, ΔT, and θ, see . RH is the most significant factor, followed by ΔT and Ts. The velocity is not significant within the specific intervals. The large influence of RH is furthermore in line with previous findings where humidity has shown a significant role.[Citation24,Citation25]
Figure 9. Coefficient plot corresponding to the DOE setup in .
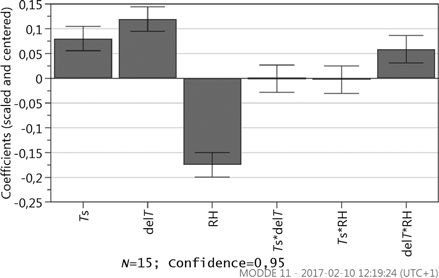
In the study, RH and ΔT are closely coupled since the vapor content is dependent on both variables. To investigate the interactions between factors, a new DOE is designed where all significant factors related to the external flow are included. A CCF design with 15 runs shows that the only interaction significant within a 95% confidence level is the interaction between ΔT and RH, see .
Figure 10. Coefficient plot of a second DOE setup where only significant factors in the surrounding flow are considered. In addition to the factors, also the significance of the interactions is displayed.
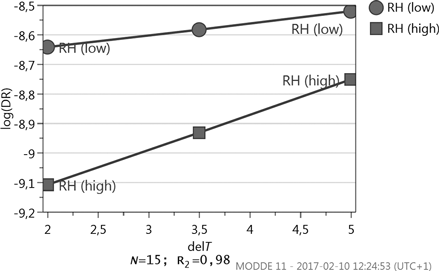
The interaction plot in displays that the influence of ΔT is more pronounced at high RH. An increase in ΔT will thus have a larger effect on the DR for high RH. Investigation of the terms in the expression , which is part of Eq. (6), supports the results. The results presented in furthermore imply that the level of RH is especially important if the ΔT is low.
Figure 11. Plot of the interaction between RH and ΔT.
Conclusion
The drying rate of sessile droplets in humid environment has been numerically investigated. Parameters influencing the evaporation have been examined, and results show that the most significant factor within the specified interval is the relative humidity in the external air. Temperature difference between surface and external air, surface temperature, and initial contact angle is also significant while external and internal velocities are found insignificant with a 95% confidence level. The interaction between temperature difference and humidity was furthermore found significant, i.e., the influence of temperature difference is more pronounced at high humidity. Even though the type of internal flow was found insignificant for the studied setups, both magnitude and direction of the internal flow will show a clear dependence on the transport mechanism, i.e., if the internal transport is governed by Marangoni convection or natural convection. Internal circulation could therefore be of interest in future investigation regarding, e.g., particle deposition. Also transient effects on drying are subjects of future studies.
Nomenclature
| cp | = | specific heat at constant pressure (J kg−1 K−1) |
| d | = | diameter (m) |
| Dav | = | diffusivity (m2 s−1) |
| DR | = | evaporation rate (kg s−1) |
| g | = | acceleration of gravity (m s−2) |
| h | = | convection heat transfer coefficient (W m−2 K−1) |
| H | = | enthalpy (J kg−1) |
| hlg | = | latent heat of vaporization (J kg−1) |
| hm | = | convection mass transfer coefficient (m s−1) |
| k | = | thermal conductivity (W m−1 K−1) |
| = | mass flux (kg m−2 s−1) | |
| p | = | pressure (Pa) |
| q″ | = | heat flux (W m−2) |
| r | = | contact radius (m) |
| R | = | universal gas constant |
| RH | = | relative humidity |
| RS | = | relative saturation |
| SM | = | momentum source term (kg m−2 s−2) |
| t | = | time (s) |
| T | = | temperature (K) |
| u | = | velocity (m s−1) |
| V∞ | = | free stream velocity (m s−1) |
| w | = | molecular weight (kg kmol−1) |
| Greek letters | ||
| αρ | = | thermal expansion (K−1) |
| μ | = | dynamic viscosity (Pa s) |
| ρ | = | density (kg m−3) |
| ρref | = | buoyancy reference density (kg m−3) |
| σ | = | surface tension (N m−1) |
| τ | = | shear stress (N m−2) |
| φ | = | mass fraction |
| θ | = | contact angle |
| Subscripts | ||
| a | = | air |
| abs | = | absolute |
| f | = | fluid |
| l | = | liquid |
| n | = | outward drawn normal |
| s | = | surface |
| sat | = | saturated |
| tot | = | total |
| v | = | vapor |
| ∞ | = | free stream conditions |
Acknowledgments
The authors would like to acknowledge VINNOVA for their financial support and AB Electrolux, Global R&D Dish Care, Stockholm, Sweden, for valuable discussions.
References
- Bansal, P.; Vineyard, E.; Abdelaziz, O. Advances in Household Appliances – A Review. Appl. Therm. Eng. 2011, 31, 3748–3760. DOI: 10.1016/j.applthermaleng.2011.07.023.
- Hauer, A.; Fischer, F. Open Adsorption System for an Energy Efficient Dishwasher. Chem. Ing. Tech. 2011, 83, 61–66. DOI: 10.1002/cite.201000197.
- Jeong, S. W.; Lee, D. H. Drying Performance of a Dishwasher with Internal Air Circulation. Korean J. Chem. Eng. 2014, 31, 1518–1521. DOI: 10.1007/s11814-014-0194-0.
- Bengtsson, P.; Berghel, J. Concept Study of a New Method for Drying Dishware in a Heat Pump Dishwasher. Energy Efficiency 2017, 10, 1–10.
- Kudra, T.; Pan, Y.-K.; Mujumdar, A. S. Evaporation from Single Droplets Impinging on Heated Surfaces. Drying Technol. 1991, 9, 693–707. DOI: 10.1080/07373939108916704.
- Makino, K.; Michiyoshi, I. The Behavior of Water Droplets on Heated Surfaces. Int. J. Heat Mass Transfer 1983, 27, 781–791. DOI: 10.1016/0017-9310(84)90147-9.
- Ruiz, O.; Black, W. Evaporation of Water Droplets Placed on a Heated Horizontal Surface. Trans. ASME 2002, 124, 854–863.
- Girard, F.; Antoni, M.; Faure, S.; Steinchen, A. Evaporation and Marangoni Driven Convection is Small Heated Water Droplets. Langmuir 2006 22, 11085–11091. DOI: 10.1021/la061572l.
- Sodtke, C.; Ajaev, V. S.; Stephan, P. Evaporation of Thin Liquid Droplets on Heated Surfaces. Heat Mass Transfer 2006, 43, 649–657. DOI: 10.1007/s00231-006-0126-6.
- Xu, X.; Luo, J.; Guo, D. Criterion for Reversal of Thermal Marangoni Flow in Drying Drops. Langmuir 2009, 26, 1918–1922. DOI: 10.1021/la902666r.
- Sobac, B.; Brutin, D. Thermal Effects of the Substrate on Water Droplet Evaporation. Phys. Rev. E 2012, 86, 021602. DOI: 10.1103/physreve.86.021602.
- Crafton, E.; Black, W. Z. Heat Transfer and Evaporation Rates of Small Liquid Droplets on Heated Horizontal Surfaces. Int. J. Heat Mass Transfer 2004, 47, 1187–1200. DOI: 10.1016/j.ijheatmasstransfer.2003.09.006.
- Lu, G.; Duan, Y.; Wang, X.; Lee, D. Internal Flow in Evaporating Droplet on Heated Solid Surface. Int. J. Heat Mass Transfer 2011, 54, 4437–4447. DOI: 10.1016/j.ijheatmasstransfer.2011.04.039.
- Strotos, G.; Gavaises, M.; Theodorakakos, A.; Bergeles, G. Numerical Investigation on the Evaporation of Droplets Depositing on Heated Surfaces at Low Weber Numbers. Int. J. Heat Mass Transfer 2008, 51, 1516–1529. DOI: 10.1016/j.ijheatmasstransfer.2007.07.045.
- Barmi, M. R.; Meinhart, C. D. Convective Flows in Evaporating Sessile Droplets. J. Phys. Chem. B 2014, 118, 2414–2421. DOI: 10.1021/jp408241f.
- Thokchom, A. K.; Majumder S. K.; Singh, A. Internal Fluid Motion and Particle Transport in Externally Heated Sessile Droplets. AIChE J. 2016, 62, 1308–1321. DOI: 10.1002/aic.15098.
- Wang, Z.; Zhao, Y. P. In situ Observation of Thermal Marangoni Convection on the Surface of a Sessile Droplet by Infrared Thermal Imaging. J. Adhes. Sci. Technol. 2012, 26, 2177–2188. DOI: 10.1163/156856111x600523.
- Savino, R.; Paterna, D.; Favaloro, N. Buoyancy and Marangoni Effects in an Evaporating Drop. J. Thermophys. Heat Transfer 2002, 16, 562–574. DOI: 10.2514/2.6716.
- Hu, H.; Larson, R. G. Marangoni Effect Reverses Coffee-Ring Depositions. J. Phys. Chem. B 2006, 110, 7090–7095. DOI: 10.1021/jp0609232.
- Chandra, S.; di Marzo, M.; Qiao, Y. M.; Tartarini, P. Effect of Liquid-Solid Contact Angle on Droplet Evaporation. Fire Saf. J. 1996, 27, 141–158. DOI: 10.1016/s0379-7112(96)00040-9.
- Schweigler, K. M.; Ben Said, M.; Seifritz, S.; Selzer, M.; Nestler, B. Experimental and Numerical Investigation of Drop Evaporation Depending on the Shape of the Liquid/Gas Interface. Int. J. Heat Mass Transfer 2017, 105, 655–663. DOI: 10.1016/j.ijheatmasstransfer.2016.10.033.
- Deegan, R. D.; Bakajin, O.; Dupont, T. F.; Huber, G.; Nagel, S. R.; Witten, T. A. Contact Line Deposits in an Evaporating Drop. Phys. Rev. E 2000, 62, 756–765. DOI: 10.1103/physreve.62.756.
- Wang, Z.; Peng, X.-F.; Mujumdar, A. S.; Su, A.; Lee, D.-J. Evaporation of Ethanol-Water Mixture Drop on Horizontal Substrate. Drying Technol. 2008, 26, 806–810. DOI: 10.1080/07373930802046526.
- Cioulachtjian, S.; Launay S.; Boddaert, S.; Lallemand, M. Experimental Investigation of Water Drop Evaporation Under Moist Air or Saturated Vapour Conditions. Int. J. Therm. Sci. 2010, 49, 859–866. DOI: 10.1016/j.ijthermalsci.2009.12.014.
- Lecoq, L.; Flick, D.; Laguerre, O. Study of the Water Evaporation Rate on Stainless Steel Plate in Controlled Conditions. Int. J. Therm. Sci. 2017, 111, 450–462. DOI: 10.1016/j.ijthermalsci.2016.09.030.
- Wu, Y.; Zhang, X.; Zhang, X. Simplified Analysis of Heat and Mass Transfer Model in Droplet Evaporation Process. Appl. Therm. Eng. 2016, 99, 938–943. DOI: 10.1016/j.applthermaleng.2016.01.020.
- Fu, N., Woo, M. W.; Chen, X. D. Single Droplet Drying Technique to Study Drying Kinetics Measurements and Particle Functionality: A Review. Drying Technol. 2012, 30, 1771–1785. DOI: 10.1080/07373937.2012.708002.
- Kelly-Zion, P. L.; Pursellb, C. J.; Vaidyaa, S.; Batra, J. Evaporation of Sessile Drops Under Combined Diffusion and Natural Convection. Colloids Surf. A Physicochem. Eng. Aspects 2011, 381, 31–36. DOI: 10.1016/j.colsurfa.2011.03.020.
- Mollaret, L.; Sefiane, K.; Christy, J. R. E; Veyret, D. Experimental and Numerical Investigation of the Evaporation into Air of a Drop on a Heated Surface. Chem. Eng. Res. Des. 2004, 82, 471–480. DOI: 10.1205/026387604323050182.
- Ljung, A.-L.; Lindmark, E. M.; Lundström, T. S. Influence of Plate Size on the Evaporation Rate of a Heated Droplet. Drying Technol. 2015, 33, 1963–1970. DOI: 10.1080/07373937.2015.1080722.
- Ljung, A.-L.; Lundström, T. S. Heat and Mass Transfer Boundary Conditions at the Surface of a Heated Sessile Droplet. Heat Mass Transfer 2017, 53, 3581–3591. DOI: 10.1007/s00231-017-2087-3.
- Lee, C.; Jang, J.; Hahn, J. W. Theoretical Analysis of Water Droplet Drying on Different Substrates on Liquid Crystal Display Panels Heated with Infrared Radiation. Drying Technol. 2015, 34, 557–562. DOI: 10.1080/07373937.2015.1062025.
- Hahn, D. W.; Ozisik, M. N. Heat Conduction, 3rd ed.; John Wiley & Sons, Inc.: Hoboken, 2012.
- Incropera, F. P.; Dewitt, D. P.; Bergman, T. L.; Lavine, A. S. Fundamentals of Heat and Mass Transfer; John Wiley & Sons, Inc.: Hoboken, 2007.
- Himmelblau, D. M.; Riggs, J. B. Basic Principles and Calculations in Chemical Engineering; Bernard Goodwin: Upper Saddle River, 2004.
- Vargaftik, N. B.; Volkov, B. N.; Voljak, L. D. International Tables of the Surface Tension of Water. J. Phys. Chem. Ref. Data 1983, 12, 817–820. DOI: 10.1063/1.555688.
- Carey, V. Liquid-Vapor Phase-Change Phenomena; Hemisphere Publishing Corporation: New York, 1992.
- Crafton, E. Measurements of the Evaporation Rates of Heated Liquid Droplets. M.Sc. Thesis, Georgia Institute of Technology, Atlanta, 2001.
- Ranz, W. E.; Marshall, W. R. Evaporation from Drops. Chem. Eng. Progress 1952, 48, 173–180.
- ANSYS CFX. ANSYS CFX Solver Modeling Guide, Release 15.0. Ansys, Inc.: Canonsburg, 2013.
Appendix A
The laminar flow of water inside the droplet and mixture of air and vapor surrounding the droplet are governed by the following equations of mass, momentum, and energy
The stress tensor, τ, is determined from
Buoyancy in the air–vapor mixture is accounted for by the source term
The buoyance reference density, ρref, is specified as an approximate average value of the domain density.[Citation40] Natural convection inside the droplet is in its turn derived by the use of Boussinesq model, i.e.,
To calculate the transport of vapor in air, a transport equation is solved following
The mass fraction of air is calculated from
Ideal gas equations of state are applied for density and enthalpy of air and water vapor, i.e.,
Mass fraction weighted average equations are assumed for the material variables cp, μ, and k for the mixture of air and water vapor, here exemplified by µ as