
 ?Mathematical formulae have been encoded as MathML and are displayed in this HTML version using MathJax in order to improve their display. Uncheck the box to turn MathJax off. This feature requires Javascript. Click on a formula to zoom.
Abstract
The majority of the rural areas in developing countries are not connected to the electric grid. Rice production produces a significant amount of rice husk as a byproduct/waste but this waste can be used as a source of energy for drying of the rough rice. The aim of this research was to evaluate the performance and improve the design and operation of a rice husk fueled mixed flow grain dryer for small scale rural farmers using a validated 3-D computational fluid dynamics (CFD) model. The model was applied to predict the airflow and heat and mass transfer characteristics of the designed prototype rough rice dryer. The model took into account the geometrical detail of the dryer assembly, the relevant boundary and initial conditions, and model input parameters. The results identified relatively stagnant regions at the top and the side walls of the dryer. The observed relatively high variation in drying air velocity distribution caused a relatively high variation in drying characteristics of the rice grain. The model was applied to modify the design and operation procedure of the dryer to improve the performance in terms of drying uniformity and drying time. After 2 h drying time, the difference between the maximum and minimum moisture content values for the original and modified design was 12.9% and 8.5%, respectively. There was an exponential relationship between drying time and drying air temperature and specific flowrate. Mixing and recirculation of the grain at 30 min interval significantly improved the uniformity of drying, and the difference between maximum and minimum moisture content after 2 h of drying was clearly reduced to 1.9%. The study indicated the capability of 3-D CFD model to improve the design and operation of mixed flow rice husk fueled dryer to attain the required performance.
1. Introduction
Rice is mostly harvested with a moisture content of up to 25% (wet basis), which is a favorable environment for the growth of pests and molds (fungi) that cause grain spoilage and deterioration, mycotoxin contamination resulting in losses and lowering the germination rate. Dying is the process that reduces the grain moisture content to a level where it is safe for storage (for rice below 14 % moisture content) and it is done by application of heat to prevent the growth of fungi, bacteria, mold, insects and mites.[Citation1] Delays in drying, incomplete drying, or ineffective drying will reduce grain quality and result in losses.[Citation2] Drying is the most important post-harvest process for a fast and safe preservation of agricultural products, but it is also energy-intensive at the same time. Drying of agricultural products is consuming a relatively high amount of energy due to high differences between harvest and storage moisture content, improper dryer design and operation, low drying temperatures, and low levels of pretreatment due to sensitivity to thermal and mechanical stress.[Citation3]
Open sun drying that is commonly practiced by rural small scale rice farmers is associated with several problems such as poor-quality grains, discolorations, and cracking due to direct exposure to UV radiation, rain, dust, untimely drying, and contamination resulting from poor handling facilities.[Citation4] Furthermore, open sun drying is time-consuming, labor-intensive, requires a large area for spreading the product. The operating parameters such as air velocity, relative humidity, drying temperature, and moisture content are uncontrolled.[Citation5] Most commercial mechanical dryers that have the ability to minimize the above problems are not accessible to small scale farmers due to the lack of farmers financial capacity to buy and to cover the cost of fuels/hot air energy sources like electricity/diesel to run these dryers. The use of solar dryers has limitations due to the intermittent solar radiation during night, cloudy and rainy periods.
The mixed flow dryer is one of the commonly used dryers for the drying of grain products due to its relatively high heat and moisture transfer characteristics.[Citation6] Different studies have proved the potential application of batch/continuous mixed flow dryers for grain drying including paddy.[Citation7–12] The dryers commonly use fossil fuels, coal or electricity as an energy source. It is known that fossil fuels and coal are expensive and environmentally unfriendly. Most of the rural areas in developing countries, such as Ethiopia are not connected to the main power grid, so electricity is not a viable source of energy in this part of the world. This shows that to get the benefit from the relatively high drying rate of mixed flow dryers for the small scale rice farmers, it is important to develop a dryer that could work with a sustainable, cheap and reliable source of energy. In this respect, there have been encouraging efforts to develop different types of biomass based grain dryer.[Citation5,Citation13–18] But studies on the development of biomass based mixed flow rice dryers are limited. Rice production generates a significant amount of husk that is considered as a byproduct/waste, almost 0.3 kg of husk per kg of milled white rice.[Citation19] This is a freely available and cheap energy source that can substitute the expensive and environmentally unfriendly fossil fuels, and this can generate the required drying energy in the rural off grid areas.
Suboptimal design and operation of mixed-flow dryers can cause inhomogeneous drying due to non-uniform drying airflow, temperature, and humidity distribution. The optimization can be performed using experimental or mathematical modeling methods. The large number of biotic and abiotic factors and their interrelationships that are commonly observed in agricultural products make full-scale experimental studies expensive and time consuming, and the generalizations needed to predict the variables accurately are difficult to make.[Citation20] Nowadays due to the availability of powerful computers at a reasonable price, the use of mathematical modeling is becoming an alternative to the experimental method. CFD is one of the mathematical models that have been extensively used to study the effects of different parameters that are related to the design and operation of grain dryers, product characteristics, and environmental conditions.[Citation9,Citation21–33] Most of the previous CFD models for mixed flow grain dryers used 2-D models, and the models were mainly used to predict the drying air properties.[Citation9,Citation22–25,Citation27,Citation29,Citation33] There is a lack of knowledge on the development of validated 3D CFD models for mixed-flow grain dryers that could simultaneously predict airflow and heat and mass transfer properties. Aside from that, information is missing on the application of such a comprehensive validated 3-D CFD model to evaluate the performance and to improve the design and operation of mixed flow grain dryers.
The aim of this study was to evaluate and improve the performance of a pilot rice husk fueled mixed flow rice dryer for small scale farmers using a validated 3-D computational fluid dynamics (CFD) model. The model was applied to improve the performance of the original dryer design[Citation34] by analyzing the effects of drying air supply configuration, drying air temperature, and flowrate, as well as grain mixing and recirculation on drying uniformity and drying rate.
2. Materials and methods
2.1. Pilot dryer
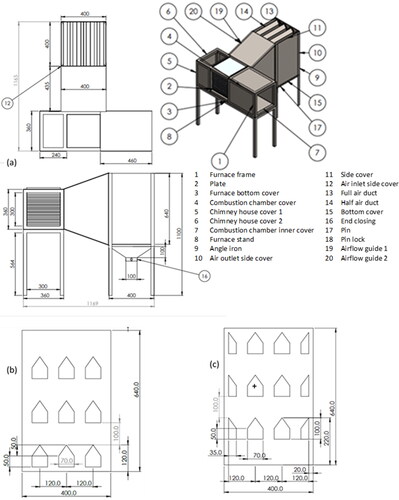
A pilot rough rice mixed flow dryer with a capacity of 30 kg was designed based on procedures that were reported on relevant literatures.[Citation11,Citation12,Citation35–40] The geometrical details of the designed dryer that include the mixed flow dryer section with air inlet and outlet ducts, rice husk furnace, and cross flow plate heat exchanger are given in . One 40 Watt 200 mm fan was placed to force the atmospheric air through the heat exchanger, and another fan of the same type was used to suck the exhaust air through the chimney. Solar panels were used to drive the fans. The dryer assembly was constructed and its performance was tested at Bahir Dar Institute of Technology, Bahir Dar, Ethiopia.
Figure 1. Geometrical details of the designed pilot scale mixed flow rough rice dryer; (a) full assembly, (b) air inlet ducts, (c) air outlet ducts; + air velocity measurement point.
2.2. Rough rice
The rough rice variety that was used in this study was NERICA-4 that was grown at Fogera woreda (11°58′N, 37°41′E and 2094 m above sea level on average), Amhara region, Ethiopia. The drying experiments used rough rice with an initial moisture content of 21.4% (wet basis).
2.3. CFD model development
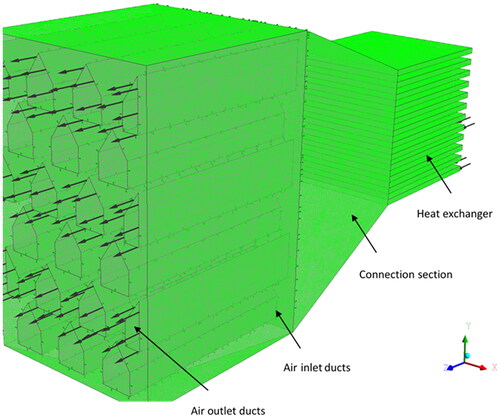
The model of the pilot rice dryer was developed using ANSYS CFX 2020 R2 (ANSYS Inc., Canonsburg, Pennsylvania, USA). The model used the detailed geometry of the dryer section, heat exchanger and connection section (). In the drying section, the air inlet and outlet ducts were measured explicitly. The rice grain bed zone was modeled as a porous region using the corresponding porosity, rice density, pressure loss parameters and heat and mass transfer characteristics. The other regions were modeled as fluid (air) zones.
Figure 2. 3D computational domain and mesh of the pilot dryer assembly.
2.3.1. Model equations
The flow characteristics inside the dryer assembly was modeled using the Reynolds-Averaged Navier–Stokes (RANS) equation combined with k-ε turbulence model. The continuity, momentum and heat transfer equations for the fluid (air) zone are [Citation31,Citation32,Citation41]:
(1)
(1)
(2)
(2)
(3)
(3)
Where ui and uj are air velocity components (m s−1), p is pressure (Pa), Ta is air temperature (K), Tg is grain (rice) temperature (K), ε is grain bulk porosity, ρa is air density (kg m−3), µa is air dynamic viscosity (kg m−1 s−1), is air thermal conductivity (W m−1 K−1), Cpa is air heat capacity (J kg−1 K−1), hh convective heat transfer coefficient (W m−2K−1), as is specific surface area of the grain (m−1),
and
are fluctuating velocity components (m s−1), and Sm is the momentum source term (kg m s−1). The momentum source term was calculated using Darcy-Forchheimer equation[Citation26,Citation31]:
(4)
(4)
Where K denotes the Darcy permeability (m2) and β is the Forchheimer drag coefficient (m−1).
The transport of water vapor in the drying air was modeled by using a scalar transport equation[Citation32,Citation41]:
(5)
(5)
Where Cv is the concentration of water vapor (kg m−3), Da is the molecular diffusivity of water vapor (m2 s−1), Dt is the turbulent diffusivity of water vapor (m2 s−1) and Sv is the water vapor source term (kg m−3 s−1). The source term for water vapor was calculated using the following equation[Citation32,Citation41]:
(6)
(6)
Where Cg is grain side water vapor concentration (kg m−3), Ca is air side water vapor concentration (kg m−3), hm is overall mass transfer coefficient (m s−1), and as is the specific surface area of the rough rice kernel. To determine Cg and Ca the following equations were applied[Citation41]:
(7)
(7)
(8)
(8)
Where aw is the water activity of the rough rice grain, Psat is the saturated pressure of water (Pa), RH relative humidity of air, R is the universal gas constant (m3 Pa K−1 mol−1), and Mw is the molecular weight of water (kg mol−1).
The heat and moisture transfer in the rough rice grain were modeled as a solid zone using EquationEquations (9)(9)
(9) and Equation(10)
(10)
(10) , respectively, as[Citation32,Citation41]
(9)
(9)
(10)
(10)
Where ρg is the product density (kg m−3), λg is the product thermal conductivity (W m−1 K−1), and Cpg is the product heat capacity (J kg−1 K−1). The term Cw denotes the concentration of moisture in the rough rice (kg m−3), Dw is the effective diffusivity of moisture in the rough rice (m2 s−1), and Se is the energy source term (W m−3) due to water evaporation, which was calculated as [Citation31,Citation32]:
(11)
(11)
where L is the latent heat of evaporation (J kg−1).
In the grain bulk region, the corresponding rice bulk porosity () was applied, whereas for modeling airflow in the free air zone regions (heat exchanger, connection section, air inlet duct and air outlet duct), the porosity was taken as 1 and Sm was taken as 0.
2.3.2. Model parameters
The drying air was assumed as an ideal gas, and the corresponding values of air density, viscosity, heat capacity and thermal conductivity were used. The density, bulk porosity, heat capacity and thermal conductivity of the rough rice grain was expressed as a function of moisture content [Citation31]:
(12)
(12)
(13)
(13)
(14)
(14)
where Md is the moisture content (kg kg−1, dry basis).
The overall water vapor mass transfer coefficient (hm) (m s−1) consisted of the rice hull (hms) and air side external mass transfer (hma) coefficients:
(15)
(15)
Air side heat transfer (hh) (W m−2 K−1) and air side water vapor mass transfer (hma) (m s−1) coefficients were calculated using heat and mass analogy [Citation42–44]:
(16)
(16)
(17)
(17)
Where dp is the equivalent diameter of rough rice (m), and Re, Pr and Sc are the Reynolds, Prandtl and Schmidt numbers, respectively.
The water mass transfer coefficient through the rice hull (hms) was calculated from the moisture diffusivity[Citation41] as
(18)
(18)
where Dw denotes the effective diffusivity of moisture in the rough rice (m2 s−1) and lh is the thickness of the rice hull (m). The effective diffusivity of moisture in the rough rice was expressed as a function of temperature using the Arrhenius equation
(19)
(19)
Where Do is the reference diffusivity of moisture in the rough rice (m2 s−1) and Ea is the activation energy of moisture diffusion (J mol−1).
The water activity (aw) was expressed as a function of temperature and moisture content using the Strohman-Yoerger equations[Citation45] as
(20)
(20)
Where C1, C2, C3, and C4 are constants and M is the moisture content (Percentage dry basis). The saturated pressure of water (Psat) was determined using the following equation[Citation46]:
(21)
(21)
The latent heat of evaporation (L) was defined as a function of grain temperature[Citation42] as
(22)
(22)
The density (ρg), equivalent diameter (dp) and specific surface area (as) of the rough rice kernel was calculated from the reported dimension data of a, which was conducted on the same rice variety that was grown in the same research area with moisture content of 11.7% (wet basis).[Citation47] The values of material properties and constants used in the model are presented in .
Table 1. Values of material properties and model parameters.
2.3.3. Model initial and boundary conditions
The initial moisture content of the rough rice was measured using Riceter F501 moisture meter (Kett, CA, USA) with a sensitivity of 0.1%. The average initial moisture content was 21.4% (wet basis). The initial temperature of the grain was taken as the same as the atmospheric temperature. The atmospheric air temperature and relative humidity at the research site were measured using a temperature-relative humidity data logger (HOBO UX100-011 temp/RH logger, Bourne, USA) with a measurement range of −20–70 °C and 10–90% RH, accuracy ± 0.21 °C and ± 2.5% RH. The average atmospheric temperature and relative humidity was 27.3 °C and 61.1%, respectively.
Atmospheric air was introduced at the inlet of the cross flow plate heat exchanger using a velocity boundary condition. The velocity of the air at inlet of the heat exchanger were measured by Kestrel 5500 Weather Meter digital anemometer with a sensitivity of 0.1 m s−1 (KestrelMeters.com, PA, USA). The measured velocity and the calculated air flowrate was 0.32 m s−1 and 0.0234 m3 s−1. The surfaces of the plates of the heat exchanger were modeled as a no slip walls with the corresponding surface temperatures. The surface temperature was assumed to be the average of the airflow temperatures at the inlet (exit of furnace) and outlet of the heat exchanger (inlet of exhaust pipe), respectively. The temperatures were measured using K type thermocouples (–270 to 1260 °C with an accuracy of ±1.5 °C). The measured average temperature was 167.9 °C. Air inlet and outlet ducts were modeled as no slip walls.
2.3.4. Computational mesh and simulation procedure
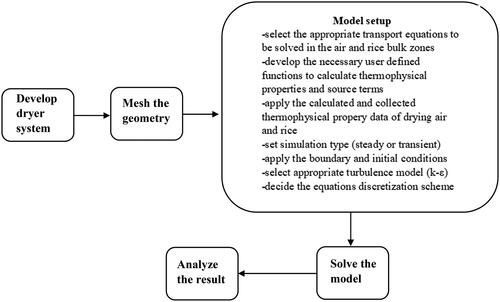
The full scale geometry of the dryer and heat exchanger with the connection section was developed () and discretized using a tetrahedral hybrid mesh (). Around 12 million elements were used to discretize the simulation domain. The selection was based on a mesh sensitivity study that was conducted on the predicted volumetric average grain temperature, air humidity and grain moisture content. First, a steady state simulation was conducted to predict the air flow distribution in all modeled components of the dryer assembly, followed by a transient simulation using a time step of 120 s to predict the air temperature, grain temperature, air humidity and grain moisture distributions. A sensitivity study of the solution was conducted for different time step values (60, 120, 300, and 600 s). The equations were discretized using high resolution scheme. As a convergence criterion, a root mean residual error below 10−5 for all equations was used. The simulation was done using a 64-bit, Intel® Zeon® W-2145 CPU, 3.70 GHz, 256 Gb RAM, Windows 10 computer. Total time of calculation was 2 h. The details of the modeling procedure are given in .
Figure 3. Detail flow diagram of the modeling procedure.
2.3.5. Model validation experiment
Rough rice drying experiments were conducted using the developed pilot scale dryer () at Bahir Dar Institute of Technology, Bahir Dar, Ethiopia. During the drying experiments, the moisture content of the rough rice as measured at the air outlet side of the dryer in the middle height of the dryer every 10 min using a Riceter F501 moisture meter (Kett, CA, USA) with a sensitivity of 0.1%. For each time interval, triplicate measurements were conducted. In addition, the drying air temperatures were measured at the inlet and outlet ducts of the mixed flow dryer using temperature-relative humidity data logger (HOBO UX100-011 temp/RH logger, Bourne, USA). These measurements were conducted in the center of the central inlet duct and in the center of the central right hand outlet duct. The velocity of the drying air at the center of the central left side outlet duct () was measured using Kestrel 5500 Weather Meter digital anemometer with a sensitivity of 0.1 m s−1 (KestrelMeters.com, PA, USA).
3. Results and discussion
3.1. Airflow distribution
The heated air from the heat exchanger was passed through the connection section and was introduced into the dryer via the inlet ducts. The velocity of the air at the entrance of inlet and exit of the outlet ducts was not uniform (). At the entrance of the inlet ducts, the top ducts had higher velocity than the bottom ducts, but there was no significant difference in inlet velocity along the width (left to right) of the dryer. The average velocity at the entrance of the top and bottom inlet ducts was 0.82 m s−1 and 0.59 m s−1, respectively. At the exit of the outlet ducts, the top ducts showed lower velocity than the bottom ducts with a corresponding average value of 0.63 m s−1 and 0.81 m s−1, respectively. The velocity of the drying air within the rice grain bulk was much lower than the duct velocity, it was in the range of 0.004–0.57 m s−1. There was a decrease in air velocity as it crossed the grain bulk to travel to the outlet ducts. The uniformity of air velocity within the grain bulk was better near the central position (along the depth) of the dryer compared to the inlet and outlet section (). The velocity at the top of the dryer was relatively lower compared to the other sections; the air was nearly stagnant with a velocity of about 0.004 m s−1. This was due to the position of the top outlet ducts, the drying air from the inlet ducts traveled to the region with low resistance (the outlet ducts) before crossing the top regions. There was also a low velocity region near the wall of the dryer (the region besides the half outlet ducts).
Figure 4. Drying air velocity distribution: (a) velocity vectors at the dryer assembly (heat exchanger, connection, and dryer) along the central inlet duct; (b) velocity contour at different sections of the dryer (1 cm from inlet, center, and 1 cm from outlet).
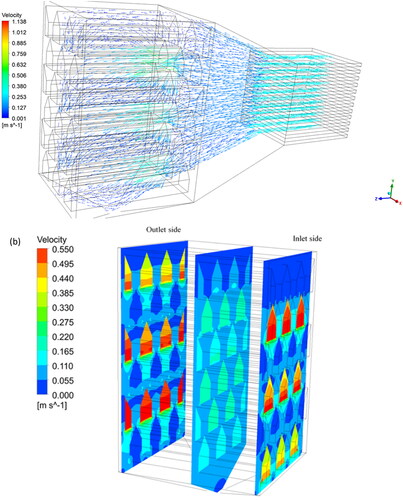
There was a good agreement between the measured and predicted air velocities at the entrance and exit sections of the dryer. At the measuring points of the dryer, the measured entrance and exit air velocity was 0.62 m s−1 and 0.55 m s−1, respectively. The corresponding predicted velocity was 0.74 m s−1 and 0.63 m s−1, respectively. There was an over prediction with an average absolute relative error of 16.96 %.
3.2. Drying air temperature and relative humidity distribution
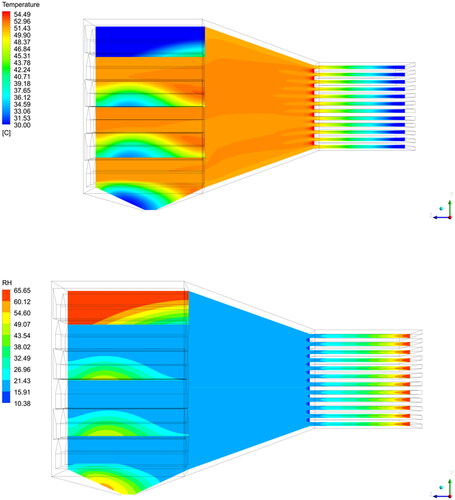
The temperature and relative humidity distributions of the drying air along the depth central plane after 1 h of drying are shown in . The drying air that was heated by the heat exchanger had an average temperature of 53.1 °C and average relative humidity (RH) of 16.9%. Regions that had relatively lower drying air velocity had relatively lower air temperature and higher RH. Corresponding to the lowest air velocity, the lowest air temperature and the highest RH was at the top of the dryer. After 1 h of drying, the minimum and maximum temperature and RH of the air in the dryer was 26.9 °C and 52.6 °C, and 17.3% and 65.7%, respectively. The temperature of the drying air was decreasing as it traveled from inlet to outlet sides. There was a relatively wide difference both in temperature and RH of the drying air between regions in the dryer. The predicted temperature of the drying air was compared to measured values. At the measuring points, the measured temperature of the incoming and exit air was 49.5 °C and 44.9 °C, respectively. The corresponding predicted values were 51.3 °C and 47.9 °C, respectively. There was an over prediction with an absolute relative error of temperature prediction of 6.42%.
Figure 5. Drying air temperature (top) and relative humidity (bottom) distribution in the dryer assembly (heat exchanger, connection, and dryer) along the central inlet duct after 1 h of drying.
3.3. Rice grain temperature and moisture content distribution
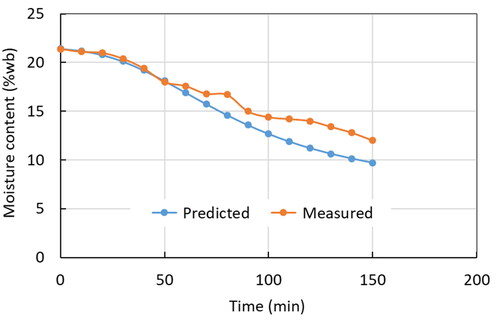
The temperature and moisture distributions of the rice bulk after 1 h of drying at different positions along the depth of the dryer are shown in . Similar to trend that was shown in the drying air temperature distribution, the lowest temperature of the grain was located at the top section of the dryer, and this was the region with the highest moisture content of the rice grain. The main cause of the relatively low drying rate at the top and side sections of the dryer was the relatively low drying airflow that was observed at that sections of the dryer. There was a decrease in drying rate and grain temperature from inlet to outlet sides of the dryer. After 1 h of drying, the lowest and the highest grain temperature and moisture content were 28.4 °C and 52.9 °C, and 9.8% and 21.1%, with a volumetric average temperature and moisture content of 46.8 °C and 16.9%, respectively. It can be seen that the variability in grain temperature and moisture content was relatively big. The predicted drying kinetics of the rice grain was compared to the measured values (). The model over predicted the drying rate with an absolute relative error of 9.11%. This was a relatively good agreement.
Figure 6. Rice grain temperature (left) and rice grain moisture content (% wb) (right) distribution at different sections of the dryer (1 cm from inlet, center, and 1 cm from outlet) after 1 h of drying.
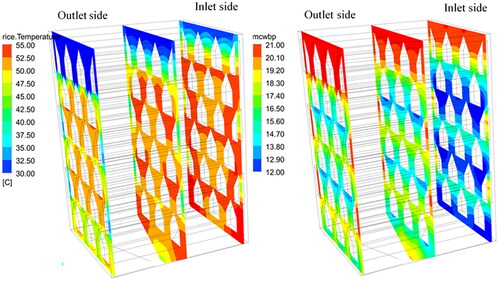
Figure 7. Comparison between predicted and measured moisture content of rice grain with drying time.
3.4. Design modification
The variation that was observed in predicted drying air velocity, air temperature, air RH, grain temperature and grain moisture content was relatively high. This shows the need for improvement of the current conceptual design of the dryer. It was clear from the result that the main cause of the relatively high variability was the unevenness of the drying airflow distribution. To improve that, some portion of the air was introduced at the top of the dryer by creating a 10 cm gap, and the gap between the half outlet ducts and the dryer walls was removed. The predicted airflow, grain temperature and grain moisture content distributions are given in , respectively.
Figure 8. Drying air velocity distribution for the modified dryer: (a) velocity vector at the dryer assembly (heat exchanger, connection, and dryer) along the central inlet duct; (b) velocity contour at different sections of the dryer (1 cm from inlet, center, and 1 cm from outlet).
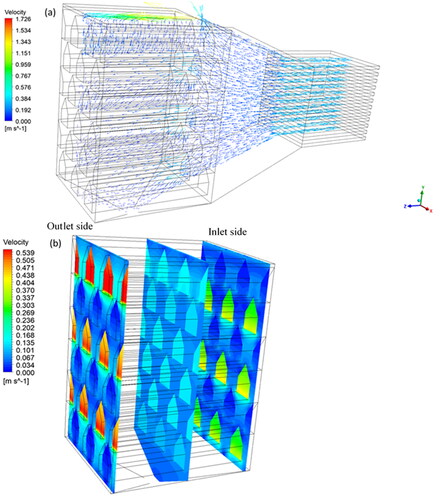
Figure 9. Rice grain temperature (a) and rice grain moisture content (% wb) (b) distributions at different sections of the dryer (1 cm from inlet, center, and 1 cm from outlet) after 1 h of drying using the modified dryer.
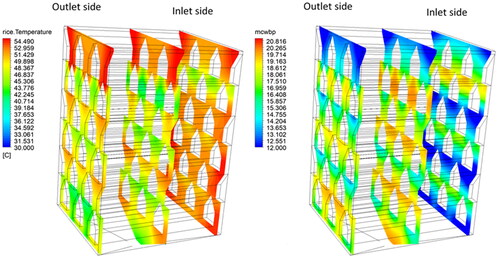
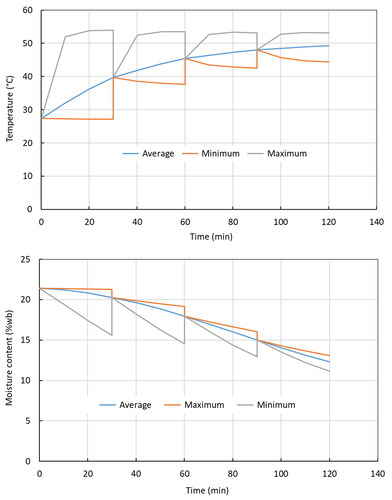
Figure 10. Volumetric average, maximum, and minimum values of rice grain temperature with respect to drying time for the original (left) and modified (right) designs.
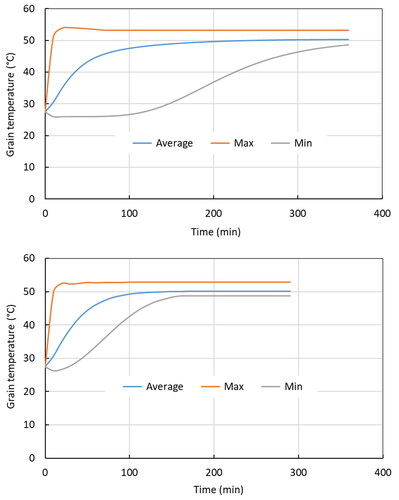
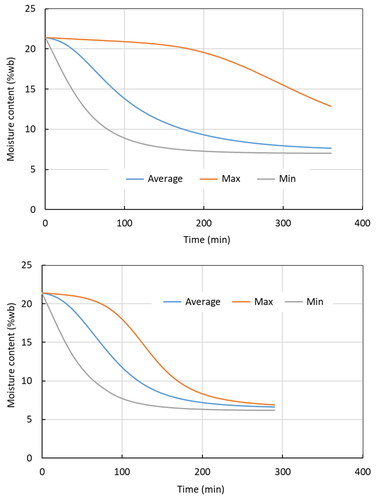
Figure 11. Volumetric average, maximum, and minimum values of rice moisture content with respect to drying time for the original (left) and modified (right) designs.
The modified design improved drying airflow uniformity. The results show that this modified design improved the airflow in stagnant zones that were observed in the original design (). There was no significant difference (at 95 % confidence interval) in air velocity between the ducts at the entrance of the inlet ducts (). At the exit of the outlet ducts, there was a slightly higher velocity at the top ducts due to the airflow that was introduced at the top of the dryer. The uniformity of the velocity of the drying air within the bulk was better in this modified design compared to the original one.
Similar to the airflow, the modified design improved grain temperature and moisture content uniformity (). After 2 h of drying time, the grain temperature was in the range of 45.7–52.8 °C and 28.6–53.1 °C with a volumetric average value of 49.8 °C and 48.24 °C for the modified and original designs, respectively. After 2 h of drying time, the grain moisture content was in the range of 7.1–15.6% and 7.3–20.2% with volumetric average moisture content of 10.0% and 11.2% for the modified and original designs, respectively. The modified design improved the drying rate of the rice grain in addition to the uniformity ().
3.5. Effect of operating parameters
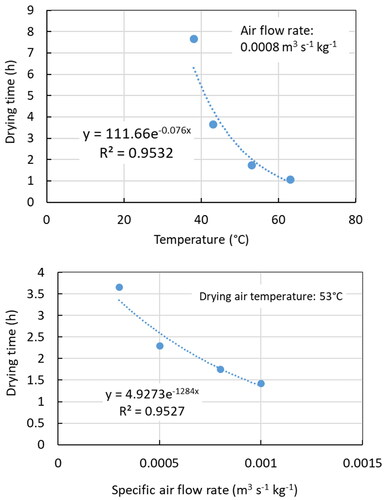
The model was applied to study the effect of dryer operating parameters that include drying air temperature, specific flowrate (flowrate per kg of rice), as well as grain mixing and recirculation. The drying rate of rice increased with an increase in drying air temperature and specific flowrate (). This was associated with an increase in heat and mass transfer process by increasing temperature and flowrate. Targeting a volumetric average moisture content of 12% as an optimum storage moisture content,[Citation2] the drying time was calculated for different operating conditions. As can be seen in , the drying time decreased exponentially as the drying air temperature and specific flowrate increased. To study the effects of drying air temperature and velocity on the quality of rice,[Citation48] used a similar drying air temperature range and observed an increase in breakage with air temperature. This indicates the need to combine such drying time study with grain quality study to get optimum operating conditions.
Figure 12. Effects of drying air temperature at a specific air flowrate of 0.0005 m3 s−1 kg−1 (top) and drying air specific flowrate at a temperature of 53 °C (bottom) on the drying characteristics of rough rice grain.
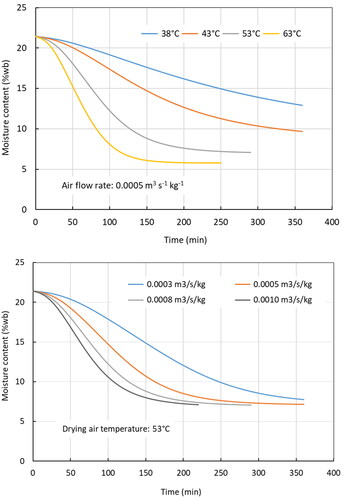
Figure 13. The relationship between grain drying time and drying air temperature at a specific air flowrate of 0.0008 m3 s−1 kg−1 (top); the relationship between grain drying time and drying air specific flowrate at a temperature of 53 °C (bottom).
Batch drying processes are often associated with a wide variation in the product moisture content distribution after drying. Especially, batch-wise operated mixed-flow dryers have the disadvantage that the grain near the hot inlet air ducts is extremely over-dried due to the stagnant bed without any particle movement. In addition to that, high residence times combined with high temperatures result in thermal damage and quality losses. Therefore, the effects of mixing and recirculation were simulated with respect to uniformity of grain moisture content (). For it, a time interval of 30 min was chosen for grain recirculation. The study was conducted using the original dryer design by neglecting the heat losses during the mixing and recirculation process. As the results show, mixing and recirculation significantly improved the drying uniformity. After 2 h of drying time, the minimum and maximum grain temperatures and moisture contents were 44.4 and 53.1 °C and 11.2 and 13.1%, respectively. Recirculation batch dryers working in a similar principle have been recommended for better grain quality.[Citation2]
Figure 14. Average, maximum, and minimum values of rice temperature (top) and moisture content (bottom) as a function of drying time for a mixing and recirculation interval of 30 min, a specific air flowrate of 0.0008 m3 s−1 kg−1 and an air temperature of 53 °C.
4. Conclusion
In the present study, a rice husk fueled mixed flow grain dryer for small-scale rural farmers was designed and evaluated by using a computational fluid dynamics (CFD) model. Based on this model, the performance of the pilot dryer and the effects of different design and operating variables were investigated. As the results show, there was a good agreement between measured and predicted temperatures, air velocities and moisture contents. The drying characteristics were affected by the dryer design and operating conditions. The study observed a relatively high variability in drying characteristics for the original design. The main cause of the variation was the non-uniform drying air velocity distribution, particularly the presence of the relatively stagnant region at the top of the dryer. The validated model was applied to recommend a modified dryer design and operating procedure that could improve drying uniformity. It was possible to remove the stagnant region at the top of the dryer and improve the drying uniformity and drying rate. The drying time showed an exponential decrease with an increase in drying air temperature and air specific flowrate. It was also possible to improve the uniformity of drying by grain mixing and recirculation at 30 min interval. The study clearly showed the capability of 3-D CFD modeling in optimizing the design and operation of mixed flow grain dryers.
| Nomenclature | ||
| as | = | Specific surface area of the grain, m−1 |
| aw | = | Water activity of the rough rice grain |
| C1, C2, C3, and C4 | = | Constants |
| Ca | = | Air side water vapor concentration, kg m−3 |
| Cg | = | Grain side water vapor concentration, kg m−3 |
| Cpa | = | Specific heat capacity of air, J kg−1 K−1 |
| Cpg | = | Specific heat capacity of grain, J kg−1 K−1 |
| Cw | = | Concentration of moisture in the rough rice, kg m−3 |
| Cv | = | Concentration of water vapor, kg m−3 |
| dp | = | Equivalent particle diameter of rough rice, m |
| Da | = | Molecular diffusivity of water vapor, m2 s−1 |
| Do | = | Reference diffusivity of moisture in the rough rice, m2 s−1 |
| Dt | = | Turbulent diffusivity of water vapor, m2 s−1 |
| Dw | = | Effective diffusivity of moisture in rough rice, m2 s−1 |
| Ea | = | Activation energy of moisture diffusion, J mol−1 |
| hh | = | Convective heat transfer coefficient, W m−2K−1 |
| hm | = | Overall mass transfer coefficient, m s−1 |
| hma | = | Air side external mass transfer coefficient, m s−1 |
| hms | = | Rice hull mass transfer coefficient, m s−1 |
| K | = | Darcy permeability, m2 |
| lh | = | Thickness of the rice hull, m |
| L | = | Latent heat of evaporation, J kg−1 |
| M | = | Moisture content, % dry basis |
| Md | = | Moisture content, kg kg−1, dry basis |
| Mw | = | The molecular weight of water, kg mol−1 |
| p | = | Pressure, Pa |
| Pr | = | Prandtl number |
| Psat | = | Saturated pressure of water, Pa |
| R | = | Universal gas constant, m3 Pa K−1 mol−1 |
| Re | = | Reynolds number |
| RH | = | Relative humidity of air, |
| Sc | = | Schmidt number |
| Se | = | Energy source term, W m−3 |
| Sm | = | Momentum source term, kg m s−1 |
| Sv | = | Water vapor source term, kg m−3 s−1 |
| Ta | = | Air temperature, K |
| Tg | = | Grain (rice) temperature, K |
| ui and uj | = | Air velocity components, m s−1 |
| = | Fluctuating velocity components, m s−1 | |
| xi and xj | = | Cartesian coordinates, m |
| Greek letters | ||
| β | = | Forchheimer drag coefficient, m−1 |
| ρa | = | Air density, kg m−3 |
| ρg | = | Grain density, kg m−3 |
| = | Air thermal conductivity, W m−1 K−1 | |
| λg | = | Grain thermal conductivity, W m−1 K−1 |
| ε | = | Grain bulk porosity |
| μ | = | Air dynamic viscosity, kg m−1 s−1 |
Notes on contributors
Mulugeta Admasu Delele (PhD) is an associate professor at the faculty of chemical and food engineering, Bahir Dar Institute of Technology, Ethiopia. He has an extensive experimental and modelling research experience in agricultural product drying, cooling, storage, packaging and related postharvest systems.
Yabebal Chekole Mihret is a lecturer at faculty of mechanical and industrial engineering, Bahir Dar Institute of Technology, Ethiopia. He has significant experience on the design, manufacturing and performance evaluation of postharvest systems, such as dryers.
Jochen Mellmann (PhD) is the head of the drying group at the Leibniz Institute for Agricultural Engineering and Bioeconomy, Potsdam, Germany. He has an extensive research experience in the areas of agricultural drying technology, modelling and development of drying processes, thermodynamics in agriculture and thermal and mechanical process engineering.
Disclosure statement
The authors report no conflicts of interest. The authors alone are responsible for the content and writing of the paper.
Additional information
Funding
References
- Parde, S.; Jayas, D.; White, N. Grain Drying: A Review. Sci. Aliments. 2003, 23, 589–622. DOI: 10.3166/sda.23.589-622.
- IRRI. Paddy Drying, International Rice Research Institute (IRRI)Version, Metro Manila, Philippines, 2013.
- Mellmann, J.; Weigler, F.; Scaar, H. Research on Procedural Optimization and Development of Agricultural Drying Processes. Dry. Technol. 2019, 37, 569–578. DOI: 10.1080/07373937.2018.1494186.
- Sharma, A.; Chen, C. R.; Lan, N. V. Solar-Energy Drying Systems: A Review. Renew. Sustain. Energy Rev. 2009, 13, 1185–1210. DOI: 10.1016/j.rser.2008.08.015.
- Kalita, P.; Deka, T. J.; Das, S.; Das, D.; Kataki, R. Design, Development and Performance Evaluation of a Fluidized Bed Paddy Dryer Journal of Energy and Environmental Sustainability Design, Development and Performance Evaluation of a Fluidized Bed Paddy Dryer. J. Energy Environ. Sustain. 2018, 6, 18–23. DOI: 10.47469/JEES.2018.v06.100062.
- Weigler, F.; Scaar, H.; Franke, G.; Mellmann, J. Development of a Novel Mixed Flow Dryer Design. Hung. Agric. Eng. 2015, 27, 46–50. DOI: 10.17676/HAE.2015.27.46.
- Stanescu, G.; Risso, M. Optimization of Continuous Mixed-Flow Grain Dryers by Constructal Theory. Int. J. Heat Technol. 2016, 34, S151–S160. DOI: 10.18280/ijht.34Sp0120.
- Sriwiset, S.; Chiawchanwattana, C.; Laohavanich, J. Designing of the Small Mixed-Flow Dryer and Studying of Hot Air Distributions Sitthiphon. Eng. Appl. Sci. Res. 2022, 49, 81–87. DOI: 10.14456/easr.2022.9.
- Oksanen, T. Controlling Air Flow in Recirculating Mixed Flow Batch Dryer with Double Bed Mode. Comput. Electron. Agric. 2018, 149, 133–138. DOI: 10.1016/j.compag.2017.07.018.
- Yahya, M.; Fahmi, H.; Hasibuan, R. Experimental Performance Analysis of a Pilot-Scale Biomass-Assisted Recirculating Mixed-Flow Dryer for Drying Paddy. Int. J. Food. Sci. 2022, 2022, 4373292–4373215. DOI: 10.1155/2022/4373292.
- Mondal, M. H. T.; Shiplu, K. S. P.; Sen, K. P.; Roy, J.; Sarker, M. S. H. Performance Evaluation of Small Scale Energy Efficient Mixed Flow Dryer for Drying of High Moisture Paddy. Dry. Technol. 2019, 37, 1541–1550. DOI: 10.1080/07373937.2018.1518914.
- Mondal, M. H. T.; Hossain, M. A.; Sheikh, M. A. M.; Akhtaruzzaman, M., Sarker, M. S. H. Energetic and Exergetic Investigation of a Mixed Flow Dryer: A Case Study of Maize Grain Drying. Dry. Technol. 2021, 39, 466–480. DOI: 10.1080/07373937.2019.1709077.
- Ronoh, E. K.; Kanali, C. L.; Mutwiwa, U. N.; Kituu, G. M. Design and Performance Evaluation of a Solar-Biomass Greenhouse Dryer for Drying of Selected Crops in Western Kenya. Agric. Eng. Int. CIGR J. 2020, 22,
- Susana, I. G. B.; Yudhyadi, I. G. N. K.; Alit, I. B.; Mirmanto, M.; Okariawan, I. D. K. Effect of Hole Spacing and Number Of Pipe on Dryer Box Temperature. Int. J. Mech. Eng. Technol. 2017, 8, 1029–1035.
- Sutrisno, A. Designing Rice Dryer with a Capacity of 1000 Kg / Hour Using Rice Husk Heater. J. Mol. Eng. Mater. 2021, 6, 42–52. DOI: 10.33021/jmem.v6i1.1301.
- Guanco, J.; Casinillo, L. Performance Evaluation of a Rice Hull-Fueled Cabinet Food Dryer. Recoletos Multidiscip. Res. J. 2021, 9, 23–38. DOI: 10.32871/rmrj2109.01.03.
- Alit, I. B.; Susana, I. G. B. Drying Performance of Jackfruit Dodol Using Rice Husk Energy on Household in Lombok, Indonesia. Front. Heat Mass Transf. 2021, 17, 1–7. DOI: 10.5098/hmt.17.15.
- Alam, M.; Saha, C.; Momin, M.; Alam, M. M.; Bala, B. Spatial Distribution of Temperature and Moisture in Grain Bin and Grain Bin Size Effects on STR Dryer Performance in Bangladesh Spatial Distribution of Temperature and Moisture in Grain Bin and Grain Bin Size Effect on STR Dryer Performance in Bangladesh. J. Agril. Mach. Bioresour. Eng. 2016, 7, 1-8.
- IRRI. Rice Knowledge Bank, International Rice Research Institute, Metro Manila, Philippines, 2023.
- Jayas, D. S.; White, N. D. G. Storage and Drying of Grain in Canada: Low Cost Approaches. Food Control. 2003, 14, 255–261. DOI: 10.1016/S0956-7135(03)00014-8.
- Chavan, A.; Vitankar, V.; Shinde, N.; Thorat, B. CFD Simulation of Solar Grain Dryer. Dry. Technol. 2021, 39, 1101–1113. DOI: 10.1080/07373937.2020.1863422.
- Weigler, F.; Scaar, H.; Franke, G.; Mellmann, J. Optimization of Mixed Flow Dryers to Increase Energy Efficiency. Dry. Technol. 2017, 35, 985–993. DOI: 10.1080/07373937.2016.1230627.
- Visconcini, A. R.; Gonçalves Andrade, C. M.; De Souza Costa, A. M. Fluid Flow Simulation of Industrial Fixed Bed Mixed-Flow Grain Dryer Using k-ω Sst Turbulence Model. Int. J. Agric. Biol. Eng. 2021, 14, 226–230. DOI: 10.25165/J.IJABE.20211402.5321.
- Giner, S. A.; Bruce, D. M.; Mortimore, S. Two-Dimensional Simulation Model of Steady-State Mixed-Flow Grain Drying. Part 1: The Model. J. Agric. Eng. Res. 1998, 71, 37–50. DOI: 10.1006/jaer.1998.0297.
- Kjær, L. S.; Poulsen, M.; Sørensen, K.; Condra, T. Modelling of Hot Air Chamber Designs of a Continuous Flow Grain Dryer. Eng. Sci. Technol. Int. J. 2018, 21, 1047–1055. DOI: 10.1016/j.jestch.2018.02.002.
- Sanghi, A.; Ambrose, R. P. K.; Maier, D. CFD Simulation of Corn Drying in a Natural Convection Solar Dryer. Dry. Technol. 2018, 36, 859–870. DOI: 10.1080/07373937.2017.1359622.
- Scaar, H.; Franke, G.; Weigler, F.; Delele, M.; Tsotsas, E.; Mellmann, J. Experimental and Numerical Study of the Airflow Distribution in Mixed-Flow Grain Dryers. Dry. Technol. 2016, 34, 595–607. DOI: 10.1080/07373937.2015.1064946.
- Zhang, Q.; Huang, M.; Wang, J.; Zhang, P.; Chen, B.; Shi, Z.; Zhang, J. Investigation on Airflow Distribution under Different Feed Thickness Combined CFD Modeling and Experimental Verification. Dry. Technol. 2021, 39, 306–323. DOI: 10.1080/07373937.2020.1777561.
- Cao, C. W.; Yang, D. Y.; Liu, Q. Research on Modeling and Simulation of Mixed Flow Grain Dryer. Dry. Technol. 2007, 25, 681–687. DOI: 10.1080/07373930701290951.
- Subrot, S.; Singh, C. B.; Fielke, J.; Zare, D. Modeling of Heat and Mass Transfer within the Grain Storage Ecosystem Using Numerical Methods : A Review Modeling of Heat and Mass Transfer within the Grain Storage Ecosystem Using Numerical Methods: A Review. Dry. Technol. 2019, 0, 1–21. DOI: 10.1080/07373937.2019.1656643.
- Ranjbaran, M.; Emadi, B.; Zare, D. CFD Simulation of Deep-Bed Paddy Drying Process and Performance. Dry. Technol. 2014, 32, 919–934. DOI: 10.1080/07373937.2013.875561.
- Elgamal, R.; Ronsse, F.; Radwan, S.; Pieters, J. G. Coupling CFD and Diffusion Models for Analyzing the Convective Drying Behavior of a Single Rice Kernel. Dry. Technol. 2014, 32, 311–320. DOI: 10.1080/07373937.2013.829088.
- Meullenet, J. C.; Marks, B. P.; Griffin, K.; Daniels, M. J. Effects of Rough Rice Drying and Storage Conditions on Sensory Profiles of Cooked Rice. Cereal Chem. J. 1999, 76, 483–486. DOI: 10.1094/CCHEM.1999.76.4.483.
- Mihret, Y. C.; Delele, M. A.; Tekeste, S. Design, Development, and Testing of Rice-Husk Fueled Mixed-Flow Rice Dryer for Small-Scale Rice Producer Farmers. Heliyon. 2023,9, 1–14. DOI: 10.1016/j.heliyon.2023.e18077.
- Abubakar, S.; Umaru, S.; Kaisan, M. U.; Umar, U. A.; Ashok, B.; Nanthagopal, K. Development and Performance Comparison of Mixed-Mode Solar Crop Dryers with and without Thermal Storage. Renew. Energy. 2018, 128, 285–298. DOI: 10.1016/j.renene.2018.05.049.
- Ashfaq, S.; ManzoorAhmad, Munir A.; Wajid, A. Design, Development and Performance Evaluation of a Small-Scale Solar Assisted Paddy Dryer for on Farm Processing. J Food Process Technol. 2015, 6, 1–6. DOI: 10.4172/2157-7110.1000480.
- Hussein, J. B.; Hassan, M. A.; Kareem, S. A.; Filli, K. B. Design, Construction and Testing of a Hybrid Photovoltaic (PV) Solar Dryer. Eng. J. 2017, 3, 01–14. DOI: 10.25125/engineering-journal-IJOER-MAY-2017-4.
- Iguaz, A.; San Martín, M. B.; Maté, J. I.; Fernández, T.; Vírseda, P. Modelling Effective Moisture Difusivity of Rough Rice (Lido Cultivar) at Low Drying Temperatures. J. Food Eng. 2003, 59, 253–258. DOI: 10.1016/S0260-8774(02)00465-X.
- Mutuli, G. P.; Mbuge, D. O. Drying Characteristics and Energy Requirement of Drying Cowpea Leaves and Jute Mallow Vegetables. Agric. Eng. Int. CIGR J. 2015, 17, 265–272.
- Ye, L.; El-Mesery, H. S.; Muzamal, M.; Shi, Y.; Zicheng, H.; Alshaer, W. G. Case Studies in Thermal Engineering Analysis of Energy and Specific Energy Requirements in Various Drying Process of Mint Leaves. Case Stud. Therm. Eng. 2021, 26, 101113. DOI: 10.1016/j.csite.2021.101113.
- Zewdie, T. A.; Delele, M. A.; Fanta, S. W.; Vanierschot, M.; Alemayehu, M.; Alemayehu, G.; Adgo, E.; Assaye, H.; Verboven, P.; Nicolai, B. M. Design and Evaluation of a Prototype Solar Energy Driven Onion Curing System Using CFD Modeling. Front. Sustain. Food Syst. 2022, 6, 01-17. DOI: 10.3389/fsufs.2022.1030915.
- Fortes, M.; Okos, M. R.; J. R. Barrett, J. Heat and Mass Transfer Analysis of Intra-Kernel Wheat Drying and Rewetting. J. Agric. Eng. Res. 1981, 26, 109–125. DOI: 10.1016/0021-8634(81)90063-9.
- Ranz, W. E.; Marshall, W. R. Evaporation from Drops: Part I. Chem. Eng. Prog. 1952, 48, 141–146.
- Ranz, W. E.; Marshall, W. R. Evaporation from Drops: Part II. Chem. Eng. Prog. 1952, 48, 173–180.
- Sun, D. Comparison and Selection of EMC / ERH Isotherm Equations for Rice. J. Stored Prod. Res. 1999, 35, 249–264. DOI: 10.1016/S0022-474X(99)00009-0.
- Defraeye, T.; Verboven, P. Convective Drying of Fruit : Role and Impact of Moisture Transport Properties in Modelling. J. Food Eng. 2017, 193, 95–107. DOI: 10.1016/j.jfoodeng.2016.08.013.
- Abera, A. A.; Tadesse, E. E.; Abera, B. B.; Satheesh, N. Effect of Rice Variety and Location on Nutritional Composition, Physicochemical, Cooking and Functional Properties of Newly Released Upland Rice Varieties in Ethiopia. Cogent Food Agric. 2021, 7, 1945281. DOI: 10.1080/23311932.2021.1945281.
- Aguerre, R.; Suarez, C.; Viollaz, P. Effect of Drying on the Quality of Milled Rice. J. Food Technol. 2007, 21, 75–80. DOI: 10.1111/j.1365-2621.1986.tb01932.x.
- Lu, R.; Siebenmorgen, T. J. Moisture Diffusivity of Long-Grain Rice Components. Trans. ASAE. 1992, 35, 1955–1961.
- ASABE. Resistance to Airflow of Grains, Seeds, Other Agricultural Products, and Perforated Metal Sheets, ASAE D272.3 MAR, 2021.