
 ?Mathematical formulae have been encoded as MathML and are displayed in this HTML version using MathJax in order to improve their display. Uncheck the box to turn MathJax off. This feature requires Javascript. Click on a formula to zoom.
Abstract
Cytotoxin (CTX) is a three-finger toxin presents predominantly in cobra venom. The functional site of the toxin is located at its three hydrophobic loop tips. Its actual mechanism of cytotoxicity remains inconclusive as few conflicting hypotheses have been proposed in addition to direct cytolytic effects. The present work investigated the interaction between CTX and death receptor families via ensemble-based molecular docking and fluorescence titration analysis. Multiple sequence alignments of different CTX isoforms obtained a conserved CTX sequence. The three-dimensional structure of the conserved CTX was later determined using homology modelling, and its quality was validated. Ensemble-based molecular docking of CTX was performed with different death receptors, such as Fas-ligand and tumor necrosis factor receptor families. Our results showed that tumor necrosis factor receptor 1 (TNFR1) was the best receptor interacting with CTX attributed to the interaction of all three functional loops and evinced with low HADDOCK, Z-score and RMSD value. The interaction between CTX and TNFR1 was also supported by a concentration-dependent reduction of fluorescence intensity with increasing binding affinity. The possible intermolecular interactions between CTX and TNFR1 were Van der Waals forces and hydrogen bonding. Our findings suggest a possibility that CTX triggers apoptosis cell death through non-covalent interactions with TNFR1.
Communicated by Ramaswamy H. Sarma
Introduction
Cobra venom is rich in lethal toxins, especially cytotoxin (CTX), which present predominantly in cobra venom (Kini, Citation2002). CTX belongs to the three-finger toxin family. Approximately 40–60% of the dry weight of cobra venom consists of CTX (Feofanov et al., Citation2004). Thus, it accounts for the significant pathogenesis of cobra envenomation, particularly dermonecrosis. The bioavailability of CTX in experimental animals is about 40% (Yap et al., Citation2013, Citation2014). This indicates that, the toxin has a strong binding affinity towards the tissue at the envenomation site causing extensive local tissue damage, further worsening dermonecrosis at the envenomed site.
CTX is a highly basic amphipathic protein with 59–62 amino acid residues in a single polypeptide chain (Konshina et al., Citation2012). It displays an ordinary three-finger structure with β-pleated sheets within its core which are stabilized by four disulfide bonds. The functional sites of the toxin are located at the hydrophobic loop tips. The loops of CTX are hydrophobic due to the presence of hydrophobic residues which are flanked with basic amino acid residues, namely lysine and arginine (Kumar et al., Citation1997).
CTX is classified into P-type and S-type, based on the position of serine and proline in its second functional loop. In the S-type CTX, the serine residue is located at position 28th (Ser28); while in the P-type CTX, the proline residue is located on position 30th (Pro30) (Chien et al., Citation1994). This single difference in the position of the amino acid residues determines the cytotoxicity of CTX. P-type CTX is more cytotoxic than S-type because it exhibits stronger interactions with phospholipid bilayers owing to the hydrophobicity of proline residues (Dubovskii et al., Citation2005). High variation in the functional hydrophobic loops of CTX appears to be responsible for its diverse pharmacological actions such as depolarization of myocytes, cardiotoxicity and hemolysis (Konshina et al., Citation2012). The genes coding for the functional loops for the CTX are highly evolved, leading to high variability in different CTX isoforms even from the same cobra species (Suzuki-Matsubara et al., Citation2016).
The exact molecular mechanisms of cytotoxicity elicited by CTX remain contradictory as few competing hypotheses have been proposed: not only biophysical alteration of cell membrane causes direct lytic action on the cell membrane (Forouhar et al., Citation2003; Gasanov et al., Citation2015) but also intracellular signaling pathways. Some studies have demonstrated that CTX induces apoptosis through a caspase-mediated intrinsic pathway (Ebrahim et al., Citation2014), JAK2/PI3K-mediated signaling pathway (Lin et al., Citation2010), Fas pathway (Zhang & Cui, Citation2007), up-regulation of Bax/Bcl-2 ratio (Chien et al., Citation2010) and cell-cycle arrest (Das et al., Citation2013). In addition, the toxin induces lysosomal damage (Wu et al., Citation2013), mitochondrial membrane permeabilization (Yang et al., Citation2005) and endoplasmic reticulum-mediated apoptosis (Chien et al., Citation2008). Furthermore, it is noteworthy that the apoptotic effects of CTX may only be observed in a limited range of toxin concentrations. The mode of cell death rapidly switches from apoptosis to hypothetical necrosis when the concentration increases (Ebrahim et al., Citation2015). A concentration-dependent transition of apoptosis to necroptosis is also observed in CTX-induced cell death (Hiu & Yap, Citation2021; Teoh & Yap, Citation2020).
It is ambiguous whether the above phenomena are due to intracellular accumulation of CTX resulting from membrane penetration or membrane receptor-mediated pathways. Sequence variations in CTX attributable to different isoforms, species and geographical origins have been previously observed (Chien et al., Citation1994; Suzuki-Matsubara et al., Citation2016). The conserved sequences among different toxin isoforms have yet to be determined. This leads to inconclusive functionality and cytotoxicity of CTX. Furthermore, interactions between CTX and cell-death receptors have not been extensively studied. In this study, we constructed a CTX with a conserved sequence and investigated its three-dimensional structural properties. This study also aimed to elucidate the possible interaction between CTX and cell-death receptors as potential molecular target via ensemble-based molecular docking and fluorescence quenching measurement.
Methods
Multiple alignments of CTX sequences
CTX sequences were non-redundantly retrieved from the NCBI protein database (Serpentes, Taxid: 8570; genus: Naja). These sequences were processed to obtain mature CTX sequences. Multiple sequence alignments were performed using Clustal X software version 2.1 (Larkin et al., Citation2007) to determine the conserved sequence. The sequence was then searched against the NCBI Serpentes protein database (taxid: 8570) using blastp (https://blast.ncbi.nlm.nih.gov/Blast.cgi) to confirm the identity of the conserved sequence.
Homology modelling: three-dimensional structure
The structure of the conserved CTX was determined using MODELLER version 9.19 (Webb & Sali, Citation2016). The conserved CTX sequences were then searched against non-redundant pdb sequences in the sdb database. Potential structural templates for CTX were selected based on (1) protein structures with sequences ≥ 95% sequence identity with the CTX sequence, (2) less than 30 residues or 30% sequence length and (3) a significant sequence alignment between CTX sequences and pdb sequences of the potential template given by the e-value equal to 0. The most appropriate template structure was then aligned to CTX sequence. A dendrogram was used to calculate a pairwise distance clustering tree. The most suitable template was selected based on (1) the distance between the template structure and CTX structure, (2) crystallographic resolution of the template structure and (3) overall sequence identity of the template to the CTX sequence. Following this selection, the top five CTX models were generated. The best model was selected based on the lowest DOPE score and the GA341 score closest to 1. The quality of the best CTX model was evaluated using a Ramachandran plot on PDBsum (http://www.ebi.ac.uk/thornton-srv/databases/pdbsum/Generate.html; Laskowski et al., Citation2017). The SuperPose web server (http://superpose.wishartlab.com/) was used to examine the sequence alignments, structural alignments, PDB coordinators, and Root Mean Square Deviation (RMSD) statistics between the template structure and the best CTX model. The DOPE energy plot of the template PDB and the best CTX model were constructed to examine if the energy level of the best CTXmodel was similar to that of the template PDB, using Gnumeric software version 1.10.16 (http://www.gnumeric.org/).
Molecular docking of CTX with death receptors
Virtual screening of potential death receptors
Protein-protein docking was performed using HADDOCK2.2 (http://milou.science.uu.nl/services/HADDOCK2.2/; van Zundert et al., Citation2016) which allows molecular docking between two structures using the information from identified protein interfaces based on ambiguous interaction restraints (AIRs). The PDB structure of death receptors was obtained from the RCSB protein databank (https://www.rcsb.org/). The death receptors were TNFR1 (1ext), TNFR2 (3alq), TNFRSF25/DR3 (5ygs), TRAIL-R1/DR4 (5cir), TRAIL-R2/DR5 (1d0g), death receptor 6/DR6 (3qo4), and Fas receptor, CD95 (3thm). All irrelevant complexes attached to the receptors, such as water molecules, antibodies or ligands were removed prior to molecular docking.
The Easy interface was used to perform docking between CTX and death receptors. CTX was the first molecule in HADDOCK 2.0, whereas death receptors were the second molecule. The active residues of the CTX were the functional loops, including amino acid residues Asn4, Asn5, Lys6, Leu7, Val8, Pro9, Leu10, Phe11, Tyr12, Met27, Val28, Ser29, Thr30, Pro31, Thr32, Lys33, Val34, Pro35, Val36, Ile41, Asp42, Val43, Cys44, Pro45, Lys46, Asn47, Ser48, Leu49, Leu50 and Val51. The passive residues were the remaining residues. All residues in the death receptors were selected as active residues.
The docking complexes between CTX and each death receptor were ranked according to the RMSD value, HADDOCK and Z-scores. The best-docking complexes were further analyzed for all types of non-covalent interactions using the Residue Interaction Network Generator 2.0 (RING 2.0, http://old.protein.bio.unipd.it/ring/) where a threshold distance was strictly selected (Piovesan et al., Citation2016). An interaction network output file was then generated to display the interaction energy and intermolecular interactions within each complex. The total number of intermolecular interactions was then computed. The amino acid residues involved in intermolecular interactions were also mapped to CTX and receptors.
Molecular dynamics (MD) simulation of CTX and the best docked death receptor
All MD simulations of CTX and the best-docked death receptor were performed on GROMACS software version 2018 (Abraham et al., Citation2015) in an aqueous environment. The .pdb files of CTX and death receptor were converted to. gro topology file by using the pdb2gmx module of GROMACS applying an all-atom OPLS forcefield (Jorgensen et al., Citation1996). A unit cell was then created using the. gro topology file and the editconf module in Gromacs (Abraham et al., Citation2015). A cubical box (1.0 nm) was selected to position the molecules to ensure no interaction with the periodic images of protein molecules. The box was then solvated with SPC/E 3-point water model which improved accuracy and efficiency during computational analysis (Mark & Nilsson, Citation2001). The system was then neutralized with the addition of 9 Cl− ions. Energy minimization was applied with a maximum force of 1000 kJ mol−1nm−1 for 3000 steps. System equilibration was performed on the NVT and NPT ensembles (Prasad et al., Citation2021), whereby temperature and pressure were equilibrated for 100 ps to 300 K and 1.0 bar, respectively. This was followed by 50 ns MD simulation for 25,000,000 steps. The LINCS algorithm (Hess, Citation2008) was used as the constraint algorithm. The RMSD and RMSF plots were generated with MDTraj (McGibbon et al., Citation2015)
Clustering analysis to generate ensemble structures following MD simulation
The trajectory files acquired from the MD simulation were then executed for RMSD-based clustering analysis on TTClust version 4.8.2 (Tubiana et al., Citation2018). TTClust uses the RMSD distance matrix to perform Ward’s hierarchical clustering. The optimal number of clusters was estimated with the elbow method based on several k-means clustering. Each cluster’s representative frame was defined as the lowest RMSD and other cluster structures. The output files corresponding to relative distance and linear bar plots were used to illustrate the linear representation of clustering transition.
Ensemble-based docking of CTX with the best docked death receptor
The ensembles of representative clusters generated from the clustering analysis for both CTX, and the best-docked death receptor were subjected to molecular docking. The ensembles of their respective protein conformations from each MD trajectory represent the most relevant structures for molecular docking.
Interaction study between CTX and TNFR1
Prediction of binding affinity
The structure-based prediction of binding affinity of CTX -death receptor was studied using PRODIGY (PROtein binDIng enerGY prediction) web server (https://wenmr.science.uu.nl/prodigy/; Vangone & Bonvin, Citation2015; Xue et al., Citation2016). The docking complex in .pdb format was submitted to the web server to calculate the binding affinity between CTX and TNFR1.
Fluorescence spectral measurement
The fluorescence measurement (Yammine et al., Citation2019) was carried out to study the interaction between conserved CTX and human TNFR1 protein (Novus Biologicals, United States) using FL 6500 Fluorescence Spectrometer (Perkin Elmer, United States) with pulse source mode, power of 80 kW and frequency of 100 Hz. In the fluorescence titration analysis, the emission spectra of TNFR1 at 0.1 μg/mL (300–550 nm) was obtained using an excitation wavelength (λex) of 280 nm. Then, different concentrations of CTX ranging from 0.005 to 0.04 μg/mL were mixed individually with TNFR1 at different time points from 0 to 30 min. All samples were prepared in a 10 mm quartz cuvette. The emission spectra of CTX–TNFR1 were then plotted based on mean fluorescence intensity of three experimental replicates.
Fluorescence titration analysis
The fluorescence intensity reading obtained was corrected for inner filler effect using the equation (Chaves et al., Citation2018):
where Fcor and Fobs are the corrected and observed fluorescence intensity, respectively, Aex and Aem are the difference in absorbance value at excitation 280 nm and emission (300–550 nm) wavelengths, respectively.
To analyze the fluorescence titration data, Stern–Volmer equation was used based on the corrected fluorescence readings:
where Fo is the fluorescence intensity of TNFR1, while F is the fluorescence intensity in the presence of CTX at λmax, Ksv is Stern–Volmer quenching constant, and [L] refers to the concentration of CTX. Then, a modified Stern–Volmer equation known as double-logarithmic plot was used to determine the binding constant (Kb) values and number of binding sites (n) with the equation:
where Fo is the fluorescence intensity of TNFR1, while F is the fluorescence intensity in the presence of CTX at λmax, [L] is the concentration of CTX, n represents number of binding sites per receptor, and Kb is the binding constant.
Results and discussion
Multiple sequence alignment of CTX sequences
shows the multiple sequence alignment for different CTX sequences () retrieved from the NCBI protein database (Taxid = 8570, Serpentes, Genus: Naja) to deduce a conserved CTX sequence. This conserved sequence contains 62 amino acid residues, which are well-correlated with other contemporary CTX isoforms (Konshina et al., Citation2012). The query coverage of this conserved sequence was 100% with 95% similarity and e-value of 5e − 46, which indicated a complete and significant matching of the amino acids to cytotoxin 3a (Q98959.1) ().
Figure 1. Multiple alignment of non-redundant and mature cytotoxin (CTX) sequences from different Naja sp. (Serpentes, Taxid = 8570). The conserved amino acid sequence of CTX was blasted against NCBI blastp. The three hydrophobic loops were annotated to represent the characteristics of three-finger functional loops in CTX.
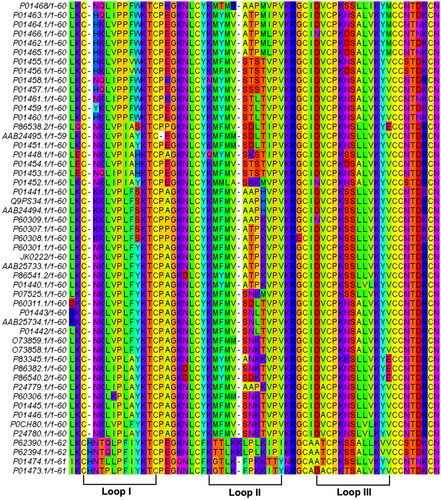
Table 1. The conserved CTX sequence was acquired from multiple sequence alignments of the non-redundant and mature CTX sequences (Naja, Taxid: 8570).
Three-dimensional structure
Homology modelling
All possible template structures of the conserved CTX exhibited an e-value of 0 with more than 50% similarity to the conserved CTX (Figure S1A). A dendrogram (Figure S1B) was then constructed to illustrate the distance between each template structure and the conserved CTX, as well as their respective crystallographic resolutions (Å). After evaluating the percentage of similarity, pairwise distance, and resolutions, we selected 1ug4A as the template because it exhibited the best structural similarities to CTX with the following parameters: (1) distance closer to the CTX structure, (2) crystallographic resolution of the structure of 1.6 Å and (3) 88% sequence identity with the query sequence. Following the selection of the 1ug4A template for homology modeling, a total of five CTX models were constructed (Table S1). The DOPE and GA341 scores were parameterized to select the best PDB structure for subsequent analysis.
The best structure was selected based on the lowest DOPE and GA341 scores, which are closer to 1. A more negative DOPE score indicates that the model structure is more native-like similar to that of the template (Colubri et al., Citation2006). The GA341 score is a probability score that indicates the reliability of the PDB model (Melo et al., Citation2009). A model is reliable when its GA341 score is greater than 0.7. Therefore, all PDB structures deduced from 1ug4A were reliable. We referred to the DOPE scores to select the best model, because these models displayed similar GA341 scores (Table S1). Based on these parameters, the model CTX.B99990003.pdb had the lowest DOPE and GA341 scores of 1. However, this PDB model was not selected because it did not show five β-pleated structures. We then chose CTX.B99990002.pdb because it exhibited the second-lowest DOPE score and a GA341 score of 1. Thus, the three-dimensional structure of the CTX was determined using CTX.B99990002.pdb.
Evaluation of the quality of the conserved CTX structure
The quality of the conserved CTX structure was evaluated by comparing the DOPE energy score profile with that of template 1ug4A. As illustrated in , the DOPE energy profiles of both the conserved CTX and template showed that the alignment of the amino acid residues was not shifted from each other Eswar et al. (Citation2006). Superimposition of CTX and template confirmed their well-aligned structures (). The RMSD value of 0.71 Å further supported this observation, indicating that the conserved CTX and template were highly similar. The similarity between the two superimposable structures was high when the RMSD value for Cα was below 2 Å (Maiti et al., Citation2004). The quality of CTX structure was also assessed using a Ramachandran plot (). The Ramachandran plot displays the torsion angle of each amino acid residue in the peptide chain. If a structure is not a good model, the torsion angle is primarily found in the disallowed region, thus indicating that a structure deviates from its native structure (Hovmöller et al., Citation2002). For a structure to be defined as a good model that is closer to the native structure, 90% of the torsion angles of each amino acid residue must reside in the favored region of the plot.
Figure 2. Homology modeling of conserved cytotoxin (CTX). (A) DOPE energy score profile shows the alignment of conserved CTX model and template (1ug4A); (B) The superimposed image for both the template (1ug4A) and conserved cytotoxin. Blue represents the template (1ug4A) while the red represents the conserved CTX model; (C) Ramachandran plot of conserved CTX to visualize the energetically allowed regions for a polypeptide backbone at different angles ψ against φ of amino acid residues. The red region is the most favored region, whereas the yellow region represents additionally allowed region. The pale-yellow region represents for the generously allowed region. The white region is the disallowed region; (D) Three-dimensional structure of conserved CTX determined from Modeller version 9.19, using cytotoxin from Naja atra venom (1ug4A) as the template.
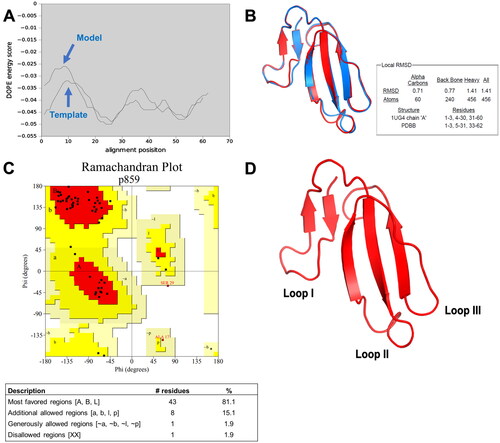
In CTX structure, most of the amino acids (∼ 43 residues) resided in the red region, representing the most favored region. In addition, another eight amino acids resided in the additional allowed region. This contributes to 96.2% of the residues in the favored regions, suggesting that the structure determined from homology modeling was stable and good quality. This conserved CTX also exhibited a three-finger folded structure of contemporary CTXs, which implied its well-conserved structure (). Interestingly, as revealed by the Ramachandran plot, a Ser29 residue was found in this conserved CTX indicating that it is an S-type CTX (Chien et al., Citation1994).
RMSD-based screening of potential death receptor targets by molecular docking with conserved CTX
Molecular docking of CTX with different receptors was performed on HADDOCK2.2. The death receptors were TNF-related apoptosis-inducing ligand (TRAIL)/Apo-2L receptors (TRAIL-R1/DR4 and TRAIL-R2/DR5), death receptor 6 (DR6), Fas receptor (CD95), tumor necrosis factor receptors 1 and 2 (TNFR1 and TNFR2). Death receptors belong to a protein superfamily called the tumor necrosis factor superfamily receptor (TNFSFR). TNFSFR consists of TRAIL-R1/DR4, TRAIL-R2/DR5, DR6, Fas receptor (CD95), TNFR1 and TNFR2, which exhibit structural similarities within the same protein family. Death receptors are involved in programmed cell death and apoptosis. TNFR2 does not possess a death domain (DD) essential for transducing apoptotic signaling pathways in cells. In addition, DR6 is a less potent death receptor than other death receptors even in the presence of DD (Guicciardi & Gores, Citation2009). The characteristics of the death receptors are listed in .
Table 2. The death receptors and their characteristics.
Using in silico molecular docking analysis, the selection of the most suitable death receptor interacting with CTX was based on (1) the number of functional loops on CTX involved in interaction and (2) the HADDOCK score, Z-score and RMSD value. Overall, HADDOCK2.2 clustered 656 structures into 1200 clusters, representing 54.7% of the water-refined HADDOCK models.
summarizes the docking parameters of CTX and death receptor complexes. The HADDOCK score represents the weighted sum of all energies (Van der Waals, electrostatic interactions, desolvation energy, restraint’s violation energy, and buried surface area) in all clusters of the docking structures (de Vries et al., Citation2010). It is a statistical parameter used to rank the top cluster in each docking complex (van Zundert et al., Citation2016; Vangone et al., Citation2016). The top cluster in each docking structure with a lower HADDOCK score indicates a more energetically stable docking structure (Ramirez et al., Citation2020). The RMSD value of the overall lowest-energy structure in each docking cluster, which often considers the average distance between two molecules, is used to evaluate whether the binding conformation of the ligand and receptor is reproducible (Irina & Abagyan, Citation2012). Ideally, RMSD lesser than 2.0 Å indicates an optimum docking conformation (Hevener et al., Citation2009; Ramírez & Caballero, Citation2018). The lower the RMSD value, the higher the accuracy of the docking conformation. However, to increase the confidence level in the determination of the best docking structure, a Z-score is introduced to select the most suitable death receptor for docking. The lower the Z-score, the better the docking structure because it indicates the standard deviation from the average of the HADDOCK score in each cluster (van Zundert et al., Citation2016).
Table 3. The docking parameters of conserved cytotoxin (CTX) with different death receptors by molecular docking on HADDOCK2.2.
The Van der Waals and electrostatic energies represent the energy levels of non-covalent bonds (van Zundert et al., Citation2016). In general, the lower the energy, the more stable the docking complex is. There were no significant differences in the non-covalent energy values between the different docking complexes. In contrast, the restraint’s violation energy is calculated from the restraint violation of specific criteria such as dihedral angle restraint’s violations and dipolar coupling restraint violations (Vangone et al., Citation2016). The restraint’s violation energy () corresponded to the HADDOCK score. HADDOCK restricts the distance limit to no more than 2 Å between 2 molecules. Once the distance limit of the 2 molecules exceeds 2 Å, the restraint’s energy becomes positive. The closer the distance limit, the smaller is the restraint’s energy value (de Vries et al., Citation2010). On the other hand, desolvation energy plays an essential role in the ligand entry and target-ligand complex formation. It represents the empirical energy required to replace water molecules upon binding of the ligand to the receptor (Fernández-Recio et al., Citation2004; Mondal et al., Citation2014).
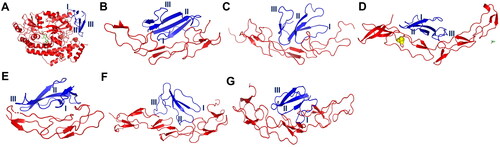
Based on virtual examination of the docking structures on Pymol, not all three functional loops of CTX interacted with the death receptors (). For example, DR3, DR4 and CD95 did not interact with three functional loops of CTX. Loop III did not interact with DR3 () whereas loop II did not interact with DR4 (). In addition, loop III was not involved in docking with CD95 (), although CD95 is known to directly induce apoptosis by forming death-inducing signaling complexes (DISCs) (Lavrik, Citation2005). Since three-finger loops are the functional sites responsible for cytotoxicity (Dubovskii et al., Citation2005), thus, DR3, DR4 and CD95 were not included in further analysis. Nevertheless, as demonstrated by molecular docking, all three functional loops of CTX interacted with TNFR1, TNFR2, DR5 and DR6. Then, we ranked the docking structures in ascending order, according to (1) HADDOCK scores: DR5, TNFR2, TNFR1 and DR6; (2) Z-scores: TNFR2, TNFR1, DR5 and DR6 and (3) RMSD values: TNFR1, DR6, DR5 and TNFR2.
Figure 3. Docking complex between conserved cytotoxin (CTX) and death receptor families. The death receptors colored in red whereas CTX colored in blue. The functional loops I to III of CTX are numbered. (A) a complex between DR3 and CTX; (B) a complex between DR4 and CTX; (C) a complex between DR5 and CTX; (D) a complex between DR6 and CTX; (E) a complex between CD95 and CTX; (F) a complex between TNFR1 and CTX; (G) a complex between TNFR2 and CTX. Abbreviations: DR3, death receptor 3; DR4, death receptor 4; DR5, death receptor 5; DR6, death receptor 6, CD95, Fas/APO-1; TNFR1, tumor necrosis factor receptor 1; TNFR2, tumor necrosis factor receptor 2.
The HADDOCK score indicated that the death receptor DR5 was the most energetically stable protein in the docking structure. However, it did not exhibit the lowest Z-score and RMSD value. Therefore, the docking complex was not statistically significant. Although TNFR2 was ranked as the second most energetically stable and statistically significant receptor, it did not possess the lowest RMSD value. On the other hand, the death receptor DR6 was the least energetic and insignificant receptor due to its highest HADDOCK and Z-scores. Therefore, DR6 could not be deemed the most suitable receptor in the docking structure.
Given that the RMSD values in all docking structures were > 2.0 Å, we selected the structure with the lowest RMSD value for a more accurate docking conformation. TNFR1 has the lowest RMSD and intermediate HADDOCK and Z-scores. In addition, the energy distribution of TNFR1 was more stable in comparison to other receptors. TNFR1 was then selected for subsequent ensemble-based molecular docking.
Ensemble-based molecular docking of conserved CTX with tumor necrosis factor receptor 1 (TNFR1)
Based on the molecular docking selection of potential death receptors using HADDOCK2.2, TNFR1 was the most compatible receptor with CTX. Thus, ensemble-based molecular docking of CTX and TNFR1 was performed using molecular dynamics simulation (MD) in an aqueous environment, followed by RMSD-based clustering analysis (). The Root Mean Square of Fluctuation (RMSF) is a measurement of average fluctuation values (Shahraki et al., Citation2018) of each atom in a protein from its mean position. It is used to measure the flexibility of the protein structure (Khezri et al., Citation2018; Martínez, Citation2015). The higher the RMSF value, the greater the flexibility of a protein structure during simulation (Zhao et al., Citation2015). In TNFR1, the highest fluctuation appeared at the N-terminal and C-terminal regions of TNFR1. On the contrary, greater flexibility was observed in functional loops I–III of CTX.
Figure 4. Molecular dynamics (MD) simulation of (A) conserved cytotoxin (CTX) and (B) tumor necrosis factor receptor 1 (TNFR1) in an aqueous environment. The system after equilibration was represented in its respective simulation box. The water is colored in grey while the protein is annotated as green ribbon, and the blue molecules are Cl− ions. The RMSF fluctuation plots of CTX and TNFR1 were illustrated. The RMSD of the backbone of each protein molecule for 50 ns of simulation in an aqueous environment; the gray line in RMSD plots represents the raw RMSD values, while the red line represents a polynomial approximation of the third order based on a floating window of 50 points. RMSD-based clustering of the MD trajectories was performed to obtain the conformational structures of the CTX and TNFR1 for ensemble-based molecular docking. Four clusters were obtained for CTX, and 5 clusters obtained for TNFR1. For each system, a timeline barplot representing the belonging to each cluster throughout the MD simulation was reported.
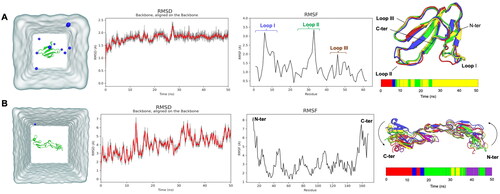
Root mean square of deviation (RMSD) measures the difference between an observed structure and initial structure, which indicates the conformational stability of a protein during simulation (Li et al., Citation2011). Over the simulation time, the RMSD values of CTX were between 2 and 3 Å (). Whereas for TNFR1, the RMSD values were between 2 and 8 Å for TNFR1 (). RMSD-based clustering was then performed to select the most relevant conformational ensembles of CTX and TNFR1 from the MD trajectories. Four CTX clusters (clusters 1 to 4) and five clusters of TNFR1 (TNFR1-1 to TNFR1-5) were identified. All CTX clusters were very similar (Figure S2—RMSD table), especially when the system reached a plateau after 7.5 ns. Over the four clusters, cluster 4 was the biggest cluster and represented last 35 ns of the trajectory. Nevertheless, clusters 3 and 4 were very close to each other (Figure S2), whereby these two clusters were the representatives of the conformational structures of the RMSD plot at a plateau state. In contrast, TNFR1 was more flexible thus leading to a greater conformational change. Despite its secondary structures were conserved (Figure S2), its RMSD values increased over simulation time attributed to a conformational change within TNFR1. It appeared that, TNFR1 had a torsion movement (as shown in arrows, ) around its center region. As illustrated in linear clustering barplot (), there was an alternative conformation between clusters 3 and 4, indicating that these two conformations were close to each other, as demonstrated by relative distance between clusters (Figure S2). All the ensemble structures of CTX and TNFR1 then were subjected to molecular docking to select the best conformational structures. From all 20 docking possibilities between CTX and TNFR1 clusters, the three best conformational ensembles are summarized in .
Table 4. The docking parameters of ensemble structures of conserved cytotoxin (CTX) with tumor necrosis factor receptor 1 (TNFR1).
Similarly, we ranked the conformational ensembles based on the lowest HADDOCK scores, Z-scores and RMSD values of < 2.0 Å. From , conformational ensembles 2 (CE2) exhibited the lowest HADDOCK score (65.9 a.u) followed by conformational ensembles 1 (CE1, 77.0 a.u) and conformational ensembles 3 (CE3, 78.3 a.u). We then evaluated the RMSD values for all the conformational ensembles. Ideally, an RMSD less than 2.0 Å indicates an optimum docking conformation (Ramirez et al., Citation2020). All three conformational ensembles displayed RMSD values of less than 2.0 Å. In addition, the lower the RMSD value, the higher the accuracy of the docking conformation. Therefore, CE3 has the lowest RMSD value (0.7 Å), followed by CE2 TNFR1 (0.9 Å), then CE1 (1.1 Å).
To increase the confidence level in the determination of the docking structure, the Z-score was introduced along with RMSD to select the most suitable death receptor. CE3 had the lowest Z-score (−1.8), followed by CE1 (−1.5) and CE2 (−1.3). From the parameters mentioned above, the conformational structure CE3 fulfilled the criteria of the best ensemble conformation, which exhibited the lowest RMSD and Z-scores. Although the HADDOCK score of CE3 appeared to be higher, it was comparable to those of the other two ensemble structures. Furthermore, CE3 exhibited the lowest Van der Waals and desolvation energies, indicating overall energy stability.
Interaction between CTX and TNFR1
The interaction site mapping and binding affinity of ensemble structure CE3
shows the interaction within ensemble structure CE3. As revealed from RING 2.0 analysis, these residues were Lys6, Phe11, Tyr12, Phe26, Val28, Ser29, Thr30, Pro31, Thr32, Lys33, Val34, Arg38, Leu49, Lys52, Thr58 and Arg60. Of these residues, approximately 56.1% resided in the functional loops of CTX, as highlighted in yellow (). On the other hand, we also performed molecular docking of TNFR1 (PDB ID: 1ext) and its ligand TNF-α (PDB ID: 1tnf) to determine its contemporary binding sites. We found that 65% of the CTX -binding sites on TNFR1 are identical to TNF-α binding sites. This finding suggested interactions between the ligand-binding sites of TNFR1 and the functional loops of CTX which are responsible for its cytotoxicity.
Figure 5. The molecular docking of ensemble conformational ensemble 3 (CE3) of cytotoxin (CTX) and tumor necrosis factor receptor 1 (TNFR1). (A) CTX is colored in blue while TNFR1 is in red color; the pink region represents three hydrophobic loops of CTX while green region indicates the interacting sites of TNFR1. The representative interactions between functional loops I–III of CTX with TNFR1 were illustrated in figures (B) to (D), respectively. The red color dashed lines indicated hydrogen bonds.
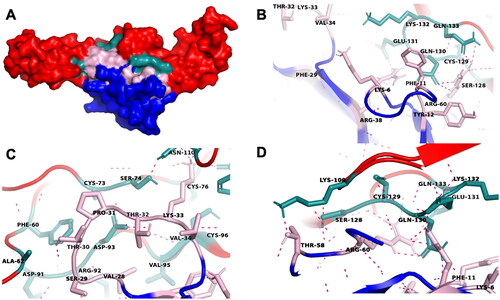
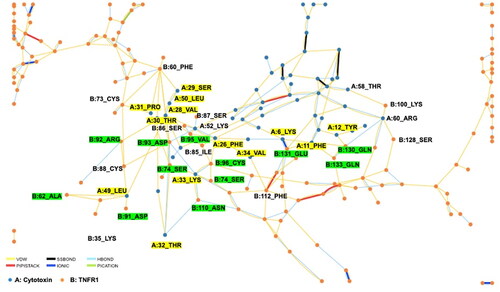
Figure 6. A schematic diagram of the residue interaction network between conserved cytotoxin (CTX, annotated as A) and tumor necrosis factor receptor 1 (TNFR1, annotated as B) in CE3. This interaction network was generated using RING 2.0. The interacting chains are shown as different colored lines representing different non-covalent forces. The amino acid residues involved in the direct interaction between CTX and TNFR1 were labeled. The yellow residues indicate the functional loops of CTX, while the green residues represent the TNF-α ligand binding sites of TNFR1. Abbreviations: VDW, Van der Waals; SSBOND, disulfide bonds; HBOND, hydrogen bonding; PIPISTACK, π-stacking; IONIC, ionic bonds; PICATION, π-cation.
The types of intermolecular interactions within the binding sites of CE3 were also determined. The intermolecular interactions within the binding sites of CE3 were made up of 70.2% Van der Waals interaction, 27.7% hydrogen bond, followed by 2.1% ionic interactions. Both Van der Waals and hydrogen bonding were thus the main contributors to the interaction between CTX and TNFR1, suggesting a non-covalent binding of CTX to TNFR1 for reversible interaction. This can induce the formation of DISCs and thus activate the caspases-signaling cascade. Nonetheless, the activation of the apoptotic signaling pathway for TNFR1 is relatively slower than that of the Fas receptor, as it involves downregulation of the proapoptotic protein Bcl-2 (Kuwano & Hara, Citation2000). Overall, the non-covalent interaction between CTX and TNFR1 with higher binding affinity suggested the reversible binding of CTX to TNFR1 for death-receptor mediated cell death, as observed in CTX-induced cytotoxicity (Chien et al., Citation2010; Das et al., Citation2013; Ebrahim et al., Citation2014, Citation2015; Lin et al., Citation2010; Micheau & Tschopp, Citation2003; Teoh & Yap, Citation2020; Zhang & Cui, Citation2007). Activation of TNFR1 can lead to apoptosis or necroptosis (Fischer et al., Citation2020). During apoptosis, TNFR1 recruit tumor necrosis factor receptor type-1 associated death domain (TRADD), followed by the subsequent recruitment of Fas-associated and pro-caspase 8 to form death inducing signaling complex (DISC), which eventually leads to apoptosis. The signaling pathways associated with TNFR1 also involve p38/MAPK, JNK and NFκB pathways.
Prediction of binding affinity
The binding affinity is essential for understanding the interactions between two molecules in a system. It can be defined as the strength of the interaction between two molecules in protein–protein interaction. The binding affinity in CE3 is predicted based on the 3D structure of the protein using Prodigy web server (https://wenmr.science.uu.nl/prodigy/; Vangone & Bonvin, Citation2015; Xue et al., Citation2016).
The binding energy (ΔG) and dissociation constant (KD) of CE3 were −16.2 kcal/mol and 1.3 × 10⁻¹² M, respectively. The lower the ΔG and KD, the better the binding affinity between CTX and TNFR1. In addition, Interfacial Contacts (ICs) and Non-Interacting Surface (NIS) are included in this structure-based binding affinity prediction. The buried surface area has been reported to be a primary descriptor of binding affinity, and this has been confirmed using a set of rigid complexes. Interfacial contacts represent the number of interacting surfaces between two molecules, whereby the higher the number of ICs, the stronger the binding strength (Vangone & Bonvin, Citation2015). This is because the interface residues have more exposure and close packing to increase the interaction affinity (Nooren & Thornton, Citation2003). The amino acid residues on the interacting surface are further classified into polar, apolar and charged based on their side chains. Most of the interacting surface residues constitute interactions between charged and apolar residues, supporting the mapping of the binding sites. In addition to ICs, NIS significantly contributes to the overall binding affinity to a receptor, especially involving polar and charged residues (Kastritis et al., Citation2014). This combined IC/NIS-based prediction model of binding affinity provides higher accuracy in binding affinity prediction (Vangone & Bonvin, Citation2015).
Fluorescence titration analysis of CTX–TNFR1 interactions
Fluorescence measurement is used to study the protein–ligand interaction and determine the binding constant between ligand and protein (Mocz & Ross, Citation2013). In this experiment, fluorescence titration analysis was carried out to validate the interaction between CTX and TNFR1. When binding occurs between a compound and a fluorophore, the fluorescence of that fluorophore might alter in different ways. Thus, the binding might cause either a change or no change at all in fluorescence (Yammine et al., Citation2019). The presence of amino acid residues such as Tyr, Trp and Phe is responsible for intrinsic fluorophore properties. There are 13 Tyr residues, 14 Phe residues and 5 Trp residues in TNFR1 for intrinsic fluorophore characteristics.
As illustrated in , a maximum fluorescence intensity (ϕem) was observed at the wavelength (λ) of 336 nm. There was no shift in the emission peak of CTX–TNFR1 when the time increased from 0 to 30 min. Nevertheless, as the concentrations of CTX increased, there was a noticeable reduction of ϕem, known as quenching effect. The quenching happened when the binding site of TNFR1 was occupied with CTX, when concentrations of CTX increased, more binding sites on TNFR1 were occupied leading to a reduction of ϕem (Albani, Citation2004; Dunn, Citation2007). Subsequently, we constructed Stern–Volmer plot () for CTX–TNFR1 interactions based on the fluorescence emission spectra at different time points. The Stern–Volmer constant, Ksv was derived from the gradient of this plot (). Ksv defines the availability of a quencher to the excited fluorophore, and its increased points to the reduction of distance between a ligand and its target. In brief, it represents the accessibility of a quencher to its fluorophore. In general, the higher the Ksv, the higher the availability of a fluorophore to bind to its quencher (Möller & Denicola, Citation2006).
Figure 7. Fluorescence quenching titration curves of tumor necrosis factor receptor 1 (TNFR1) in the presence of increasing concentrations of cytotoxin (CTX) at different (A) 0 min, (B) 10 min, (C), 20 min and (D) 30 min.
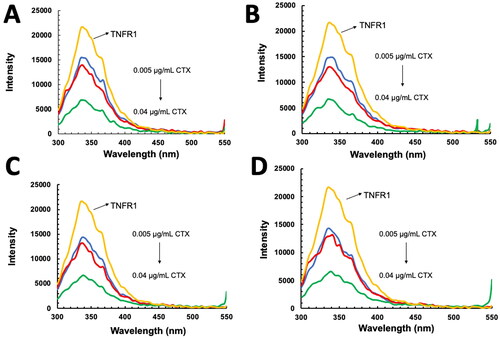
Figure 8. Fluorescence data analysis of interaction between tumor necrosis factor receptor 1 (TNFR1) and cytotoxin (CTX). (A) Stern–Volmer plot of TNFR1–CTX interactions; (B) Double logarithmic plot of TNFR1-CTX interactions, obtained from fluorescence quenching analysis at four different time points.
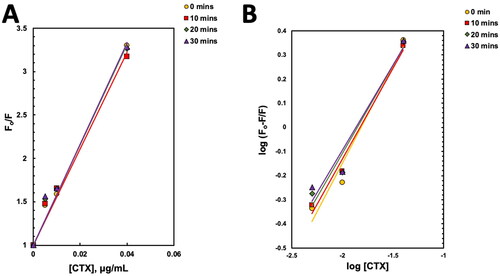
Table 5. The Stern–Volmer constants obtained from the slope of Stern–Volmer plot.
As time progressed from 0 to 30 min, there were no significant changes in Ksv values (), this suggested that interaction time did not affect the accessibility of binding site on TNFR1 to CTX. As both quencher and fluorophore in CTX–TNFR1 interactions are proteins with the presence of intrinsic fluoresce amino acid residues, they can excite before forming the complexes. Thus, as the fluorophores in CTX and TNFR1 collided between each other, it reduced the intensity of the fluorescence emitted (ϕem) as observed in . As the concentration of CTX increased, the Fo/F ratio increased proportionally suggesting a concentration-dependent interaction of CTX with TNFR1.
Binding parameters of CTX–TNFR1 interactions
The Kb for CTX–TNFR1 interactions () were obtained from the double-logarithmic plots of modified Stern–Volmer equation (). This plot was used to determine the binding constant (Kb) of fluorescence quenching (Das et al., Citation2020) between CTX and TNFR1 interactions. The number of binding sites (n) was closer to 1, inferring a primary binding site between CTX and TNFR1 involving the functional loops of CTX. The Kb was used to determine the extent of fluorescence quenching of TNFR1 with different concentration of CTX (Chaves et al., Citation2018). The lower the Kb values, the higher the binding affinity. As the times progressed from 0 to 30 min, the Kb values reduced () indicating an increase in the binding affinity between CTX and TNFR1, whereby the longer the interaction time, the better the binding of CTX to TNFR1.
Table 6. The binding parameters of CTX–TNFR1 interaction obtained from double-logarithmic plot.
Conclusions
A conserved amino acid sequence of Naja CTX consisting of 62 amino acid residues was acquired from multiple sequence alignments of different CTX isoforms. According to its three-dimensional structure, this conserved CTX is an S-type CTX whereby β-pleated sheets remained the main secondary structure. The CTX also retained the conserved three-finger loop structure of contemporary CTX. The molecular docking screening of potential death receptors for CTX revealed that TNFR1 was the best interacting death receptor of CTX, based on the HADDOCK score, Z-score and RMSD value. Furthermore, the ensemble-based virtual screening demonstrated three different conformational ensembles whereby CE3 was the best representative structure to indicate interactions between CTX and TNFR1. The functional loops’ residues of CTX exhibited significant interactions with the ligand-binding sites on TNFR1 via non-covalent bonds. As demonstrated by fluorescence titration analysis, the emission peak of CTX–TNFR1 remained the same at different time points as the concentration of CTX increased, a significant reduction of fluorescence intensity suggesting an interaction of CTX with TNFR1 together with an increase of binding affinity. Altogether, the findings suggested a plausible molecular target of CTX, which provides insights into its actual molecular mechanisms of cytotoxicity.
Supplemental Material
Download MS Word (2.3 MB)Disclosure statement
The authors declare that there are no competing interests.
Additional information
Funding
References
- Abraham, M. J., Murtola, T., Schulz, R., Pall, S., Smith, J. C., Hess, B., & Lindahl, E. (2015). GROMACS: High performance molecular simulations through multi-level parallelism from laptops to supercomputers. SoftwareX, 1–2, 19–25. https://doi.org/10.1016/j.softx.2015.06.001
- Albani, J. R. (2004). Fluorescence quenching. In Structure and dynamics of macromolecules: Absorption and fluorescence studies (pp. 141–192). Elsevier Sciences. https://doi.org/10.1016/B978-044451449-3/50004-6
- Ashkenazi, A., & Dixit, V. (1998). Death receptors: Signaling and modulation. Science (New York, N.Y.), 281(5381), 1305–1308. https://doi.org/10.1126/science.281.5381.1305
- Chaves, O. A., Tavares, M. T., Cunha, M. R., Parise-Filho, R., Sant’Anna, C. M. R., & Netto-Ferreira, J. C. (2018). Multi-spectroscopic and theoretical analysis on the interaction between human serum albumin and a capsaicin derivative-RPF101. Biomolecules, 8(3), 78. https://doi.org/10.3390/biom8030078
- Chien, C. M., Chang, S. Y., Lin, K. L., Chiu, C. C., Chang, L. S., & Lin, S. R. (2010). Taiwan cobra cardiotoxin III inhibits Src kinase leading to apoptosis and cell cycle arrest of oral squamous cell carcinoma Ca9-22 cells. Toxicon, 56(4), 508–520. https://doi.org/10.1016/j.toxicon.2010.05.007
- Chien, K. Y., Chiang, C. M., Hseu, Y. C., Vyas, A. A., Rule, G. S., & Wu, W. (1994). Two distinct types of cardiotoxin as revealed by the structure and activity relationship of their interaction with zwitterionic phospholipid dispersions. Journal of Biological Chemistry, 269(20), 14473–14483. https://doi.org/10.1016/S0021-9258(17)36647-4
- Chien, C., Yang, S., Chang, L., & Lin, S. (2008). Involvement of both endoplasmic reticulum- and mitochondria-dependent pathways in cardiotoxin III-induced apoptosis in HL-60 cells. Clinical and Experimental Pharmacology and Physiology, 35(9), 1059–1064. https://doi.org/10.1111/j.1440-1681.2008.04968.x
- Colubri, A., Jha, A., Shen, M., Sali, A., Berry, R., Sosnick, T., & Freed, K. (2006). Minimalist representations and the importance of nearest neighbor effects in protein folding simulations. Journal of Molecular Biology, 363(4), 835–857. https://doi.org/10.1016/j.jmb.2006.08.035
- Das, T., Bhattacharya, S., Biswas, A., Gupta, S. D., Gomes, A., & Gomes, A. (2013). Inhibition of leukemic U937 cell growth by induction of apoptosis, cell cycle arrest and suppression of VEGF, MMP-2 and MMP-9 activities by cytotoxin protein NN-32 purified from Indian spectacled cobra (Naja naja) venom. Toxicon, 65, 1–4. https://doi.org/10.1016/j.toxicon.2013.01.004
- Das, S., Sarmah, S., Hazarika, Z., Rohman, M. A., Sarkhel, P., Jha, A. N., & Roy, A. S. (2020). Targeting the heme protein hemoglobin by (−)-epigallocatechin gallate and the study of polyphenol–protein association using multi-spectroscopic and computational methods. Physical Chemistry Chemical Physics, 22, 2212–2228. https://doi.org/10.1039/C9CP05301H
- de Vries, S., van Dijk, M., & Bonvin, A. (2010). The HADDOCK web server for data-driven biomolecular docking. Nature Protocol, 5, 883–897. https://doi.org/10.1038/nprot.2010.32
- Dubovskii, P., Lesovoy, D., Dubinnyi, M., Konshina, A., Utkin, Y., Efremov, R., & Arseniev, A. (2005). Interaction of three-finger toxins with phospholipid membranes: Comparison of S- and P-type cytotoxins. Biochemical Journal, 387(3), 807–815. https://doi.org/10.1042/BJ20041814
- Dunn, S. (2007). Fluorescence measurements of receptor–ligand interactions. In A. Lajtha, G. Baker, S. Dunn, & A. Holt (Eds.), Handbook of neurochemistry and molecular neurobiology. Springer. https://doi.org/10.1007/978-0-387-30401-4_5
- Ebrahim, K., Shirazi, F., Mirakabadi, A., & Vatanpour, H. (2015). Cobra venom cytotoxins, apoptotic or necrotic agents? Toxico, 108, 134–140. https://doi.org/10.1016/j.toxicon.2015.09.017
- Ebrahim, K., Shirazi, F. H., Vatanpour, H., Zare, A., Kobarfard, F., & Rabiei, H. (2014). Anticancer activity of cobra venom polypeptide, cytotoxin-II, against human breast adenocarcinoma cell line (MCF-7) via the induction of apoptosis. Journal of Breast Cancer, 17(4), 314–322. https://doi.org/10.4048/jbc.2014.17.4.314
- Eswar, N., Webb, B., Marti-Renom, M., Madhusudhan, M., Eramian, D., Shen, M., Pieper, U., & Sali, A. (2006). Comparative protein structure modelling using modeller. Current Protocols in Bioinformatics, 54(11), 5.6.1–5.6.30. https://doi.org/10.1002/cpbi.3
- Faubion, W., & Gores, G. (1999). Death receptors in liver biology and pathobiology. Hepatology, 29, 1–4. https://doi.org/10.1002/hep.510290101
- Feofanov, A., Sharonov, G., Dubinnyi, M., Astapova, M., Kudelina, I., Dubovskii, P., Rodionov, D., Utkin, Y., & Arseniev, A. (2004). Comparative study of structure and activity of cytotoxins from venom of the cobras Naja oxiana, Naja kaouthia, and Naja haje. Biochemistry. Biokhimiia, 69(10), 1148–1157. https://doi.org/10.1023/B:BIRY.0000046890.46901.7e
- Fernández-Recio, J., Totrov, M., & Abagyan, R. (2004). Identification of protein–protein interaction sites from docking energy landscapes. Journal of Molecular Biology, 335(3), 843–865. https://doi.org/10.1016/j.jmb.2003.10.069
- Fischer, R., Kontermann, R., & Pfizenmaier, K. (2020). Selective targeting of TNF receptors as a novel therapeutic approach. Frontiers in Cell Developmental Biology, 8, 401. https://doi.org/10.3389/fcell.2020.00401
- Forouhar, F., Huang, W. N., Liu, J. H., Chien, K. Y., Wu, W. G., & Hsiao, C. D. (2003). Structural basis of membrane-induced cardiotoxin A3 Oligomerization. The Journal of Biological Chemistry, 278(24), 21980–21988. https://doi.org/10.1074/jbc.M208650200
- Gasanov, S. E., Shrivastava, I. H., Israilov, F. S., Kim, A. A., Rylova, K. A., Zhang, B., & Dagda, R. K. (2015). Naja naja oxiana cobra venom cytotoxins CTI and CTII disrupt mitochondrial membrane integrity: Implications for basic three-fingered cytotoxins. PLoS One. 10, e0129248. https://doi.org/10.1371/journal.pone.0129248
- Guicciardi, M., & Gores, G. (2009). Life and death by death receptors. The FASEB Journal, 23(6), 1625–1637. https://doi.org/10.1096/fj.08-111005
- Hess, B. (2008). LINCS: A parallel linear constraint solver for molecular simulation. Journal of Chemical Theory and Computation, 4, 116–122. P https://doi.org/10.1021/ct700200b
- Hevener, K., Zhao, W., Ball, D., Babaoglu, K., Qi, J., White, S., & Lee, R. (2009). Validation of molecular docking programs for virtual screening against dihydropteroate synthase. Journal of Chemical Information & Modeling, 49, 444–460. https://doi.org/10.1021/ci800293n
- Hiu, J. J., & Yap, M. K. K. (2021). The effects of Naja sumatrana venom cytotoxin, sumaCTX on alteration of the secretome in MCF-7 breast cancer cells following membrane permeabilization. International Journal of Biological Macromolecules, 184, 776–786. https://doi.org/10.1016/j.ijbiomac.2021.06.145
- Hovmöller, S., Zhou, T., & Ohlson, T. (2002). Conformations of amino acids in proteins. Acta Crystallographica Section D Biological Crystallography, 58, 768–776. https://doi.org/10.1107/S0907444902003359
- Irina, K., &Abagyan, R. (2012). Methods of protein structure comparison. Methods in Molecular Biology, 857, 231–257.
- Jorgensen, W., Maxwell, D., & Tirado-Rives, J. (1996). Development and testing of the OPLS all-atom force field on conformational energetics and properties of organic liquids. Journal of the American Chemistry Society, 118, 11225–11236. https://doi.org/10.1021/ja9621760
- Kastritis, P., Rodrigues, J., Folkers, G., Boelens, R., & Bonvin, A. (2014). Proteins feel more than they see: Fine-tuning of binding affinity by properties of the non-interacting surface. Journal of Molecular Biology, 426(14), 2632–2652. https://doi.org/10.1016/j.jmb.2014.04.017
- Kelley, R., Totpal, K., Lindstrom, S., Mathieu, M., Billeci, K., DeForge, L., Pai, R., Hymowitz, S., & Ashkenazi, A. (2005). Receptor-selective mutants of apoptosis-inducing ligand 2/tumor necrosis factor-related apoptosis-inducing ligand reveal a greater contribution of death receptor (DR) 5 than DR4 to apoptosis signaling. The Journal of Biological Chemistry, 280(3), 2205–2212. https://doi.org/10.1074/jbc.M410660200
- Khezri, A., Karimi, A., Yazdian, F., Jokar, M., Mofradnia, S. R., Rashedi, H., & Tavakoli, Z. (2018). Molecular dynamic of curcumin/chitosan interaction using a computational molecular approach: Emphasis on biofilm reduction. International Journal of Biological, Macromolecules, 114, 972–978. https://doi.org/10.1016/j.ijbiomac.2018.03.100
- Kini, R. (2002). Molecular moulds with multiple missions: Functional sites in three-finger toxins. Clinical & Experimental Pharmacology & Physiology, 29(9), 815–822. https://doi.org/10.1046/j.1440-1681.2002.03725.x
- Konshina, A. G., Dubovskii, P., & Efremov, R. G. (2012). Structure, and dynamics of cardiotoxins. Current Protein & Peptide Science, 13, 570–584. https://doi.org/10.2174/138920312803582960
- Kumar, T., Jayaraman, G., Lee, C., Arunkumar, A., Sivaraman, T., Samuel, D., & Yu, C. (1997). Snake venom cardiotoxins-structure, dynamics, function and folding. Journal of Biomolecular Structure & Dynamics, 15(3), 431–463. https://doi.org/10.1080/07391102.1997.10508957
- Kuwano, K., & Hara, N. (2000). Signal transduction pathways of apoptosis and inflammation induced by the tumor necrosis factor receptor family. American Journal of Respiratory & Cell Molecular Biology, 22, 147–149. https://doi.org/10.1165/ajrcmb.22.2.f178
- Larkin, M., Blackshields, G., Brown, N., Chenna, R., McGettigan, P., McWilliam, H., Valentin, F., Wallace, I., Wilm, A., Lopez, R., Thompson, J., Gibson, T., & Higgins, D. (2007). Clustal W and Clustal X version 2.0. Bioinformatics, 23, 2947–2948. https://doi.org/10.1093/bioinformatics/btm404
- Laskowski, R., Jabłońska, J., Pravda, L., Vařeková, R., & Thornton, J. (2017). PDBsum: Structural summaries of PDB entries. Protein Science, 27, 129–134. https://doi.org/10.1002/pro.3289
- Lavrik, I. (2005). Death receptor signaling. Journal of Cell Science, 118, 265–267. https://doi.org/10.1242/jcs.01610
- Li, M. H., Luo, Q., Xue, X. G., & Li, Z. S. (2011). Molecular dynamics studies of the 3D structure and planar ligand binding of a quadruplex dimer. Journal of Molecular Modeling, 17, 515–526. https://doi.org/10.1007/s00894-010-0746-0
- Lin, K. L., Su, J. C., Chien, C. M., Chuang, P. W., Chang, L. S., & Lin, S. R. (2010). Downregulation of the JAK2/PI3K-mediated signaling activation is involved in Taiwan cobra cardiotoxin III-induced apoptosis of human breast MDA-MB-231 cancer cells. Toxicon, 55, 1263–1673. https://doi.org/10.1016/j.toxicon.2010.01.017
- Maiti, R., Van Domselaar, G., Zhang, H., & Wishart, D. (2004). SuperPose: A simple server for sophisticated structural superposition. Nucleic Acids Research, 32(Web Server issue), W590–W594. https://doi.org/10.1093/nar/gkh477
- Mark, P., & Nilsson, L. (2001). Structure and dynamics of the TIP3P, SPC, and SPC/E water models at 298 K. The Journal of Physical Chemistry A, 105, 9554–9960. https://doi.org/10.1021/jp003020w
- Martínez, L. (2015). Automatic identification of mobile and rigid substructures in molecular dynamics simulations and fractional structural fluctuation analysis. PLoS One, 10, e0119264. https://doi.org/10.1371/journal.pone.0119264
- McGibbon, R. T., Beauchamp, K. A., Harrigan, M. P., Klein, C., Swails, J. M., Hernández, C. X., Schwantes, C. R., Wang, L. P., Lane, T. J., & Pande, V. S. (2015). MDTraj: A modern open library for the analysis of molecular dynamics trajectories. Biophysical Journal, 109, 1528–1532. https://doi.org/10.1016/j.bpj.2015.08.015
- Melo, F., Sánchez, R., & Sali, A. (2009). Statistical potentials for fold assessment. Protein Science, 11(2), 430–448. https://doi.org/10.1002/pro.110430
- Micheau, O., & Tschopp, J. (2003). Induction of TNF Receptor I-mediated apoptosis via two sequential signaling complexes. Cell, 114, 181–190. https://doi.org/10.1016/S0092-8674(03)00521-X
- Mocz, G., & Ross, J. A. (2013). Fluorescence techniques in analysis of protein–ligand interactions. In: M. Williams, & T. Daviter (Eds.), Protein-ligand interactions. Methods in molecular biology (vol. 1008). Humana Press. https://doi.org/10.1007/978-1-62703-398-5_7
- Möller, M., & Denicola, A. (2006). Protein tryptophan accessibility studied by fluorescence quenching. Biochemistry & Molecular Biology Education, 30, 175–178. https://doi.org/10.1002/bmb.2002.494030030035
- Mondal, J., Friesner, R., & Berne, B. (2014). Role of desolvation in thermodynamics and kinetics of ligand binding to a kinase. Journal of Chemical Theory & Computation, 10, 5696–5705. https://doi.org/10.1021/ct500584n
- Nooren, I., & Thornton, J. (2003). Structural characterization and functional significance of transient protein-protein interactions. Journal of Molecular Biology, 325(5), 991–1018. https://doi.org/10.1016/S0022-2836(02)01281-0
- Piovesan, D., Minervini, G., & Tosatto, S. (2016). The RING 2.0 web server for high quality residue interaction networks. Nucleic Acids Research, 44, W367–W374. https://doi.org/10.1093/nar/gkw315
- Prasad, K., Nikzad, M., Nisha, S. S., & Sbarski, I. (2021). On the use of molecular dynamics simulations for elucidating fine structural, physico-chemical and thermomechanical properties of lignocellulosic systems: Historical and future perspectives. Journal of Composites Science, 5, 55. https://doi.org/10.3390/jcs5020055
- Ramírez, D., & Caballero, J. (2018). Is it reliable to take the molecular docking top scoring position as the best solution without considering available structural data? Molecules, 23(5), 1038. https://doi.org/10.3390/molecules23051038
- Ramirez, L. M., Shekhtman, A., & Pande, J. (2020). Hydrophobic residues of melittin mediate its binding to αA-crystallin. Protein Science, 29, 572–588. https://doi.org/10.1002/pro.3792
- Shahraki, O., Zargari, F., Edraki, N., Khoshneviszadeh, M., Firuzi, O., & Miri, R. (2018). Molecular dynamics simulation and molecular docking studies of 1,4-dihydropyridines as P-glycoprotein’s allosteric inhibitors. Journal of Biomolecular Structure and Dynamics, 36, 112–125. https://doi.org/10.1080/07391102.2016.1268976
- Suzuki-Matsubara, M., Athauda, S., Suzuki, Y., Matsubara, K., & Moriyama, A. (2016). Comparison of the primary structures, cytotoxicities, and affinities to phospholipids of five kinds of cytotoxins from the venom of Indian cobra, Naja naja. Comparative Biochemistry and Physiology Part C: Toxicology & Pharmacology, 79, 158–164. https://doi.org/10.1016/j.cbpc.2015.09.015
- Teoh, S. Q., & Yap, M. K. K. (2020). Naja sumatrana venom cytotoxin, sumaCTX exhibits concentration-dependent cytotoxicity via caspase-activated mitochondrial-mediated apoptosis without transitioning to necrosis. Toxin Review, 40, 1–15. https://doi.org/10.1080/15569543.2020.1799408
- Tubiana, T., Carvaillo, J., Boulard, Y., & Bressanelli, S. (2018). TTClust: A versatile molecular simulation trajectory clustering program with graphical summaries. Journal of Chemical Information & Modeling, 58, 2178–2182. https://doi.org/10.1021/acs.jcim.8b00512
- van Zundert, G., Rodrigues, J., Trellet, M., Schmitz, C., Kastritis, P., Karaca, E., Melquiond, A., van Dijk, M., de Vries, S., & Bonvin, A. (2016). The HADDOCK2.2 web server: User-friendly integrative modeling of biomolecular complexes. Journal of Molecular Biology, 428(4), 720–725. https://doi.org/10.1016/j.jmb.2015.09.014
- Vangone, A., & Bonvin, A. (2015). Contacts-based prediction of binding affinity in protein–protein complexes. eLife, 4, e07454. https://doi.org/10.7554/eLife.07454
- Vangone, A., Rodrigues, J., Xue, L., van Zundert, G., Geng, C., Kurkcuoglu, Z., Nellen, M., Narasimhan, S., Karaca, E., van Dijk, M., Melquiond, A., Visscher, K., Trellet, M., Kastritis, P., & Bonvin, A. (2016). Sense and simplicity in HADDOCK scoring: Lessons from CASP-CAPRI round 1. Proteins: Structure, Function, and Bioinformatics, 85, 417–423. https://doi.org/10.1002/prot.25198
- Wajant, H. (2003). Death receptors. Essays in Biochemistry, 39, 53–71. https://doi.org/10.1042/bse0390053
- Webb, B., & Sali, A. (2016). Comparative protein structure modeling using MODELLER. Current Protocols in Bioinformatics, 54, 5.6.1–5.6.37. https://doi.org/10.1002/cpbi.3
- Wu, M., Ming, W., Tang, Y., Zhou, S., Kong, T., & Dong, W. (2013). The anticancer effect of cytotoxin 1 from Naja atra Cantor venom is mediated by a lysosomal cell death pathway involving lysosomal membrane permeabilization and cathepsin B release. The American Journal of Chinese Medicine, 41, 643–663. https://doi.org/10.1142/S0192415X13500456
- Xue, L., Rodrigues, J., Kastritis, P., Bonvin, A., & Vangone, A. (2016). PRODIGY: A web server for predicting the binding affinity of protein–protein complexes. Bioinformatics, 32, 3676–3678. https://doi.org/10.1093/bioinformatics/btw514
- Yammine, A., Gao, J., & Kwan, A. H. (2019). Tryptophan fluorescence quenching assays for measuring protein-ligand binding affinities: Principles and a practical guide. Bio-protocol, 9(11), e3253. https://doi.org/10.21769/BioProtoc.3253
- Yang, S., Chien, C., Lu, M., Lu, Y., Wu, Z., & Lin, S. (2005). Cardiotoxin III induces apoptosis in K562 cells through a mitochondrial-mediated pathway. Clinical and Experimental Pharmacology and Physiology, 32, 515–520. https://doi.org/10.1111/j.1440-1681.2005.04223.x
- Yap, M. K. K., Tan, N. H., Sim, S. M., & Fung, S. Y. (2013). Toxicokinetics of Naja sputatrix (Javan spitting cobra) venom following intramuscular and intravenous administrations of the venom into rabbits. Toxicon, 68, 18–23. https://doi.org/10.1016/j.toxicon.2013.02.017
- Yap, M. K. K., Tan, N. H., Sim, S. M., Fung, S. Y., & Tan, C. H. (2014). Pharmacokinetics of Naja sumatrana (equatorial spitting cobra) venom and its major toxins in experimentally envenomed rabbits. PLoS Neglected Tropical Diseases, 8, e2890. https://doi.org/10.1371/journal.pntd.0002890
- Zhang, L., & Cui, L. (2007). A cytotoxin isolated from Agkistrodon acutus snake venom induces apoptosis via Fas pathway in A549 cells. Toxicology in Vitro, 21, 1095–1103. https://doi.org/10.1016/j.tiv.2007.04.008
- Zhao, Y., Zeng, C., & Massiah, M. A. (2015). Molecular dynamics simulation reveals insights into the mechanism of unfolding by the A130T/V mutations within the MID1 zinc-binding Bbox1 domain. PLoS One. 10, e0124377. https://doi.org/10.1371/journal.pone.0124377