Article title: An in-silico approach to the potential modulatory effect of taurine on sclerostin (SOST) and its probable role during osteoporosis
Authors: Adhish, M., & Manjubala, I.
Journal: Journal of Biomolecular Structure and Dynamics
DOI: http://dx.doi.org/10.1080/07391102.2023.2249103
The above-mentioned article was originally published with containing molecular dynamic simulation graphs up to 50 ns. The actual simulation was for 100 ns.
The figure has now been replaced in the above-mentioned article.
The corrected figure is also placed below:
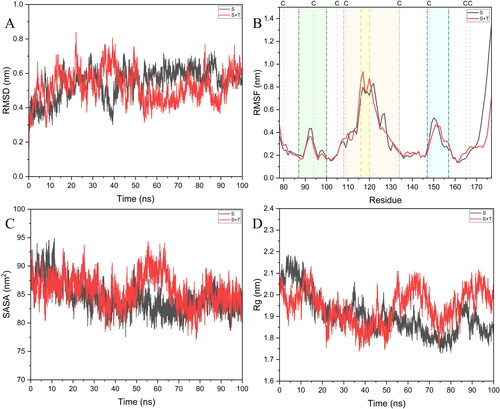
Figure 5. MD simulation trajectory analysis. (A) RMSD graph of unbound SOST (S) and taurine bound SOST (S + T); (B) RMSF graph of the unbound and taurine bound SOST where the Green transparent region shows the loop 1 of SOST, the yellow transparent region shows the loop 2 of SOST, the deep yellow region shows the PNAIG motif present in the loop 2, the blue region shows the loop 3 of SOST and the purple dashes across the graph shows the cysteine residues forming the cysteine knots in the SOST structure; (C) SASA graph of unbound and taurine bound SOST; (D) Rg graph of the unbound and taurine bound SOST.