

Abstract
Estimation of incidence rate and quick detection of its increases are important tasks in public health surveillance. In addition to being an efficient tool for online parameter estimation, the Exponentially Weighted Moving Average (EWMA) method has been widely used as an effective monitoring tool in statistical process control. Motivated by its successful applications, several EWMA-type methods are discussed for monitoring and estimating the incidence rate of adverse events in health care applications. The comparison results show that the conventional EWMA chart has a superior performance in detecting small shifts that occur at the start-up but very poor performance when shifts occur at a later time point. Instead, the adaptive EWMA method that is capable of dynamically updating its smoothing parameter can provide an overall good detection performance when shifts occur at both the first time point and a later time point. This result is validated using male thyroid cancer data in New Mexico.
Appendix A: Simulation algorithms for approximating ARL and CED
The algorithms for simulating the ARL0 estimates of the three charts are based on the following three-step procedure.
Generate the simulation data. At each time step, t = 1, 2, …, we generate the population size,
, from Equation (Equation15
Record the run length. Based on the generated data point, (
Estimate the ARL. Steps (1) and (2) are repeated for a number of replicates, say, 80 000. The average of run lengths over all replications is the estimated ARL0.
Note that the prespecified control limit may not provide an ARL0 close to the target in-control ARL, M, for a control chart. In order to provide a desired ARL0, the control limit needs to be adjusted. This is done by using a binary search algorithm. Take the EWMA chart as an example; the procedure for determining L1 consists of (i) selecting a rough interval L1 ∈ [Lmin , Lmax ] such that Lmax yields an ARL0 value larger than M while Lmin yields an ARL0 value smaller than M and (ii) updating the L1 value based on a bisection method until the observed ARL0 is sufficiently close to M.
To simulate the out-of-control behavior of the aforementioned methods, one can follow nearly the same procedure as above except assuming that the incidence rate increases to π1 at time τ (τ ≥ 1). In particular, in the out-of-control situation, Yt was generated in step (1) from Poisson distribution with mean for t = 1, 2, …τ − 1 , and from the Poisson distribution with mean
for t = τ, τ + 1, … The remaining two steps remain the same. When τ = 1, the number of observations until the first out-of-control signal is recorded as ARL1. The CED is approximated by the average of tA − τ, where tA denotes the recorded alarm time in each simulation run. Based on different values of τ, we can quantify how the CED performance of the above methods changes with the change point time τ.
Appendix B: Simulation comparison under other population models
In order to make the comparison more complete, Shu et al. (2011) also considered some variations to the base model, which are summarized in . These four models were not selected to represent any specific population growth process but rather to represent a wide variety of hypothetical population growth patterns. When compared with the base model, Model 1 with φ2 = 37.8532 generates smaller initial population size () but the same steady-state population size (
). Models 2 to 4 generate the same initial value of
as the base model but approach different steady-state population sizes. (a) and A1(b) plot the ARL1 and CED ( τ = 51) curves of the EWMA, MEWMA, WEWMA, and AEWMA charts under Model 1 when ARL0 = 200 and λ = 0.05, respectively. The comparison results under other growth models are similar to that under Model 1. For the sake of simplicity, they are not presented here.
Fig. A1. The detection performance of the EWMA, MEWMA, WEWMA, and AEWMA methods based on under Model 1 when (a)
and (b)
.
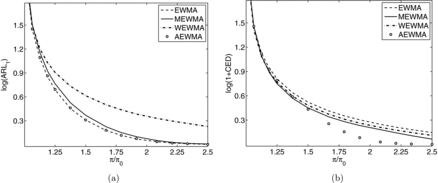
Table A1 The modified population growth models
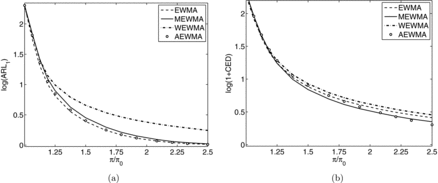
The above population models are monotonically increasing population models, which is often the case in practice. There may be a few situations where the population size decreases over time. In the logistic model of Equation (Equation15(15) ), a negative value of φ3 characterizes a decreasing population trend. As studied in Mei et al. (2011), we consider the following population decay model:
(A1)
(a) and A2(b) plot the ARL1 and CED (τ = 51) curves of the EWMA, MEWMA, WEWMA, and AEWMA charts under this population decay model when ARL0 = 200 and λ = 0.05, respectively.
Fig. A2. The detection performance of the EWMA, MEWMA, WEWMA, and AEWMA methods based on under a decreasing population model when (a)
and (b)
.
It is also of interest to compare the EWMA, MEWMA, WEWMA, and AEWMA charts under the case with a constant population size. According to the base population model in Equation (Equation16(16) ), the population size approaches the stationary value of n∞ = 13.8065 in the long run. For illustration, presents the ARL1 and CED performance of the four charts based on the constant population size of nt = 13.8065 when λ = 0.05. The corresponding control factors for the EWMA, MEWMA, WEWMA, and AEWMA charts for maintaining ARL0 = 200 are given by L = 1.891, 2.214, 1.633, and 1.929, respectively.
Fig. A3. The detection performance of the EWMA, MEWMA, WEWMA, and AEWMA methods based on the constant population size of nt = 13.8065 and when (a)
and (b)
.
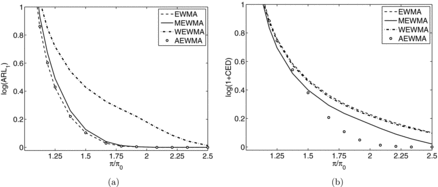
to indicate a similar observation. In particular, when detecting a change at the first time point, the AEWMA method performs similarly to the EWMA chart, both of which perform better than the MEWMA method, and then the WEMWA method over a wide range of hypothetical shifts. When the shift occurs at a later time point, say τ = 51, both the AEWMA and MEWMA methods perform better than the EWMA and WEWMA methods. Compared with the MEWMA method, the AEWMA method has a slightly larger delay at smaller changes but a smaller delay at larger shifts, as can be seen from (b). These observations are also similar to those made based on the base model. to also indicates a good property of the AEWMA chart. That is, the AEWMA method can always provide the best or nearly the best detection performance among all the methods, no matter whether the shift occurs at the first time point or at a later timepoint.
Additional information
Notes on contributors
Lianjie Shu
Lianjie Shu is an Associate Professor in the Faculty of Business Administration at the University of Macau. He received his B.Sc. degree in Mechanical Engineering and Automation from Xi’an Jiao Tong University, and his Ph.D. in Industrial Engineering and Engineering Management from the Hong Kong University of Science and Technology. His current research interests include statistical process control, health care surveillance, and computational statistics. He is an Associate Editor of the Journal of Statistical Computation and Simulation.
Yan Su
Yan Su is an Assistant Professor in the Department of Electromechanical Engineering at the University of Macau. She received her master’s and Ph.D. degrees in Mechanical Engineering from the Hong Kong University of Science and Technology and University of Minnesota, respectively, and her B.Sc. degree in Thermal Engineering from Tsinghua University. Her research interests include numerical methods, energy and solar energy systems, porous media, and heat transfer.
Wei Jiang
Wei Jiang is a Professor of Operations Management at Shanghai Jiaotong University. He holds a B.S. (1989) in Mathematics, an M.S. (1992) in Statistics from Xi’an Jiaotong University, and a Ph.D. (2000) in Industrial Engineering and Engineering Management from Hong Kong University of Science and Technology. His research interests are in statistical quality control and improvement, data mining and business intelligence, all aspects of operations management including health care optimization, and financial risk management. He is an Associate Editor of Naval Research Logistics and a recipient of the NSF CAREER Award in 2005.
Kwok-Leung Tsui
Kwok-Leung Tsui is the Chair Professor and Head of the Systems Engineering and Engineering Management Department at the City University of Hong Kong. Previously he was a Professor in the School of Industrial and Systems Engineering at the Georgia Institute of Technology. He currently serves as Quality and Reliability Departmental Editor of IIE Transactions. He has also held various chair positions in the INFORMS Quality, Statistics, and Reliability Section and Data Mining Section. He is a Fellow of the ASA and member of ASQ and INFORMS. His current research interests include data mining, systems and health informatics, quality control, and computer experiment modeling.