
ABSTRACT
Desynchronization between the master clock in the brain, which is entrained by (day) light, and peripheral organ clocks, which are mainly entrained by food intake, may have negative effects on energy metabolism. Bile acid metabolism follows a clear day/night rhythm. We investigated whether in rats on a normal chow diet the daily rhythm of plasma bile acids and hepatic expression of bile acid metabolic genes is controlled by the light/dark cycle or the feeding/fasting rhythm. In addition, we investigated the effects of high caloric diets and time-restricted feeding on daily rhythms of plasma bile acids and hepatic genes involved in bile acid synthesis. In experiment 1 male Wistar rats were fed according to three different feeding paradigms: food was available ad libitum for 24 h (ad lib) or time-restricted for 10 h during the dark period (dark fed) or 10 h during the light period (light fed). To allow further metabolic phenotyping, we manipulated dietary macronutrient intake by providing rats with a chow diet, a free choice high-fat-high-sugar diet or a free choice high-fat (HF) diet. In experiment 2 rats were fed a normal chow diet, but food was either available in a 6-meals-a-day (6M) scheme or ad lib. During both experiments, we measured plasma bile acid levels and hepatic mRNA expression of genes involved in bile acid metabolism at eight different time points during 24 h. Time-restricted feeding enhanced the daily rhythm in plasma bile acid concentrations. Plasma bile acid concentrations are highest during fasting and dropped during the period of food intake with all diets. An HF-containing diet changed bile acid pool composition, but not the daily rhythmicity of plasma bile acid levels. Daily rhythms of hepatic Cyp7a1 and Cyp8b1 mRNA expression followed the hepatic molecular clock, whereas for Shp expression food intake was leading. Combining an HF diet with feeding in the light/inactive period annulled CYp7a1 and Cyp8b1 gene expression rhythms, whilst keeping that of Shp intact. In conclusion, plasma bile acids and key genes in bile acid biosynthesis are entrained by food intake as well as the hepatic molecular clock. Eating during the inactivity period induced changes in the plasma bile acid pool composition similar to those induced by HF feeding.
Introduction
Bile acids are lipid emulgators that are released into the intestines after food intake to aid the uptake of lipids and lipid-soluble vitamins. Via the portal vein, bile acids recycle back to the liver and are stored again in the gallbladder. A small amount of bile acids escapes hepatic uptake and enters the systemic circulation. Early studies in humans have shown that bile acid concentrations in the systemic circulation show a diurnal rhythm and peak after food intake (Angelin and Bjorkhem Citation1977; LaRusso et al. Citation1978; Schalm et al. Citation1978; Setchell et al. Citation1982). The postprandial bile acid peak increases with a higher fat content of food (Sonne et al. Citation2016). In mice, plasma bile acid concentrations are high during the feeding period, irrespective whether food intake takes place during the normal dark phase (Ma et al. Citation2009; Zhang et al. Citation2011), the light phase (Ma et al. Citation2009) or after a fasting period (Li et al. Citation2012). The postprandial peak, together with expression of bile acid receptors in metabolic organs, suggests that bile acids may function as hormones that signal energy availability. Indeed in recent years it has been proposed they function as signaling molecules in lipid, glucose and their own metabolism (Kuipers et al. Citation2014).
The liver releases primary bile acids that are conjugated to glycine (g) or taurine (t). Most bile acids are reabsorbed in the gut. Microbiota in the colon are responsible for deconjugation and dehydroxylation, converting primary bile acids into secondary forms. Bile acids suppress their own synthesis by activating the nuclear farnesoid X receptor (FXR) which induces transcription of short heterodimer partner (Shp) in the liver and intestinal release of FGF15 (Lefebvre et al. Citation2009). Both pathways lead to the inhibition of Cyp7a1 (7α-hydroxylase), the rate-limiting enzyme of the classical hepatic bile acid synthesis pathway. The expression and activity of hepatic bile acid synthesis enzymes show daily rhythms. In mice, circadian desynchronization alters plasma bile acid levels and hepatic expression of Cyp7a1 (Ferrell and Chiang Citation2015; Ma et al. Citation2009). Moreover, it has been proposed that bile acids are potential chronobiological signals that can affect the molecular clock mechanism (Govindarajan et al. Citation2016; Kim et al. Citation2015). The endogenous rhythms produced by the central and peripheral clocks are generated by an autoregulatory transcriptional feedback loop consisting of the heterodimers CLOCK-BMAL1 and Per (period) and Cry (cryptochrome) (Bass and Takahashi Citation2010; Ko and Takahashi Citation2006). The liver clock is mainly entrained by food in take and bile acids may mediate the positive effects of time-restricted feeding on body weight during high-fat (HF) diet (Chaix and Zarrinpar Citation2015). Thus, it is important to understand how the daily rhythms of bile acid metabolism are regulated and affected by food intake timing and composition.
Only few studies, all in mice, have investigated daily rhythms in bile acid metabolism (Ferrell and Chiang Citation2015; Ma et al. Citation2009; Zhang et al. Citation2011). The main aim of the present study was to investigate the effects of the daily timing of food intake and food composition on daily rhythms in plasma bile acid levels and hepatic mRNA expression of bile acid metabolic genes in rats. In experiment 1 we used time-restricted feeding and different diet compositions to investigate this. In experiment 2 we employed an equidistant feeding (6-meals-a-day (6M)) schedule to differentiate between the effects of food intake and the molecular clock on hepatic gene expression.
Materials and methods
Animals
Male Wistar rats (±200 g) were purchased from Charles River Laboratories International (Sultzfeld, Germany). Upon arrival the rats were housed with 3–4 animals per cage under a 12 h/12 h light/dark cycle (lights on at 07:00 h (= Zeitgeber time (ZT) 0) in temperature (20–21°C) and humidity (44–60%) controlled rooms. The animal protocols were approved by the animal experimental committee of the Royal Netherlands Academy of Arts and Sciences and all experimental procedures were conform the ethical standards.
Experiment 1 (time-restricted feeding and HF diets)
Experimental design
Rats were kept under three feeding paradigms during 5 weeks: food was available ad libitum (ad lib) for 24 h/day or food availability was time-restricted to 10 h in the middle of the dark period (dark fed) or 10 h in the middle of the light period (light fed) each day. To allow further metabolic phenotyping, we manipulated dietary macronutrient intake by providing rats with a chow-only diet, a free-choice high-fat-high-sugar (HFHS) diet or a free-choice HF diet (La Fleur et al. Citation2010).
Rats fed during the light period were kept under the regular light/dark schedule and allowed to acclimatize for 1 week. Rats fed during the dark period were held under a reversed 12 h/12 h light/dark schedule with lights on at 19:00 h and allowed to acclimatize for 4 weeks. Rats fed ad lib were randomly divided over the reversed and normal light/dark schedule. During the acclimatization period rats had ad lib access to water and standard rat chow. Five days before the start of the experiment rats were randomly assigned to stay group-housed or housed individually until the end of the study. Individually housed rats were placed in metabolic cages for 3 days during week 4 of the experiment (data not presented here). In total 226 rats were included in this experiment. The experiment was performed in five successive batches of ~50 rats with consistent starting body weight and acclimatization periods.
Groups and diet
Rats were randomly assigned into seven different diet groups: chow ad lib, chow dark fed, chow light fed, HFHS dark fed, HFHS light fed, HF dark fed and HF light fed. The chow diet groups received a diet consistent of standard rat chow (irradiated Global 18% protein rodent diet no. 2918, Harlan, Horst, the Netherlands). The HFHS diet groups had free access to chow and to a dish of saturated fat (beef tallow, “Ossenwit/Blanc de boeuf”, Vandermoortele, Gent, Belgium) and a bottle of 30% sucrose water (commercially available sugar in water) (la Fleur et al. Citation2007). The HF diet groups had free access to chow and a dish of saturated fat. All groups had ad lib access to regular tap water. Energy densities were 3.1 kcal/g for chow, 9.0 kcal/g for fat and 1.2 kcal/g for sugar. Rats were kept on the diet for five consecutive weeks in which food and drink intake were measured manually twice daily at 7:30 h and 18:00 h. Rats were weighted twice per week. Chow was refreshed once per week, sugar and fat every three days, and water twice per week.
Experiment 2 (equidistant feeding)
Experimental design
Rats were fed a normal chow diet, but food was either available in a 6M schedule or 24 h ad lib (Kalsbeek and Strubbe Citation1998; Su et al. Citation2016a). Three days before the start of the feeding schedule, rats were individually housed and randomly assigned to a normal cage (ad lib group) or a cage with an automated food dispenser (6M group). The food dispenser consisted of a metal food hopper attached to the cage with vertical steel bars through which the rats could gnaw of their food. An automated sliding door prevented food access. Rats in the 6M group had free access to food every 4 h for 12 min during the light phase and 11 min during the dark phase. Water was available 24 h ad lib for all rats. Rats were kept on the feeding schedule for at least 6 weeks.
Tissue collection
In experiment 1, rats were sacrificed at ZT 0, 3, 6, 9, 12, 15, 18 and 21, with ~4 rats per time point for each group. In experiment 2, rats were sacrificed at ZT 2, 5, 8, 11, 14, 17, 20, 23 with n = ~5 per time point per group. The exact number of animals per time point is given in Supplemental Table S1. For both experiments, rats were kept on their diet until sacrifice. Rats were sedated with a high concentration of carbon dioxide before decapitation. Various organs and tissues were collected including the liver and snap frozen in liquid nitrogen. Trunk blood was collected in heparinized tubes, centrifuged for 15 min at 4000 g at 4°C and plasma was stored at −20°C until further analysis.
Bile acid analysis
Plasma bile acid concentrations were determined using liquid chromatography-tandem mass spectrometry (LC/MS/MS) (Supplemental Methods). For every 10 samples prepared, one quality control standard plasma was included. In total, 250 µL internal standard was added to 25 µL plasma, mixed and spun down. The supernatant was poured into a clean glass tube and evaporated under nitrogen at 40°C. Before measuring, samples were reconstituted in 100 µL 50% methanol in water, mixed and spun down. The supernatant was filtered using a 0,2 µm spin-filter and transferred into LC/MS vials for analyses (10 µL injection volume). The assay included 22 different types of bile acids, but not all types were present in rat plasma. Therefore, the plasma total bile acid pool consisted of cholic acid (CA), chenodeoxycholic acid (CDCA), α and β-muricholic acid (β-MCA), deoxycholic acid (DCA), hyodeoxycholic acid (HDCA) and their taurine (t) or glycine (g) conjugated forms. If one of these bile acids did not reach the lower limit of quantification of 0.05 μM, its value was set at 50% of the detection limit.
RNA isolation, cDNA synthesis and qPCR analysis
RNA was isolated and purified using TRI Reagent (Ambion, Waltham, MA, USA) and a total RNA isolation kit (Macherey Nagel, Oensingen, Switzerland) according to the manufacturers’ protocols. The RNA yield was determined with a spectrophotometer (Nanodrop 2000C, Thermo Scientific, Wilmington, DE, USA) and 200 ng RNA was used as input for cDNA synthesis. cDNA was synthesized using the Transcriptor First Strand cDNA synthesis Kit, with oligo d(T) primers (Roche Molecular Biochemicals, Almere, The Netherlands). cDNA reactions without reverse transcriptase were included to check for genomic DNA contamination. Quantitative real-time PCR was done using the SensiFAST SYBR No-ROX kit (Bioline, London, UK) and the Lightcycler 480 (Roche Almere, The Netherlands). Primer sequences are listed in . Quantification was done with LinReg software. The expression value of a gene of interest was normalized to the geometric mean of three reference genes (TBP, cyclophilin and S18) according to the Minimum Information for Publication of Quantitative Real-Time PCR Experiments guidelines (Bustin et al. Citation2009). The expression of the reference genes did not significantly differ between groups.
Table 1. Primer sequences for PCR on liver tissue.
Statistical analysis
JTK cycle software (Hughes et al. Citation2010) was used to analyze if plasma bile acid concentrations or hepatic mRNA expression showed daily rhythmicity by fitting the data on a 24 h sinusoidal curve. For rhythmic outcomes we report the acrophase (ZT of the peak of the circadian curve) and p value. Other statistics were performed in GraphPad Prism 7 (GraphPad Software, La Jolla, CA, USA). The effects of time-restricted feeding and timing of food intake were tested using two-way ANOVA comparing the ad lib, dark-fed and light-fed group on a chow diet and their food state (fed or fasted). For this, the data over 24 h were split in an average for the light phase (ZT 3, 6, 9 and 12) and an average for the dark phase (ZT 15, 18, 21, 0). The effects of diet composition were tested using a two-way ANOVA comparing the dark fed and light group of the chow diet, HFHS diet and HF diet taking all time points over 24 h together (N per group in Supplemental Table S1). Plasma total bile acid concentration over 24 h was compared between the diet groups using a one-way ANOVA. Results were considered statistically significant when p < 0.05. Data in figures are presented as mean ± standard error of the mean (SEM). Line graphs show data in a double plot to better illustrate the rhythm.
Results
Effects of time-restricted feeding
Time-restricted feeding induces day/night rhythm in plasma bile acid levels
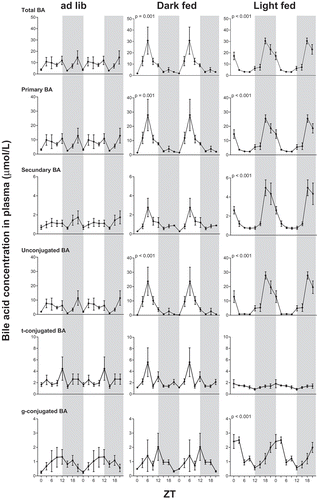
Plasma bile acid concentrations did not show a significant 24 h rhythm in the ad lib chow-fed condition. However, chow time-restricted feeding, either during the dark period or the light period, induced a significant day/night rhythm in plasma bile acid concentrations. The rhythm was shifted ~12 h between the two different periods of food intake ( and ). Surprisingly, plasma bile acid concentrations peaked midway during the fasting period and dropped almost to basal levels again at the start of feeding (Supplemental Figure S1). Similarly, in the ad lib group plasma bile acid levels dropped at ZT15, the first measurement after the onset of the natural (i.e. dark) feeding period.
Table 2. Acrophase (ZT) and circadian rhythm in bile acid plasma concentration and hepatic expression of the bile acid biosynthetic pathway in experiment 1.
Figure 1. Plasma bilogram in rats: effect of timing of food intake on daily plasma bile acid concentrations. Food was available 24 h ad lib (left column), 10 h during the dark period (dark fed, middle column) or 10 h during the light period (light fed, right column). Grey background indicates the dark period and time is shown as ZT. p values are given for statistical significant rhythms as tested by JTK software. BA: bile acids; t: taurine; g: glycine. Note the differences in Y-axis scaling.
Time-restricted feeding during the light period changes the plasma bile acid pool composition
The rat plasma bile acid pool mainly consisted of cholate that is formed by the classical pathway. Restricted feeding enforced a significant rhythm in total bile acids, primary bile acids and unconjugated bile acids (). Additionally, in the light-fed condition a significant rhythm appeared in secondary bile acids and glycine-conjugated bile acids, whereas this was particularly absent in taurine-conjugated bile acids. Therefore, restricted feeding during the light period changed the composition of the plasma bile acid pool to a relative abundance of glycine-conjugated and secondary bile acids ( and Supplemental Figure S1). The individual bile acid curves presented in the supplemental data confirm these changes (Supplemental Figure S2 and S3).
Hepatic bile acid synthesis pathway shifts with timing of food intake
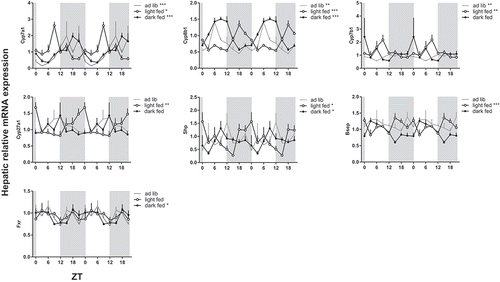
Parallel to introducing a rhythm in plasma bile acids, time-restricted feeding induced a significant rhythm in hepatic Fxr expression in the dark-fed rats and hepatic Shp expression in both the dark-fed and light-fed condition. Shp expression peaked at the end of the feeding period. Hepatic mRNA expression of the most important CYPs in bile acid synthesis showed a significant day/night rhythm in rats under chow ad lib-fed conditions ( and ). Cyp7a1 and Cyp7b1 peaked in the dark period, while Cyp8b1 peaked during the light. Gene expression rhythms in the dark-fed group roughly followed the same pattern as in the ad lib group, so time-restricted feeding to the dark period did not significantly shift the acrophase or affect the amplitude of the gene expression rhythms. However, time-restricted feeding during the light period phase-advanced the peak of Cyp7a1 and Cyp7b1 into the light period and the peak of Cyp8b1 shifted exactly 12 h to the dark phase (). The expression rhythms of Cyp27a1 (enzyme that initiates bile acid biosynthesis via the alternative or acidic route) and Bsep (bile salt export pump; transports the bile acids from the hepatocyte into the biliary tracts) were only significant in the light-fed condition. In short, hepatic Shp and Cyp gene expression rhythms shifted with the moment of food intake.
Figure 2. Effect of timing of food intake on hepatic mRNA expression of biosynthetic bile acid genes. Rats were fed a chow diet time-restricted during the dark period (dark fed, filled circles) or light period (light fed, open circles) or 24 h ad lib (grey line). Grey background indicates the dark period and the X-axis the ZT. Rats were killed and liver tissue was collected for qPCR every three hours during 24 h. Gene expression is given relative to the geometric mean of three reference genes. Asterisks indicate if the expression pattern showed a significant daily rhythm, * p < 0.05, **p < 0.01, ***p < 0.001. Cyp: cytochrome P450 family member; Shp: short heterodimer partner; Fxr: farnesoid X receptor; Bsep: bile salt export pump.
Effects of HF diets
Food composition does not affect plasma bile acid rhythms
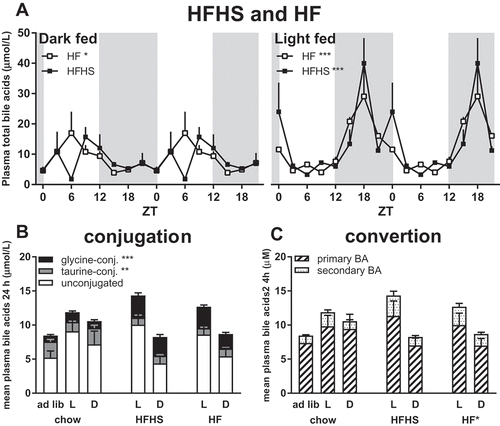
Similar to the chow diet, plasma bile acid concentrations showed a significant daily rhythm in the HFHS and HF time-restricted groups ( and ). HF-containing diets fed in the light period increased the amplitude of the plasma bile acid concentration rhythm compared to the dark-fed conditions. However, no significant differences in total plasma bile acid concentrations were found between chow, HFHS and HF diet groups in either the dark-fed or the light-fed condition, despite the absence of a significant daily rhythm in the HFHS dark-fed group. Thus, diet composition did not influence the diurnal rhythm of plasma bile acids.
Figure 3. Effects of food composition and food timing on daily plasma bile acid concentrations and pool composition. (A) Plasma bile acid levels show a significant daily rhythm during time-restricted HFHS (filled squares) or HF (open squares) diet during the light (L) or dark (D) phase, similar to time-restricted rats on a chow diet (). Asterisks indicate the p values for statistical significant rhythms as tested by JTK software. (B) A high-fat diet increased the amount of glycine-conjugated bile acids and decreased the amount of taurine-conjugated bile acids compared to rats fed a chow diet (for statistics see Supplemental Figure S4), whereas the total amount of plasma bile acid concentrations did not change. (C) The relative amount of secondary bile acids is increased with a high-fat diet, especially in the light-fed animals (for statistics see Supplemental Figure S5), whereas the absolute amount of primary and secondary bile acids (BA) does not change with diet. *p < 0.05, **p < 0.01, ***p < 0.001.
Fat in the diet changes the composition of the plasma bile acid pool
Rats on a fat-containing diet (i.e. both the HFHS and HF) showed significantly lower amounts of taurine-conjugated bile acids and higher amounts of glycine-conjugated bile acids in their plasma bile acid pool as compared to chow-fed rats ( and Supplemental Figure S4). In addition, a HF diet increased the amount of secondary bile acids in relation to primary bile acids, this change being most pronounced in the light-fed group ( and Supplemental Figure S5). In the chow-fed rats the amount of secondary bile acids was already higher in the light-fed condition, adding the fat component to the diet further reduced the secondary/primary bile acid ratio also in the dark-fed condition. Thus, the composition of the bile acid pool was changed by both timing of food intake and diet composition. However, total bile acid concentrations over 24 h did not differ between the different diet and timing groups (one-way ANOVA, n.s.). In short, feeding during the light phase changes the bile acid pool composition in a similar way as feeding a HF diet.
Light-restricted HF and HFHS feeding abolish hepatic Cyp7a1 mRNA expression rhythm, but phase-shift daily rhythms of Cyp8b1 and Shp expression
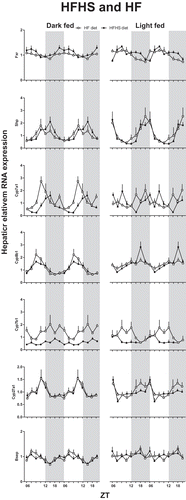
Cyp7b1, Cyp8b1 and Shp expression shifted with the timing of food intake () in all diet compositions, although differentially between the different diets. In the dark-fed condition the acrophase of Cyp7a1 phase advanced from ZT18 in the chow diet to ZT15 and ZT12 h in the HFHS and HF diet, respectively. In addition, the expression of Cyp27a1 and Cyp7b1 was significantly rhythmic in all HF-containing diets in contrast to chow ( and ). In the light-fed condition the Cyp7a1 rhythm disappeared in the HFHS and HF groups, in contrast to the chow condition. In addition, the Cyp8b1 rhythm was not significant in the HF group and Cyp7b1 and Cyp27a1 rhythms were not significant in the HFHS group. So, while HFHS or HF time-restricted feeding during the dark phase strengthened gene expression rhythms, in the light-fed groups most Cyp rhythms were abolished. Sugar in the diet (i.e. HFHS versus HF) tended to enhance the amplitude of the rhythm in FXR mRNA expression, whereas it decreased the amplitude and expression level of the daily rhythm in Cyp7b1 mRNA expression ().
Figure 4. Effects of food composition on hepatic mRNA expression of biosynthetic bile acid genes. Gene expression is given relative to the geometric mean of three reference genes. Grey background indicates the dark period. Time is indicated on the X-axis as ZT. Cyp: cytochrome P450 family member; Shp: short heterodimer partner; Fxr: farnesoid X receptor; Bsep: bile salt export pump.
Effects of equidistant feeding
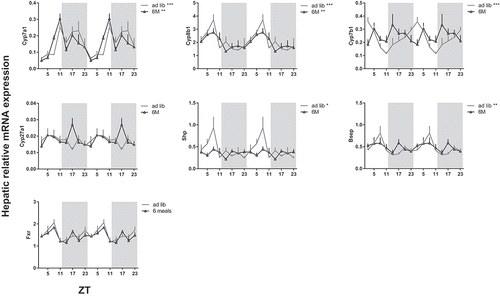
Hepatic clock gene expression rhythms shifted with food intake in experiment 1 analogous to bile acid synthesis genes ( and Supplemental Table S1). In the chow-fed rats, light-restricted feeding resulted in a 10–12 h phase-advance in clock gene expression compared to ad lib and dark-fed rats. In order to differentiate between the effects of feeding and clock gene rhythms, we eliminated the daily feeding-fasting rhythm by feeding rats an equidistant 6M chow diet (experiment 2). Hepatic clock gene expression did not shift in this feeding schedule compared to the 24 h ad lib control group ( and Supplemental Table S1), although the 6M schedule did decrease the amplitude of Dbp (albumin D-box binding protein) expression rhythm. In the ad lib group, hepatic expression of Shp, Cyp7a1, Cyp8b1, Cyp7b1 and Bsep showed significant daily rhythms. Rats on 6M showed a significant rhythm in Cyp7a1 and Cyp8b1 expression with a similar acrophase to the ad lib group ( and ) while daily rhythms in Cyp7b1, Shp and Bsep mRNA expression were abolished in 6M compared to ad lib. This suggests that the rhythmic expression of Cyp7a1 and Cyp8b1 is primarily driven by molecular day/night rhythm, while Cyp7b1, Shp and Bsep mRNA expression is driven by the day/night rhythm in food intake.
Table 3. Acrophase (ZT) and circadian rhythm in the hepatic expression of the bile acid biosynthetic pathway in experiment 2.
Figure 5. Effect of timing of food intake on daily hepatic mRNA expression of clock genes. Chow was available either 24 h ad lib (ad lib, grey line) or 10 h time-restricted during the dark phase (dark fed, filled circles) or light phase (light fed, open circles). Gene expression is given relative to the geometric mean of three reference genes. Grey background indicates the dark period and time is given as ZT. Asterisks indicate if expression rhythms show a significant daily rhythm as tested by JTK software (Supplemental Table S1), **p < 0.01, ***p < 0.001. Cry: cryptochrome; Dbp: albumin D-box binding protein; Rev-erbα: reverse viral erythroblastosis oncogene product α.
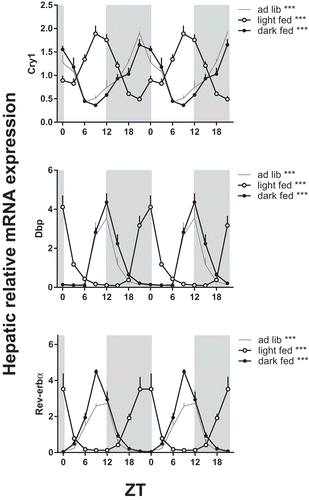
Figure 6. Effect of a 6 meals-a-day feeding schedule on daily hepatic mRNA expression of clock genes. Rats were fed a chow diet with food available every 4 h for 11–12 min (6M, open triangles) or 24 h ad lib (grey line) for 6 weeks. Gene expression is given relative to the geometric mean of three reference genes. Grey background indicates the dark period and time is given as ZT. Asterisks indicate if expression rhythm was significantly circadian as tested by JTK software (Supplemental Table S1), *p < 0.05, *** p < 0.001. Cry: cryptochrome; Dbp: albumin D-box binding protein; Rev-erbα: reverse viral erythroblastosis oncogene product α.
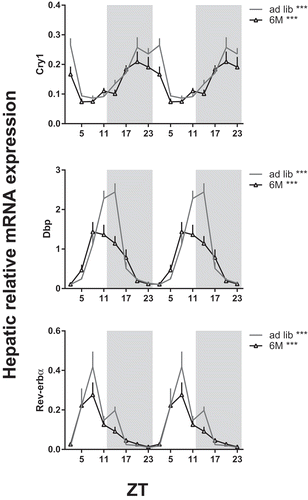
Figure 7. Effect of a 6 meals-a-day feeding schedule on daily hepatic mRNA expression of biosynthetic bile acid genes. Rats were fed a chow diet with food available every 4 h for 11–12 min (6M, open triangles) or 24 h ad lib (grey line). Gene expression is given relative to the geometric mean of three reference genes. Asterisks indicate if an expression rhythm showed a significant daily rhythm as tested by JTK software, *p < 0.05, **p < 0.01, ***p < 0.001. Grey background indicates the dark period and time is given as ZT. Cyp: cytochrome P450 family member; Shp: short heterodimer partner; Fxr: farnesoid X receptor; Bsep: bile salt export pump.
Discussion
In the current study we show that plasma bile acid levels and hepatic bile acid metabolic gene expression are affected by both diet composition and timing of food intake. Rats on a time-restricted feeding schedule, but not ad lib-fed rats, showed a significant day/night rhythm in plasma bile acid concentrations that followed food availability irrespective of diet composition. Interestingly, the composition of the plasma bile acid pool changed with both feeding during the light period and a HF-containing diet. Regulation of bile acid synthesis is a complex process, in which the transcription factor Shp plays a prominent role. Hepatic gene expression of Shp followed the rhythm of food intake, irrespective of diet composition. On the other hand, the daily rhythm of hepatic Cyp7a1 and Cyp8b1 mRNA expression followed the rhythm of the molecular clock and not food intake. However, Cyp7a1 and Cyp8b1 mRNA expression was influenced by diet composition as a HF-containing diet fed during the light phase diminished their daily rhythms. The fact that time-restricted feeding conditions, but not ad lib feeding condition, induce a significant rhythm in plasma bile acids indicates that periods of fasting are important to provoke significant changes in postprandial plasma bile acid concentrations in rats.
In the HF-containing diet groups, the amount of taurine-conjugated bile acids decreased and that of glycine-conjugated bile acids increased. These findings are in accordance with the findings of Suzuki and colleagues that a HF diet results in increased glycine-conjugated plasma bile acids in rats (Suzuki et al. Citation2013). The conjugation of bile acids to taurine or glycine is catalyzed by bile acid coenzyme A:amino acid N-acyltransferase (BAAT) located in the peroxisomes (Pellicoro et al. Citation2007). BAAT has a greater affinity for taurine than glycine so the ratio between the conjugates is determined by taurine availability and conjugation requirements (Lefebvre et al. Citation2009). How a HF diet leads to changes in the conjugation profile and intracellular availability of glycine and taurine to BAAT is not exactly clear. Deconjugation by gut microbiota may play an important role since germ-free mice have higher taurine conjugated bile acids (Swann et al. Citation2011). Besides the changes in conjugation, a HF diet also changed the bile acid conversions in the bile acid pool: the HF condition had a lower primary/secondary bile acid ratio. Probably gut microbiota also play a role in this transition of plasma bile acid pool composition. Gut microbiota deconjugate bile acids and convert primary bile acids into secondary forms. Microbiota have a strong day/night rhythm that affects circadian oscillations of plasma metabolites and the liver transcriptome and detoxification pattern (Thaiss et al. Citation2016). As such, microbiota might also indirectly affect bile acid composition besides intraluminal deconjugation and de hydroxylation. Similar to the HF-containing diets, in the present study, feeding during the light period also increased the amount of glycine-conjugated bile acids and secondary bile acids in plasma. Thus, our results show that eating at the inactive period causes changes in the bile acid pool composition that resemble HF diet-induced changes.
In parallel to the plasma bile acid levels, daily rhythms in hepatic gene expression of Cyp7a1, Cyp8b1, Cyp7b1 and Shp also shifted with the moment of food intake, similarly to mice (Ma et al. Citation2009). A HFHS or HF diet did not remove the rhythmicity of these genes when restricted to the dark period, although the acrophase of Cyp7a1 expression is phase advanced in the HF-containing diet conditions. Ferrell et al. reported similar results in mice: the Cyp7a1 acrophase shifted from ZT15 in chow-fed mice to ZT9 in mice fed a Western diet (HF, high cholesterol) (Ferrell and Chiang Citation2015). Chaix and colleagues did not find a shift in acrophase of Cyp7a1 expression in mice fed a HF diet; however, the rhythm was diminished in mice fed a HFHS diet (in both the ad lib and the dark-fed group) (Chaix and Zarrinpar Citation2015). In our study, the light-fed condition diminished Cyp7a1 rhythmicity both in the HFHS and HF diet condition and Cyp8b1 in the HF diet condition. Cyp7b1 expression showed a substantial difference between the HFHS and HF group with continuous higher expression in the HF group. The differences between the HFHS and HF group might indicate a role for sucrose, but more likely the difference is explained by the higher absolute amount of fat intake in the HF groups. In conclusion, the combination of eating during the inactive period and a HF diet abrogated the natural rhythm of the most important genes for bile acid synthesis in the liver.
Experiment 1 on timing of food intake and diet composition clearly showed that the daily expression rhythms of hepatic genes involved in bile acid synthesis shifted with the timing of food intake. With food timing the daily rhythms of hepatic clock gene expression also shifted () as reported earlier (Opperhuizen et al. Citation2016). In order to investigate whether the daily rhythms in hepatic bile acid gene expression are controlled directly by the molecular clock or by the feeding/fasting cycle, we eliminated the feeding/fasting cycle, while keeping hepatic clock gene rhythms intact, by submitting rats to an equidistant 6M chow feeding schedule (Su et al. Citation2016a). In the 6M feeding condition Cyp7a1 and Cyp8b1 mRNA expression maintained their daily rhythm with a similar acrophase as in the ad lib group, indicating that their expression is mostly driven by the molecular clock. A comparable 4-times-a-day feeding experiment with a high cholesterol diet in rats reported results in line with ours, showing that hepatic Cyp7a1 expression remained rhythmic with regular feeding, although the timing of the peak shifted (Yamajuku et al. Citation2009). Indeed, the core clock machinery can directly influence transcription of these genes, for example, RORα can influence the diurnal rhythm of Cyp8b1 expression (Pathak et al. Citation2013) and DBP and REV-ERB stimulate the transcription of Cyp7a1 (Duez et al. Citation2008; Lavery and Schibler Citation1993). In addition, CLOCK can directly stimulate Shp expression (Bavner et al. Citation2005; Kerr et al. Citation2002), by binding its E box (Oiwa et al. Citation2007; Pan et al. Citation2010). On the other hand, the daily rhythms of these genes might also be controlled by systemic factors that do not lose their daily rhythmicity in the 6M condition, such as corticosterone or melatonin (Su et al. Citation2016b). Interestingly, Shp lost its rhythm in the 6M condition suggesting that Shp mRNA expression is more strongly driven by food intake than by the hepatic molecular clock. This fits with the suggestion that SHP could signal nutrient availability back to the clock, thereby linking metabolism upstream to the clock (Wu et al. Citation2016). In further support of this concept, Shp expression did not only follow the daily rhythm in food intake when rats were on a chow diet, but also in both HF diet groups. Even in the light-fed conditions Shp expression remained rhythmic while most of the investigated genes lost their rhythm.
Bile acids regulate their own synthesis by the complex activation of intestinal and liver FXR ultimately repressing the expression of Cyp7a1 and Cyp8b1 (Del Castillo-Olivares and Gil Citation2001; Goodwin et al. Citation2000; Lu et al. Citation2000). More specifically, liver and intestinal FXR KO models have shown that Cyp7a1 repression depends mainly on intestinal FXR activation via FGF15. Intestinal FXR/FGF15 and hepatic FXR repress Cyp8b1 expression to the same extent (Kim et al. Citation2007; Kliewer and Mangelsdorf Citation2015; Kong et al. Citation2012). To complicate matters even more, FGF15 is negatively regulated by the transcription factor Kruppel-like factor 15 (KLF15) that also has a circadian rhythm (Han et al. Citation2015; Jeyaraj et al. Citation2012). In our study, we cannot exclude a potential role for FXR-FGF15 in the changes of bile acid biosynthesis enzymes that shifted with timing of food intake (Kliewer and Mangelsdorf Citation2015; Kong et al. Citation2012).
Remarkably and in contrast to humans and mice, rat plasma bile acid concentrations were lowest during the feeding period. In fact, feeding activity seemed to have an inhibitory effect as all bile acid concentrations showed a clear decrease 3 h after the onset of feeding activity, although in the restricted feeding groups the decrease already started before the onset of feeding activity. This might be the result of the absence of a gallbladder in rats, contrary to mice and men, although cholecystectomized patients still show a postprandial peak after food intake (Angelin et al. Citation1982; Schalm et al. Citation1978; Sonne et al. Citation2013). It is assumed that in animals without a gallbladder bile acids still cycle in the enterohepatic circulation and are stored in the small intestine (Hofmann and Hagey Citation2008). Our results question this assumption. Hepatic bile acid release measured by a chronic bile fistula in ad lib-fed rats showed a daily rhythm for various types of bile acids with a peak in the dark phase (Duane et al. Citation1979; Gilberstadt et al. Citation1991). Bile acid synthesis in humans also showed a daily rhythm with highest levels during the active (light) period (Duane et al. Citation1983; Galman et al. Citation2005). If bile output is highest during the active/feeding phase and bile acids are stored in the intestines, transit time is a major determinant of postprandial plasma bile acid levels and deserves more attention in the field of bile acid research. In addition, in future studies the difference in bile acid metabolism should be taken into account when choosing a cell or animal model.
In conclusion, daily rhythms in bile acid homeostasis are regulated by both the molecular clock and the daily rhythm in food intake. While food intake directs daily rhythms in plasma bile acids and hepatic gene expression of Shp, the hepatic clock directs daily rhythms in gene expression of the two bile acid pool-defining enzymes Cyp7a1 and Cyp8b1. This raises questions about which pathway is leading in bile acid biosynthesis and subsequent bile acid signaling in the enterohepatic and systemic circulation, but it clearly indicates that eating during the inactive period will affect bile acid metabolism. Besides rhythmicity of bile acids, the daily timing of food intake also affected the composition of the bile acid pool, with eating during the inactive period resulting in similar changes in plasma bile acid pool composition as a HF-containing diet. A HF-containing diet combined with feeding during the light period even completely abrogates hepatic Cyp7a1 and Cyp8b1 rhythms in rats, suggesting that the combination of a HF diet and eating during the inactive period has the most disruptive effect on bile acid homeostasis.
The majority of the rat bile acid pool consists of unconjugated bile acids and specifically unconjugated bile acids can affect hepatic clock gene expression (Govindarajan et al. Citation2016). Thus (feeding-induced) changes in bile acid pool composition may also affect the molecular clock. Therefore, although it has been argued that bile acids may mediate the positive effects of time-restricted feeding on body weight during HF diet (Chaix and Zarrinpar Citation2015), the reverse may also be true, i.e. bile acids may mediate the adverse effects of eating at the wrong time (inactive period) of day.
Declaration of interest
The authors report no conflicts of interest. The authors alone are responsible for the content and writing of this article.
ICBI_1363226_Supplementary_Material.pdf
Download PDF (530.1 KB)Acknowledgment
We thank Satish Sen (Hypothalamic Integration Mechanisms, Netherlands Institute for Neuroscience, Amsterdam, the Netherlands), Laura L. Koekkoek and Olga Boudzovitch-Surovtseva (both Laboratory of Endocrinology, Dept. Clinical Chemistry, Academic Medical Centre, University of Amsterdam, Amsterdam, The Netherlands) for their help with the animal experiments and tissue analyses.
Funding
JEO received an AMC PhD Scholarship. PdG was supported by a grant from the Dutch organization for health research and development, ZonMw (TOPgrant 036.003.1147). MRS is funded by the Dutch Diabetes Research Foundation (grant 2011.80.1423). The authors report no conflicts of interest.
Supplemental data
Supplemental data for this article can be access on the publisher’s website.
Additional information
Funding
References
- Angelin B, Bjorkhem I. 1977. Postprandial serum bile acids in healthy man. Evidence for differences in absorptive pattern between individual bile acids. Gut. 18:606–09. doi:10.1136/gut.18.8.606.
- Angelin B, Bjorkhem I, Einarsson K, Ewerth S. 1982. Hepatic uptake of bile acids in man. Fasting and postprandial concentrations of individual bile acids in portal venous and systemic blood serum. J Clin Invest. 70:724–31. doi:10.1172/JCI110668.
- Bass J, Takahashi JS. 2010. Circadian integration of metabolism and energetics. Science. 330:1349–54. doi:10.1126/science.1195027.
- Bavner A, Sanyal S, Gustafsson JA, Treuter E. 2005. Transcriptional corepression by SHP: molecular mechanisms and physiological consequences. Trends Endocrinol Metab. 16:478–88. doi:10.1016/j.tem.2005.10.005.
- Bustin SA, Benes V, Garson JA, Hellemans J, Huggett J, Kubista M, Mueller R, Nolan T, Pfaffl MW, Shipley GL, et al. 2009. The MIQE guidelines: Minimum information for publication of quantitative real-time PCR experiments. Clin Chem. 55:611–22. doi:10.1373/clinchem.2008.112797.
- Chaix A, Zarrinpar A. 2015. The effects of time-restricted feeding on lipid metabolism and adiposity. Adipocyte. 4:319–24. doi:10.1080/21623945.2015.1025184.
- del Castillo-Olivares A, Gil G. 2001. Suppression of sterol 12alpha-hydroxylase transcription by the short heterodimer partner: Insights into the repression mechanism. Nucleic Acids Res. 29:4035–42. doi:10.1093/nar/29.19.4035.
- Duane WC, Gilberstadt ML, Wiegand DM. 1979. Diurnal rhythms of bile acid production in the rat. Am J Physiol. 236:R175–179.
- Duane WC, Levitt DG, Mueller SM, Behrens JC. 1983. Regulation of bile acid synthesis in man. Presence Diurnal Rhythm J Clin Invest. 72:1930–36. doi:10.1172/JCI111157.
- Duez H, Van Der Veen JN, Duhem C, Pourcet B, Touvier T, Fontaine C, Derudas B, Bauge E, Havinga R, Bloks VW, et al. 2008. Regulation of bile acid synthesis by the nuclear receptor Rev-erbalpha. Gastroenterology. 135:689–98. doi:10.1053/j.gastro.2008.05.035.
- Ferrell JM, Chiang JY. 2015. Short-term circadian disruption impairs bile acid and lipid homeostasis in mice. Cell Mol Gastroenterol Hepatol. 1:664–77. doi:10.1016/j.jcmgh.2015.08.003.
- Galman C, Angelin B, Rudling M. 2005. Bile acid synthesis in humans has a rapid diurnal variation that is asynchronous with cholesterol synthesis. Gastroenterology. 129:1445–53. doi:10.1053/j.gastro.2005.09.009.
- Gilberstadt ML, Bellinger LL, Lindblad S, Duane WC. 1991. Liver denervation does not alter the circadian rhythm of bile acid synthesis in rats. Am J Physiol. 261:G799–802.
- Goodwin B, Jones SA, Price RR, Watson MA, McKee DD, Moore LB, Galardi C, Wilson JG, Lewis MC, Roth ME, et al. 2000. A regulatory cascade of the nuclear receptors FXR, SHP-1, and LRH-1 represses bile acid biosynthesis. Mol Cell. 6:517–26. doi:10.1016/S1097-2765(00)00051-4.
- Govindarajan K, MacSharry J, Casey PG, Shanahan F, Joyce SA, Gahan CG. 2016. Unconjugated bile acids influence expression of circadian genes: a potential mechanism for microbe-host crosstalk. PLoS One. 11:e0167319. doi:10.1371/journal.pone.0167319.
- Han S, Zhang R, Jain R, Shi H, Zhang L, Zhou G, Sangwung P, Tugal D, Atkins GB, Prosdocimo DA, et al. 2015. Circadian control of bile acid synthesis by a KLF15-Fgf15 axis. Nat Commun. 6:7231. doi:10.1038/ncomms8231.
- Hofmann AF, Hagey LR. 2008. Bile acids: chemistry, pathochemistry, biology, pathobiology, and therapeutics. Cell Mol Life Sci. 65:2461–83. doi:10.1007/s00018-008-7568-6.
- Hughes ME, Hogenesch JB, Kornacker K. 2010. JTK_CYCLE: an efficient nonparametric algorithm for detecting rhythmic components in genome-scale data sets. J Biol Rhythms. 25:372–80. doi:10.1177/0748730410379711.
- Jeyaraj D, Scheer FA, Ripperger JA, Haldar SM, Lu Y, Prosdocimo DA, Eapen SJ, Eapen BL, Cui Y, Mahabeleshwar GH, et al. 2012. Klf15 orchestrates circadian nitrogen homeostasis. Cell Metab. 15:311–23. doi:10.1016/j.cmet.2012.01.020.
- Kalsbeek A, Strubbe JH. 1998. Circadian control of insulin secretion is independent of the temporal distribution of feeding. Physiol Behav. 63:553–58. doi:10.1016/S0031-9384(97)00493-9.
- Kerr TA, Saeki S, Schneider M, Schaefer K, Berdy S, Redder T, Shan B, Russell DW, Schwarz M. 2002. Loss of nuclear receptor SHP impairs but does not eliminate negative feedback regulation of bile acid synthesis. Dev Cell. 2:713–20. doi:10.1016/S1534-5807(02)00154-5.
- Kim DH, Rhee JC, Yeo S, Shen R, Lee SK, Lee JW, Lee S. 2015. Crucial roles of mixed-lineage leukemia 3 and 4 as epigenetic switches of the hepatic circadian clock controlling bile acid homeostasis in mice. Hepatology. 61:1012–23. doi:10.1002/hep.27578.
- Kim I, Ahn SH, Inagaki T, Choi M, Ito S, Guo GL, Kliewer SA, Gonzalez FJ. 2007. Differential regulation of bile acid homeostasis by the farnesoid X receptor in liver and intestine. J Lipid Res. 48:2664–72. doi:10.1194/jlr.M700330-JLR200.
- Kliewer SA, Mangelsdorf DJ. 2015. Bile acids as hormones: the FXR-FGF15/19 pathway. Dig Dis. 33:327–31. doi:10.1159/000371670.
- Ko CH, Takahashi JS. 2006. Molecular components of the mammalian circadian clock. Hum Mol Genet. 15 Spec No 2:R271–277. doi:10.1093/hmg/ddl207.
- Kong B, Wang L, Chiang JY, Zhang Y, Klaassen CD, Guo GL. 2012. Mechanism of tissue-specific farnesoid X receptor in suppressing the expression of genes in bile-acid synthesis in mice. Hepatology. 56:1034–43. doi:10.1002/hep.25740.
- Kuipers F, Bloks VW, Groen AK. 2014. Beyond intestinal soap—bile acids in metabolic control. Nat Rev Endocrinol. 10:488–98. doi:10.1038/nrendo.2014.60.
- la Fleur SE, Van Rozen AJ, Luijendijk MC, Groeneweg F, Adan RA. 2010. A free-choice high-fat high-sugar diet induces changes in arcuate neuropeptide expression that support hyperphagia. Int J Obes (Lond). 34:537–46. doi:10.1038/ijo.2009.257.
- la Fleur SE, Vanderschuren LJ, Luijendijk MC, Kloeze BM, Tiesjema B, Adan RA. 2007. A reciprocal interaction between food-motivated behavior and diet-induced obesity. Int J Obes (Lond). 31:1286–94. doi:10.1038/sj.ijo.0803570.
- LaRusso NF, Hoffman NE, Korman MG, Hofmann AF, Cowen AE. 1978. Determinants of fasting and postprandial serum bile acid levels in healthy man. Am J Dig Dis. 23:385–91. doi:10.1007/BF01072919.
- Lavery DJ, Schibler U. 1993. Circadian transcription of the cholesterol 7 alpha hydroxylase gene may involve the liver-enriched bZIP protein DBP. Genes Dev. 7:1871–84. doi:10.1101/gad.7.10.1871.
- Lefebvre P, Cariou B, Lien F, Kuipers F, Staels B. 2009. Role of bile acids and bile acid receptors in metabolic regulation. Physiol Rev. 89:147–91. doi:10.1152/physrev.00010.2008.
- Li T, Francl JM, Boehme S, Ochoa A, Zhang Y, Klaassen CD, Erickson SK, Chiang JY. 2012. Glucose and insulin induction of bile acid synthesis: Mechanisms and implication in diabetes and obesity. J Biol Chem. 287:1861–73. doi:10.1074/jbc.M111.305789.
- Lu TT, Makishima M, Repa JJ, Schoonjans K, Kerr TA, Auwerx J, Mangelsdorf DJ. 2000. Molecular basis for feedback regulation of bile acid synthesis by nuclear receptors. Mol Cell. 6:507–15. doi:10.1016/S1097-2765(00)00050-2.
- Ma K, Xiao R, Tseng HT, Shan L, Fu L, Moore DD. 2009. Circadian dysregulation disrupts bile acid homeostasis. PLoS One. 4:e6843. doi:10.1371/journal.pone.0006843.
- Oiwa A, Kakizawa T, Miyamoto T, Yamashita K, Jiang W, Takeda T, Suzuki S, Hashizume K. 2007. Synergistic regulation of the mouse orphan nuclear receptor SHP gene promoter by CLOCK-BMAL1 and LRH-1. Biochem Biophys Res Commun. 353:895–901. doi:10.1016/j.bbrc.2006.12.131.
- Opperhuizen AL, Wang D, Foppen E, Jansen R, Boudzovitch-Surovtseva O, De Vries J, Fliers E, Kalsbeek A. 2016. Feeding during the resting phase causes profound changes in physiology and desynchronization between liver and muscle rhythms of rats. Eur J Neurosci. 44:2795–806. doi:10.1111/ejn.13377.
- Pan X, Zhang Y, Wang L, Hussain MM. 2010. Diurnal regulation of MTP and plasma triglyceride by CLOCK is mediated by SHP. Cell Metab. 12:174–86. doi:10.1016/j.cmet.2010.05.014.
- Pathak P, Li T, Chiang JY. 2013. Retinoic acid-related orphan receptor alpha regulates diurnal rhythm and fasting induction of sterol 12alpha-hydroxylase in bile acid synthesis. J Biol Chem. 288:37154–65. doi:10.1074/jbc.M113.485987.
- Pellicoro A, Van Den Heuvel FA, Geuken M, Moshage H, Jansen PL, Faber KN. 2007. Human and rat bile acid-CoA: Aminoacid N-acyltransferase are liver-specific peroxisomal enzymes: implications for intracellular bile salt transport. Hepatology. 45:340–48. doi:10.1002/hep.21528.
- Schalm SW, LaRusso NF, Hofmann AF, Hoffman NE, Van Berge-Henegouwen GP, Korman MG. 1978. Diurnal serum levels of primary conjugated bile acids. Assessment by specific radioimmunoassays for conjugates of cholic and chenodeoxycholic acid. Gut. 19:1006–14. doi:10.1136/gut.19.11.1006.
- Setchell KD, Lawson AM, Blackstock EJ, Murphy GM. 1982. Diurnal changes in serum unconjugated bile acids in normal man. Gut. 23:637–42. doi:10.1136/gut.23.8.637.
- Sonne DP, Hare KJ, Martens P, Rehfeld JF, Holst JJ, Vilsboll T, Knop FK. 2013. Postprandial gut hormone responses and glucose metabolism in cholecystectomized patients. Am J Physiol Gastrointest Liver Physiol. 304:G413–419. doi:10.1152/ajpgi.00435.2012.
- Sonne DP, van Nierop FS, Kulik W, Soeters MR, Vilsboll T, Knop FK. 2016. Postprandial plasma concentrations of individual bile acids and FGF-19 in patients with type 2 diabetes. J Clin Endocrinol Metab. 101:3002–09. doi:10.1210/jc.2016-1607.
- Su Y, Cailotto C, Foppen E, Jansen R, Zhang Z, Buijs R, Fliers E, Kalsbeek A. 2016a. The role of feeding rhythm, adrenal hormones and neuronal inputs in synchronizing daily clock gene rhythms in the liver. Mol Cell Endocrinol. 422:125–31. doi:10.1016/j.mce.2015.12.011.
- Su Y, Foppen E, Zhang Z, Fliers E, Kalsbeek A. 2016b. Effects of 6-meals-a-day feeding and 6-meals-a-day feeding combined with adrenalectomy on daily gene expression rhythms in rat epididymal white adipose tissue. Genes Cells. 21:6–24. doi:10.1111/gtc.12315.
- Suzuki Y, Kaneko R, Nomura M, Naito H, Kitamori K, Nakajima T, Ogawa T, Hattori H, Seno H, Ishii A. 2013. Simple and rapid quantitation of 21 bile acids in rat serum and liver by UPLC-MS-MS: effect of high fat diet on glycine conjugates of rat bile acids. Nagoya J Med Sci. 75:57–71.
- Swann JR, Want EJ, Geier FM, Spagou K, Wilson ID, Sidaway JE, Nicholson JK, Holmes E. 2011. Systemic gut microbial modulation of bile acid metabolism in host tissue compartments. Proc Natl Acad Sci U S A. 108(Suppl 1):4523–30. doi:10.1073/pnas.1006734107.
- Thaiss CA, Levy M, Korem T, Dohnalova L, Shapiro H, Jaitin DA, David E, Winter DR, Gury-BenAri M, Tatirovsky E, et al. 2016. Microbiota diurnal rhythmicity programs host transcriptome oscillations. Cell. 167:1495–1510 e1412. doi:10.1016/j.cell.2016.11.003.
- Wu N, Kim KH, Zhou Y, Lee JM, Kettner NM, Mamrosh JL, Choi S, Fu L, Moore DD. 2016. Small heterodimer partner (NR0B2) coordinates nutrient signaling and the circadian clock in mice. Mol Endocrinol. 30:988–95. doi:10.1210/me.2015-1295.
- Yamajuku D, Okubo S, Haruma T, Inagaki T, Okuda Y, Kojima T, Noutomi K, Hashimoto S, Oda H. 2009. Regular feeding plays an important role in cholesterol homeostasis through the liver circadian clock. Circ Res. 105:545–U575.
- Zhang YK, Guo GL, Klaassen CD. 2011. Diurnal variations of mouse plasma and hepatic bile acid concentrations as well as expression of biosynthetic enzymes and transporters. PLoS One. 6:e16683. doi:10.1371/journal.pone.0016683.