
 ?Mathematical formulae have been encoded as MathML and are displayed in this HTML version using MathJax in order to improve their display. Uncheck the box to turn MathJax off. This feature requires Javascript. Click on a formula to zoom.
ABSTRACT
Probing the electrical response of the human body is minimally invasive and a promising area of investigation for future health care. The electrical responses of individuals may vary depending on daily physiological rhythms or environmental changes, which may hamper their prediction for pathological status. In this study, we observed circadian expressions via both alternating current (AC) and direct current (DC) electrical responses of the human body using bioelectrical impedance analysis (BIA) and electrodermal activity (EDA). In total, 14 healthy adults (9 males and 5 females) participated and were hospitalized for 2 nights with controlled caloric intake, sleep hours and residential conditions. The EDA data showed a significant circadian rhythm, but the BIA data did not show significant modulations during the measurement period. No difference was found between circadian changes in male and female participants. The acrophase of the EDA voltage response showed similar behavior with variations in the heart rate variability, with a resistance minimum occurring at approximately 4 pm, implying that the behavior of the EDA is probably affected by the sympathetic nerve response. Moreover, the resistance of the EDA varied by up to 15% from its mean value, which suggests that circadian variations cannot be neglected for the correct diagnosis of pathological conditions. In contrast, the BIA method did not show this circadian variation but showed independent results over the measurement period. This difference in performance implies that the DC and AC responses of the human body contain different electrophysiological information.
Introduction
There is growing interest in the electrical response of the human body for diagnosis and treatments. In particular, probing the electrical response of the human body is minimally invasive, which makes it important for future applications in medical fields such as home health care, mobile health care and self-care. Probing the electrical response of the human body, such as electrodermal activity (EDA) and bioelectrical impedance analysis (BIA), involves exogenous methods, which refers to externally applied electricity. EDA involves the electrical characteristics of the skin. EDA is also known as the galvanic skin response, electrodermal response, skin conductance, etc. To accurately measure the electrical response of the human body, the circadian rhythms of the electrical responses of the human body must be studied.
EDA is characterized by the superposition of what appear to be single distinct skin conductance responses (Benedek and Kaernbach Citation2010). Various studies have been conducted using EDA. Asahina et al. (Citation2003) tested the emotional sweating response in a patient with bilateral amygdala damage and found that the amygdala plays an important role in emotional sweating. Herpertz et al. (Citation2001) showed that boys with a comorbid condition of attention deficit/hyperactivity disorder (ADHD) and conduct disorder showed a decrease in autonomic responses compared with age-matched children with ADHD alone. Hot et al. (Citation1999) tested the diurnal variations of EDA and found that the skin conductance level (SCL) increased linearly throughout the day. EDA is a method of measuring the electrical conductance of the skin related to the sweat gland responses (Martini et al. Citation2013). Recently, EDA has been researched as a screening tool for diabetes mellitus. Sheng et al. (Citation2011) tested an EZSCAN device using EDA methods and showed that the sensitivity and specificity for the diagnosis of diabetes mellitus were 85% and 64%, respectively. Chen et al. (Citation2015) tested the same device and showed that the sensitivity and specificity for the diagnosis of impaired glucose tolerance were 82% and 62%, and for diabetes mellitus, 53% and 59%, respectively. The sweat glands are controlled by the post sympathetic cholinergic system (Maarek Citation2012). Therefore, the EDA method can be considered to be related to the sympathetic nervous system.
Similarly, BIA is a method of measuring the bioelectrical impedance by applying a low current to the human body (Hoffer et al. Citation1969). It is based on the electrical properties of biological tissues and is generally used to assess body composition (BC) using an alternating current (AC) (Miyatani et al. Citation2000; Bae, Kim et al., Citation2016). Janssen et al. (Citation2000) attempted to predict skeletal muscle mass using the BIA method and developed a highly accurate regression model based on MRI measurements. Shoji et al. (Citation2008) measured visceral fat using the BIA method and found that visceral fat was a major risk factor for metabolic syndrome.
The EDA and BIA methods have several disadvantages that make them difficult to use as diagnosis techniques. They are influenced by the measurement distance due to the characteristics of measuring the electrical impedance, by demographic characteristics such as age and sex, and by environmental factors such as temperature and humidity (Kushner Citation1992). They are also affected by the electrode impedance since it can be much higher than the impedance of skin (Brown et al. Citation2000). Studies are underway to compensate for or eliminate these negative influences. The EZSCAN using the EDA method utilizes demographic information as a parameter to calculate the diabetes risk index (Eh Schwarz et al. Citation2011). Body composition analysis using the BIA method has also been calculated using demographic information (Jaffrin and Morel Citation2008). Tetrapolar electrode systems have been used to eliminate the electrode impedance effect in the BIA method (Grimnes and Martinsen Citation2007).
Chronobiological changes in the EDA and BIA methods should also be studied to improve the precision of these diagnosis techniques. The circadian rhythm is the most representative biological rhythm. The circadian timing system has been discovered to be located in the suprachiasmatic nucleus (SCN) of the hypothalamus (Stratmann and Schibler Citation2006), and factors affecting circadian rhythms have been identified. The SCN is affected by exogenous environmental 24-h cycles, such as light, sound, posture, physical activity, and mental and emotional stress. (Smolensky et al. Citation2016). The circadian rhythm of blood pressure is affected by endogenous mechanisms such as wake/sleep rhythm, the blood volume circadian rhythm, the melatonin circadian rhythm, autonomic nervous system tone and the renin–angiotensin–aldosterone system circadian rhythmicity. One of the most actively studied topics in this field is the circadian variation in the heart rate variability (HRV). Muller et al. (Citation1989) showed that blood pressure and heart rate rapidly increase in the morning. Boudreau et al. (Citation2013) reported that the heart rate is modulated by the autonomic nervous system (ANS). The circadian rhythms of these biomarkers could affect the direct current (DC) and AC impedance.
Several studies have reported the circadian rhythms in the BIA method. Medrano et al. (Citation2009) showed that circadian changes in body fluids were larger than changes in body weight. Cugini et al. (Citation1996) reported that all the variables of BC showed a within-day variability with nighttime crests. However, few papers with low numbers of subjects have been published, and more evidence is required to confirm the results.
Research on circadian expressions using the EDA and BIA methods has not been active. To the best of the authors’ knowledge, no studies on circadian expressions using the EDA method exist at present. The circadian expressions using the BIA method have been reported and should be measured simultaneously with EDA methods to compare the DC and AC responses of the human body. Moreover, no studies have observed circadian rhythms using the EDA and BIA methods for the same subject groups. In this study, we observed circadian expressions in the same subjects using the EDA and BIA methods.
Subjects and methods
Subjects
In total, 14 healthy adults participated between September and December 2015 to analyze their bioelectrical signals and circadian expressions (). The participants ranged from 20 to 70 years of age with eight of them in the range of 20–49 years (five men, three women) and six of them in the range of 50–69 years (four men, two women). Participants who have or had a history of thyroid dysfunction or other endocrine dysfunction, those who have or had a history of heart diseases and those who had a history of malignant tumor or associated complications were excluded from the study to eliminate the risk of bias. The study was approved by the Institutional Review Board of the Gil Hospital, Gacheon Medical University, Incheon, Republic of Korea (authorization number: GDIRB2015-229) and was registered with the Clinical Research Information Service at the Korea National Institute of Health (NIH), Republic of Korea (KCT0001679; date of registration: September 30, 2023, 2016), which is a registry in the WHO Registry Network. The participants’ BMI range was 18–31 kg/m2. Eleven participants had a BMI in the normal range (18.5–25 kg/m2), two were in the overweight range (25–30 kg/m2) and one was in the stage 1 obesity range (30–35 kg/m2). At the time of the clinical trial, none of the participants were smokers; however, all of the participants ingested caffeine regularly. All 14 participants had normal blood pressure levels (systolic pressure <140 mmHg, diastolic blood pressure >60 mmHg).
Table 1. Subject information.
Measurements
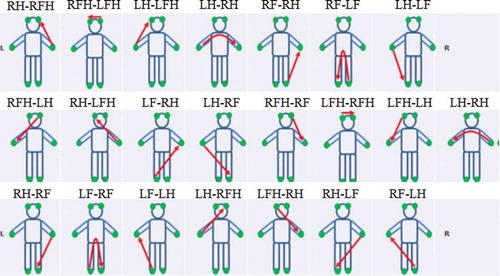
To measure the EDA-based DC voltage change, the voltage was measured at 200 Hz through a 6-channel DAQ (Data acquisition, NI USB-6009, USA) using the left forehead electrode as the reference electrode on a DDFAO (MEDI.LD, France) (Bae, Kim et al., Citation2016). A DC of 1.28 V (below any rheobase) is applied across six electrodes placed symmetrically on the forehead, hands and feet (Medical_Centre_for_the_Prevention_of_Diseases Citation0000). Each electrode is alternately cathode then anode so that 22 volumes of the human body can be registered (). The subjects removed all metal objects (wristwatch, bracelets, rings, etc.) that could affect the measurements and were barefoot. Their feet and hands were cleaned with electrolyte tissue, and two Ag/AgCl electrodes were attached to the forehead.
Figure 1. Twenty-two sequential measurement pathways. RFH: right forehead, LFH: left forehead, RH: right hand, RF: right foot, LH: left hand and LF: left foot. For example, RH-RF means: pathway from the right hand to the right foot.
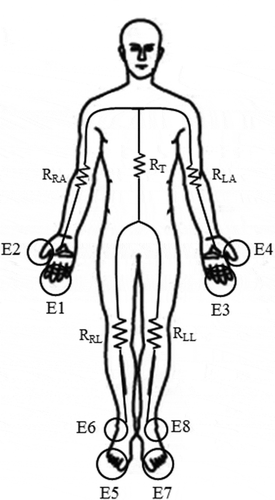
The InBody S10 system (Biospace, Korea) was used to measure the BIA-based AC impedance change. The resistance, reactance and phase angle were measured at 5 k, 50 k, and 250 kHz, and all parameters were analyzed using the left/right arms, left/right legs and trunk (Malavolti et al. Citation2003; Kim and Kim Citation2013) ().
Figure 2. Measurement pathways of BIA method. The sequence of measurements proceeds as follows. For the right arm resistance (RRA), AC was applied between E1 and E5 and recorded voltage between E2 and E4. The recorded voltage between E4 and E8 was used to obtain the trunk resistance (RT) and recorded voltage between E6 and E8 was used to obtain the right leg resistance (RRL). The AC was applied between E3 and E7 and recorded voltage between E2 and E4 was used to obtain the left arm resistance (RLA). Lastly, recorded voltage between E6 and E8 was used to obtain the left leg resistance (RLL) (Malavolti et al. Citation2003).
Experimental protocol
The participants were strictly controlled during the experiment. The patients visited the hospital on the day of their appointment and went through the admissions paperwork after 16:00. The participants stayed at the hospital for 2 nights and 3 days and visited the laboratory for the experiment during their stay. At 18:00, the participants ate their rations of food and water and then filled out a questionnaire. At approximately 21:00, they were measured using EDA and BIA devices, and they slept for 8 h starting at 23:00. Measurements were taken in 3-h intervals from 07:00 to 21:00 on the second day, and the final measurement was taken at 07:00 on the final morning for a total of eight measurements.
Data analysis
Since DDFAO applies DC voltage to 22 pathways in the human body, a representative voltage value must be selected for each pathway. The representative values for each pathway were extracted from Height1 according to previous study (Bae, Kim et al., Citation2016). Height1 was defined as the value of the first detected point within 5% of the voltage magnitude average from 0.5 to 3.5 s after the starting point of the peak.
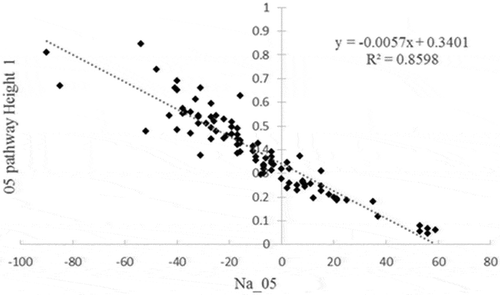
Out of a total of 112 measurements, the voltage measurement was missing 20 times. To compensate for these missing data, a heuristic imputation technique was used based on a linear regression equation between the “Na” value, which is a normalized value of conductivity measure provided by the manufacturer (Medical_Centre_for_the_Prevention_of_Diseases Citation0000), and the measured voltage value (r2 = 0.72 (0.50–0.86)) (). The pathways with head electrodes were excluded due to a poor correlation.
Figure 3. Sample linear representations of the “Na” value versus Height1.
Chronobiometric analysis
The circadian rhythm was validated and quantified using the single cosinor method (Refinetti et al. Citation2007), which is a procedure of periodic regression analysis for fitting a 24-h cosine curve to raw data. The single cosinor procedure uses the formula
where xi is the value of each point corresponding to the sampling time ti (at which the data points xi were collected), M (MESOR, midline estimating statistic of rhythm) is the rhythm-adjusted mean, A is the amplitude of the oscillation, is the angular frequency, φ (acrophase) is the phase of the maximum in relation to a fixed reference time and ei is an error term assumed to be independent and normally distributed with a mean of zero and fixed unknown variance. In this study, the angular frequency was one cycle per day because
was equal to 24 h.
Results
Cosinor analysis of the EDA data
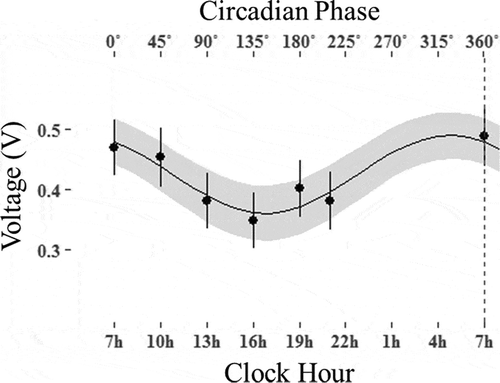
Details on the circadian variation in the EDA data are presented in and pictorially in . In , the mean and standard deviation (SD) of MESOR, 95% confidence interval (95% CI) of amplitude and acrophase of the EDA data of 12 electric pathways between electrodes at hands and feet were shown; it showed a significant circadian rhythm except for the RF-RH, LH-RH and LF-RH pathways. The minimum in the EDA data occurred from 15:00 to 17:00. The circadian crests of all the variables were synchronous ().
Table 2. Chronobiometric parameters for the EDA data (voltage).
Figure 4. The cosinorgram of the RH-LF EIS data. The vertical dotted lines indicate the folding at 360°. The circadian rhythm and standard error bands were estimated from the single cosinor procedure. The circles and lines indicate the least squared mean and standard error at each circadian hour.
Cosinor analysis of the BIA data
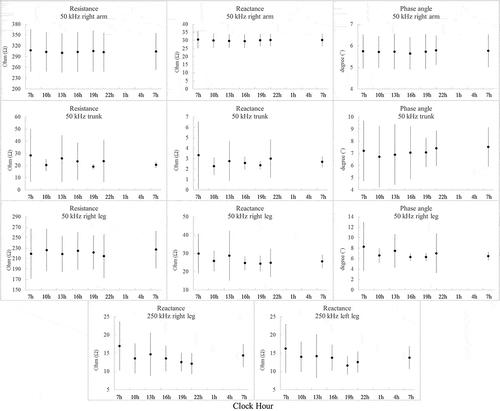
The daily variations of the BIA data are presented in and pictorially in . In , the mean and SD of MESOR, 95% CI of amplitude and acrophase of resistance, reactance and phase angle were shown for the frequencies of 5, 50 and 250 kHz; generally, the BIA data did not show significant variations during the day except in the 250 kHz reactance values of the left/right legs. Since the impedance at 50 kHz has been widely used for the single-frequency BIA (Sun et al. Citation2003), for the illustrative purpose, we pictorially presented the detailed daily variations of the impedance (resistance, reactance and phase angle) at 50 kHz and additionally the reactance of the right/left legs at 250 kHz in ; the impedance data at 50 kHz did not show any circadian pattern, and the reactance values at 250 kHz failed to show a circadian behavior similar to the rhythm of the EDA.
Table 3. Chronobiometric parameters for the BIA data.
Figure 5. Sample BIA data (resistance, reactance and phase angle for the right arm, trunk and right leg at 50 kHz and leg reactance at 250 kHz). Each dot and line represent the mean and standard deviation, respectively.
Discussion
In this study, the EDA data showed a significant circadian rhythm, with its resistance reaching a minimum between 15:00 and 17:00. In a prior study of circadian rhythm, HRV showed a significant circadian variation that related to the sympathetic modulation of the heart (Boudreau et al. Citation2012). The acrophase of the HRV and core body temperature was similar to the EDA data. According to the previous study, subjects that underwent a sympathectomy did not show circadian changes via EDA (Boucsein Citation2012). EDA is a method for measuring the EDA that uses six electrodes on the feet, hands and foreheads. Therefore, the circadian change in the EDA may be related to the sympathetic modulation.
Cugini et al. (Citation1996) and Medrano et al. (Citation2009) reported that the probing the BC using the BIA method showed a significant circadian rhythm. Slinde and Lena (Citation2001) showed a decrease in the measured impedance and an increase in the measured extracellular fluid during a normal work day (mostly sitting and standing position). Their measurements during the day on 12 subjects in the lying position showed a continuous increase in the impedance (Slinde Citation2003). However, Dittmar et al. reported that some BIA variables (resistance at 5 and 50 kHz, reactance at 50 and 100 kHz, and phase angle at 100 kHz) showed significant diurnal variation, whereas the others (resistance at 100 kHz, reactance at 5 kHz and phase angle at 5 and 50 kHz) did not show significant diurnal variations. In addition, the difference between each measurement was very small at less than 5%. In this study, the impedance data acquired using the BIA methods did not show a significant circadian rhythm except for the leg reactance at 250 kHz. Since the calculation formula for the BC includes the body weight as an important factor, the circadian changes in the BC in the previous studies may have a compounding effect on the change in body weight. In contrast, the raw impedance data, such as the resistance, reactance and phase angle, do not have such a compounding effect. Therefore, the lack of circadian changes in the raw BIA data in this study imply that the BIA data are not directly related to sympathetic modulation.
The difference between the EDA and BIA methods is that the DC response of the EDA method is more affected by the skin contact resistance, temperature, humidity and function of the sweat glands than the AC response of the BIA method. DC flow polarizes the electrodes, electrolyzes the skin, disturbs the measurement of conductance by varying the counter-emf in the circuit and impedes the registration of the skin endosomatic DC potential (Grimnes Citation2014). The functioning of the sweat glands, which is one of the major skin functions, was measured via the EDA method using reverse iontophoresis (Sheng et al. Citation2011). This function has also been studied as a diagnostic and monitoring method for diabetic neuropathy, which has been commercialized as a diagnostic device for diabetes (Eh Schwarz et al. Citation2011). However, the AC response of the BIA method generally uses tetrapolar electrode systems to reduce skin contact resistance and electrode impedance effects (Grimnes and Martinsen Citation2007). In addition, the AC response is relatively less sensitive to skin temperature and humidity and is used to analyze physiological indicators that show mid- and long-term changes, such as body mass analysis, and the related market is continuously growing. The difference between these methods will be verified more clearly if the HRV and blood markers, such as hormones, related to the sympathetic nervous system are simultaneously measured using EDA and BIA methods measurements.
Moreover, the resistance determined via the EDA method deviated by 15.0 ± 2.0% from its mean value, whereas the SD over the entire measurement set was 45.7%. According to our previous studies (Bae, Kim et al., Citation2016), the mean difference in the DC voltage response between the diabetes group and the control group was 10.9%, and the SDs within each group were 25.5% and 39.1%, respectively. These results suggest that the circadian variation cannot be neglected to correctly diagnose pathological conditions. To increase the diagnostic power using the DC response, the circadian rhythm must be incorporated, which reflects the daily physiological modulation, as a correction factor. In contrast, the AC responses determined via the BIA method did not show this circadian variation; the three types of impedance data (the resistance, reactance and phase angle) showed no differences over the measurement period. Therefore, the AC response using the BIA method is rather insensitive to daily changes of physiological conditions and it may be more suitable for long-term body conditions such as fat-free mass and BC (Sun et al. Citation2003). These differences help explain why diagnosis using the BIA method has been actively researched and why the market is continuously growing (Grand View Research, Citation2015), whereas the health diagnostic market using the EDA method has failed to grow.
The limitation of this study was that the indicators that are associated with the sympathetic nervous system, such as blood markers and HRV, were not simultaneously measured; thus, we compared our study results indirectly with previous publications. In the future, simultaneous measurement with these known circadian variables will help reveal correlations between the responses and the EDA or BIA methods. Moreover, a larger sample size is required to confirm our findings and to improve the diagnostic power of the EDA method by extracting an accurate correction factor that accounts for the circadian rhythm.
Conclusion
In this study, circadian rhythms in the AC and DC response (using the BIA and EDA methods, respectively) were measured simultaneously for the first time. Interestingly, the DC response showed significant circadian rhythm, with a minimum resistance at approximately 16:00 and the acrophase was similar to that of HRV, suggesting an association with the sympathetic modulation. However, the AC response did not show such a significant circadian rhythm. Therefore, the DC response and the AC response of the human body contain different electrophysiological information. Specifically, the resistance of the EDA method varied by up to 15% (at approximately 16:00) from its mean value. We suggest that this daily modulation measured by the EDA method should be accounted for as a correction factor to apply this method for diagnostic purposes using the DC response. In contrast, the AC response did not show such circadian variation. This characteristic difference between DC and AC measurement techniques is a probable reason for the growing size of the health-care market based on the BIA method but the stagnant market based on the EDA method. Further investigations will be required with a study design that allows measuring the body’s electrical responses with the EDA and BIA techniques together with the HRV and other biomarkers with known circadian rhythms.
Declaration of interest
The authors report no conflicts of interest. The authors alone are responsible for the content and writing of this article.
Additional information
Funding
References
- Asahina M, Suzuki A, Mori M, Kanesaka T, Hattori T. 2003. Emotional sweating response in a patient with bilateral amygdala damage. Int J Psychophysiology. 47:87–93.
- Bae J-H, Kim S, Kaewkannate K, Jun M-H, Kim JU. 2016. Diagnosis of diabetes using voltage analysis based on EIS (Electro Interstitial Scan). J Inst Electronics Inf Engineers. 53:114–22.
- Benedek M, Kaernbach C. 2010. A continuous measure of phasic electrodermal activity. J Neurosci Methods. 190:80–91.
- Boucsein W. 2012. Electrodermal activity. New York: Springer.
- Boudreau P, Yeh WH, Dumont GA, Boivin DB. 2012. A circadian rhythm in heart rate variability contributes to the increased cardiac sympathovagal response to awakening in the morning. Chronobiol Int. 29:757–68.
- Boudreau P, Yeh WH, Dumont GA, Boivin DB. 2013. Circadian variation of heart rate variability across sleep stages. Sleep. 36:1919–28.
- Brown BH, Wilson AJ, Bertemes-Filho P. 2000. Bipolar and tetrapolar transfer impedance measurements from volume conductor. Electron Lett. 36:2060–62.
- Chen X, Chen L, Ding R, Shi Q, Zhang Y, Hu D. 2015. A preliminary investigation of EZSCAN screening for impaired glucose tolerance and diabetes in a patient population. Exp Ther Med. 9:1688–94.
- Cugini P, Salandri A, Petrangeli CM, Capodaglio PF, Giovannini C. 1996. Circadian rhythms in human body composition. Chronobiol Int. 13:359–71.
- Eh Schwarz P, Brunswick P, Calvet JH. 2011. EZSCANTM a new technology to detect diabetes risk. Br J Diabetes Vasc Dis. 11:204–09.
- Grand View Research I. 2015. Body Fat Measurement Market Analysis By Product (Bioimpedance Analyzers, Body Fat Skinfold Calipers, Air Displacement Plethysmography, Hydrostatic Weighing, Dual Emission X-ray Absorptiometry, Product Positioning, Comparative KOP) And Segment Forecasts To 2020.
- Grimnes S. 2014. Bioimpedance and bioelectricity basics. Boston (MA): Elsevier.
- Grimnes S, Martinsen ØG. 2007. Sources of error in tetrapolar impedance measurements on biomaterials and other ionic conductors. J Phys D Appl Phys. 40:9–14.
- Herpertz SC, Wenning B, Mueller B, Qunaibi M, Sass H, Herpertz-Dahlmann B. 2001. Psychophysiological responses in ADHD boys with and without conduct disorder: implications for adult antisocial behavior. J Am Acad Child Adolesc Psychiatry. 40:1222–30.
- Hoffer EC, Meador CK, Simpson DC. 1969. Correlation of whole-body impedance with total body water volume. J Appl Physiol. 27:531–34.
- Hot P, Naveteur J, Leconte P, Sequeira H. 1999. Diurnal variations of tonic electrodermal activity. Int J Psychophysiol. 33:223–30.
- Jaffrin MY, Morel H. 2008. Body fluid volumes measurements by impedance: A review of bioimpedance spectroscopy (BIS) and bioimpedance analysis (BIA) methods. Med Eng Phys. 30:1257–69.
- Janssen I, Heymsfield SB, Baumgartner RN, Ross R. 2000. Estimation of skeletal muscle mass by bioelectrical impedance analysis. J Appl Physiol (1985). 89:465–71.
- Kim M, Kim H. 2013. Accuracy of segmental multi-frequency bioelectrical impedance analysis for assessing whole-body and appendicular fat mass and lean soft tissue mass in frail women aged 75 years and older. Eur J Clin Nutr. 67:395–400.
- Kushner RF. 1992. Bioelectrical impedance analysis: a review of principles and applications. J Am Coll Nutr. 11:199–209.
- Maarek A. 2012. Electro interstitial scan system: assessment of 10 years of research and development. Med Devices (Auckl). 5:23–30.
- Malavolti M, Mussi C, Poli M, Fantuzzi AL, Salvioli G, Battistini N, Bedogni G. 2003. Cross-calibration of eight-polar bioelectrical impedance analysis versus dual-energy X-ray absorptiometry for the assessment of total and appendicular body composition in healthy subjects aged 21-82 years. Ann Hum Biol. 30:380–91.
- Martini F, Bartholomew EF, Ober WC. 2013. Essentials of anatomy & physiology. Boston: Massachusetts, US: Pearson.
- Medical_Centre_for_the_Prevention_of_Diseases. 0000. Validation of the DDFAO system/clinical test definitions of algorithms by inverse problems. http://www.screenyourbody.com/pdf/validation.pdf.
- Medrano G, Beckmann L, Gube M, Kasim R, Kim S, Kraus T, Leonhardt S. 2009. Continuous hand-to-foot and segmental bioimpedance spectroscopy measurements within a period of five days. In: R. Magjarevic(Ed.,) World Congress on Medical Physics and Biomedical Engineering. Munich (Germany): Springer; p. 122–25.
- Miyatani M, Kanehisa H, Fukunaga T. 2000. Validity of bioelectrical impedance and ultrasonographic methods for estimating the muscle volume of the upper arm. Eur J Appl Physiol. 82:391–96.
- Muller JE, Tofler GH, Stone PH. 1989. Circadian variation and triggers of onset of acute cardiovascular disease. Circulation. 79:733–43.
- Refinetti R, Lissen GC, Halberg F. 2007. Procedures for numerical analysis of circadian rhythms. Biol Rhythm Res. 38:275–325.
- Sheng CS, Zeng WF, Huang QF, Deslypere JP, Li Y, Wang JG. 2011. Accuracy of a novel non-invasive technology based EZSCAN system for the diagnosis of diabetes mellitus in Chinese. Diabetol Metab Syndr. 3:36.
- Shoji K, Maeda K, Nakamura T, Funahashi T, Matsuzawa Y, Shimomura I. 2008. Measurement of visceral fat by abdominal bioelectrical impedance analysis is beneficial in medical checkup. Obes Res Clin Pract. 2:269–75.
- Slinde F. 2003. Bioelectrical impedance variation in healthy subjects during 12 h in the supine position. Clinical Nutrition. 22:153–57.
- Slinde F, Lena R-H. 2001. Bioelectrical impedance: effect of 3 identical meals on diurnal impedance variation and calculation of body composition. Am J Clin Nutr. 74:474–78.
- Smolensky MH, Hermida RC, Reinberg A, Sackett-Lundeen L, Portaluppi F. 2016. Circadian disruption: New clinical perspective of disease pathology and basis for chronotherapeutic intervention. Chronobiol Int. 33:1101–19.
- Stratmann M, Schibler U. 2006. Properties, entrainment, and physiological functions of mammalian peripheral oscillators. J Biol Rhythms. 21:494–506.
- Sun SS, Chumlea WC, Heymsfield SB, Lukaski HC, Schoeller D, Friedl K, Kuczmarski RJ, Flegal KM, Johnson CL, Hubbard VS. 2003. Development of bioelectrical impedance analysis prediction equations for body composition with the use of a multicomponent model for use in epidemiologic surveys. Am J Clin Nutr. 77:331–40.