 ?Mathematical formulae have been encoded as MathML and are displayed in this HTML version using MathJax in order to improve their display. Uncheck the box to turn MathJax off. This feature requires Javascript. Click on a formula to zoom.
ABSTRACT
In both mammals and fish, the circadian system is composed of oscillators that function at the cellular, tissue, and system levels and show the cyclic expression of clock genes. The organization and functioning of the biological clock in fish has not yet been characterized in detail, therefore, in the present study, an extensive analysis of the rhythmic expression of the main components of the biological clock in the central and peripheral organs of common carp was performed. The diurnal changes in clock gene expression were determined with respect to the subjective light cycle in fish exposed to constant light or darkness. It was found that the pattern of expression of clock, bmal, per and cry genes in carp was highest in the brain, pituitary gland, and retina. The peak clock and bmal expression was phase aligned with the lights off, whereas both per genes show similar phasing with acrophase close to light onset. The expression of cry genes varied depending on the type of tissue and the subtype of gene. The diurnal changes in the expression of clock genes demonstrates that, in particular, the expression of the clock in the retina shows endogenous oscillations independent of the influence of light. The data suggest that in carp, the time-varying expression of individual genes allows for a diverse and tissue-specific response to secure oscillations with variable phase and period.
Introduction
All living organisms are under the constant influence of the highly variable surrounding environment. Daily and seasonal changes in the intensity of light, temperature, and other physical and chemical factors significantly affect the animal physiology. This forces the adaptation of the behavior, physiological and biochemical processes to synchronize with these changes, allowing the organisms to anticipate changes in their environment (Bloch et al. Citation2013). One of the best known and most frequently occurring biological rhythms are circadian rhythms or oscillations around the 24 hour rhythm period (Potter et al. Citation2016).
The circadian regulation of various biological processes is phylogenetically conserved and occurs in all living organisms, from unicellular organisms and plants to mammals (Panda et al. Citation2002). In mammals, circadian rhythms are controlled by the suprachiasmatic nucleus (SCN) in the hypothalamus. Light signals are specifically perceived by photosensitive retinal ganglion cells in the eye and then reach the central oscillator in the SCN that synchronizes the central and peripheral molecular clocks. Signals from the central pacemaker entrain and synchronize the peripheral clocks (Doyle and Menaker Citation2007; Maywood et al. Citation2007). As in other animals, also in teleost fish, circadian oscillations are driven by a central biological clock in the brain and are synchronized by light cycles (Del Pozo et al. Citation2011). The functioning of this highly conserved endogenous mechanism in most animals is based on the presence in the cells of autonomous and integrated transcription-translational feedback loops. In mammals, they include clock genes such as per, cry, bmal, and clock (Partch et al. Citation2014). These loops are formed by positive elements such as CLOCK and BMAL1 that form the CLOCK-BMAL1 heterodimers. These heterodimers activate the transcription of circadian target genes by binding to E-box elements within the promoter regions of genes encoding the proteins: PER, CRY, REV-ERBα, RORα and DBP. After a period of time, the negative components: PER and CRY translocate into the nucleus and repress their own expression by interfering with the CLOCK-BMAL1 complex in the gene promoter. This negative loop establishes a daily expression pattern for per and cry genes and their protein products (Iuvone et al. Citation2005; Okamura et al. Citation2002). In turn, REV-ERBα (NR1D1, transcriptional repressor of bmal1) and RORα (transcriptional activator of bmal1) proteins act to stabilize the clock mechanism, whereas posttranslational modifications of the PER-CRY dimer are required to set the rhythm period (Takahashi et al. Citation2008).
The genome of teleost fish contains numerous orthologs of key clock genes. However, due to the whole genome duplication event that occurred early in evolution, there are additional copies of the clock genes (Cahill Citation2002; Postlethwait et al. Citation1998). For example, in zebrafish, for which the molecular basis of the biological clock has been well described, six cry, four per, three clock, and three bmal genes have been identified. Those genes differ in sequence and function, as well as exhibit different rhythms of expression pattern (Hirayama et al. Citation2003; Kobayashi et al. Citation2000; Wang Citation2008, Citation2009). Consequently, the additional clock genes present in fish make the organization of the biological clock in this group of vertebrates more complicated than in mammals due to the existence of more complex regulatory loops.
In Teleosts, unlike mammals, there are multiple coupled central circadian oscillators. They are located in various tissues such as the retina, pineal gland and hypothalamus, but their functions are similar to those in mammals (Falcón et al. Citation2010; López-Patiño et al. Citation2011; Menaker et al. Citation1997). These organs are responsible for processing photic information and establishing a circadian rhythm. This is achieved by rhythmic expression of clock genes and release an endocrine output, such as the rhythmic secretion of melatonin. Moreover, fish pineal cells resemble classic photoreceptors in structure and function. Therefore, these organs are considered central pacemakers in fish that translate environmental light-dark information into neural and neuroendocrine signals (Cahill Citation2002; Falcón et al. Citation2011). Most probably, in fish the central oscillators do not have such a superior function as in mammals, and the peripheral clocks present in fish operate independently and are directly responsive to light (Plautz et al. Citation1997). In some teleost species, peripheral clocks have been found in various organs, such as the liver, heart, spleen, intestine, and gall bladder. These organs are characterized by the rhythmic expression of clock genes (Betancor et al. Citation2014; Hernández-Pérez et al. Citation2017; Kaneko et al. Citation2006; Velarde et al. Citation2009). However, little data are available regarding the circadian expression patterns of individual clock elements at the protein level in fish.
To the best of our knowledge, the circadian changes of the clock components in the common carp (Cyprinus carpio L.) have not been characterized so far. Therefore, we present here a comprehensive analysis of the rhythmic expression of the main components of the molecular clock in the central and peripheral organs of this important species of fish for aquaculture. We performed an analysis of the daily oscillations of their mRNA expression pattern. Circadian patterns of expression were determined in relation to the subjective light cycle in fish exposed to continuous darkness and continuous lighting.
Materials and methods
Experimental animals
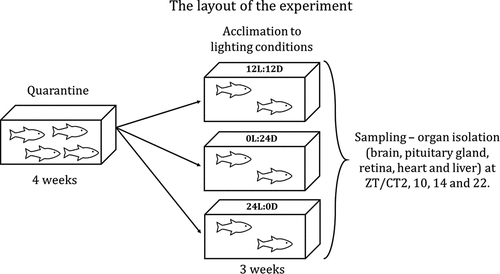
Common carp (Cyprinus carpio L., line R3xR8, 0.18–0.21 kg body weight, aged 12 months) were obtained from the Institute of Ichthyobiology and Aquaculture, Polish Academy of Sciences, Golysz, Poland. After transport, the fish were quarantined for 4 weeks in the new environment of the animal facility at the Institute of Zoology and Biomedical Research, Jagiellonian University, Krakow, Poland. The fish were kept in tanks with recirculated tap water (volume 375 L, flow rate 4 L min−1, density 45 fish/tank, and 60 10−3 kg L−1) at 21 °C and fed pelleted dry food (Aller Master, Aller Aqua, Poland) at a daily maintenance rate of 1% of their estimated body weight. Animals were maintained under a 12L:12D (LD) photoperiod (12 h of light and 12 h of darkness) with lights on at ZT0. Light was set to mimic sunrise, by gradually increasing its intensity from the onset to 30 minutes after onset, and sunset, by gradually decreasing its intensity starting from 30 minutes prior to switching off the light for 4 weeks. After the quarantine period, the three experimental groups (n = 8) were further adapted for 3 weeks to different light regimes: 12 h of light and 12 h of darkness (LD), constant darkness (0 h of light and 24 h of darkness, DD) and constant light (24 h of light and 0 h of darkness, LL) (). The light intensity during the day in LD and for the entire time in LL, at the water surface level, was 400 lux, while during the night in LD and for the entire time in DD, the light intensity was 0 lux. All animals were handled in strict accordance with good animal practice as defined by the relevant national and/or local animal welfare bodies, and all animal work complied with the applicable legal acts (Directive 2010/63/EU, Polish Act on the protection of animals used for scientific or educational purposes).
Figure 1. The layout of the experiment. After reaching the animal facility at the Institute of Zoology and Biomedical Research, Jagiellonian University, Krakow, Poland, the fish were quarantined for 4 weeks. Before the experiments, selected groups of fish were acclimated to the LD (12 hours light and 12 hours darkness), LL (constant lighting) or DD (constant darkness) light regime for 3 weeks. After acclimation the brain, pituitary gland, retina, heart and liver were isolated at four different time points (2, 10, 14 and 22 hours after the onset of light in LD and LL, and at the same time, but without any light in DD).
Experiment design
After the appropriate acclimation time, all experiments were conducted at four different time points (Zeitgeber/Circadian Time (ZT/CT) 2, 10, 14, and 22) based on a review of the literature data showing the largest differences in the expression of the components of the biological clock in the circadian cycle (Amaral and Johnston Citation2012; Hsu et al. Citation2021; Takata et al. Citation2002; Velingkaar et al. Citation2020; Vera and Migaud Citation2016; Zhao et al. Citation2015). At a given time point, the fish were anesthetized with 0.2 10−3 kg L−1 tricaine methanesulfonate (TMS; Sigma-Aldrich, St. Louis, MO, USA) buffered with 0.4 10−3 kg L−1 NaHCO3 (POCH, Gliwice, Poland). In the case of fish kept under the DD light regime, as well as at night, the fish were anesthetized in complete darkness just prior to the experiment, then the organs were isolated under sterile environment in a laminar chamber with low lighting. All experiments were conducted in the following days, one after another.
Tissue isolation
Immediately after anesthesia, the fish were bled through caudal vein puncture using a sterile needle attached to a 10 mL syringe. A maximum of 6 mL of blood were collected from each fish. After bleeding, tissues/organs (heart, liver, brain, pituitary gland, and retina) were isolated and rapidly placed in FIX RNA solution (EURx, Gdansk, Poland) and kept in the dark, then placed at −80 °C for tissue preservation, until RNA isolation was performed.
Gene expression
RNA purification
Tissues kept in FIX RNA were homogenized in RL buffer (EURx, Gdansk, Poland) using a manual homogenizer (Sigma-Aldrich, St. Louis, MO, USA). RNA was isolated from tissues with a GeneMATRIX Universal RNA Purification Kit (EURx, Gdansk, Poland) according to the manufacturer’s protocol. To enhance the purification process of RNA, a 15 min incubation of the sample with RNase-free DNase I (2 U, EURx, Gdansk, Poland) was applied. The final elution was carried out in 30 μL of RNase-free water (Ambion, Waltham, MA, USA), to maximize RNA concentration. Before proceeding to further analyses, the RNA was quantified and its quality and purity were verified spectrophotometrically using a Tecan Spark NanoQuant PlateTM spectrophotometer (Tecan, Männedorf, Switzerland). The samples were stored at −80 °C.
cDNA synthesis
The cDNA synthesis was performed using a High-Capacity cDNA Reverse Transcription kit (Applied Biosystems, Waltham, MA, USA) according to the manufacturer’s protocol. An aliquot of 500 ng of total RNA from tissues was mixed in a 1:1 ratio with a master mix containing 2 μL 10X RT buffer, 2 μL 10X RT random primers, 0.8 μL 25X dNTP mix (100 mM), 1 μL MultiSribe™ reverse transcriptase, and 4.2 μL of RNase-free water. To ensure that the cDNA synthesis process was performed correctly for each reaction, a negative control sample (non-reverse transcriptase) was included in which 1 μL of RNase-free water was added to the mix instead of MultiSribe™ reverse transcriptase. The reaction was carried out in a thermal cycler (Ditabis AG, Pforzheim, Germany) for 10 min at 25 °C, followed by 120 min at 37 °C. Reverse transcriptase was inactivated for 5 min at 85 °C and then the samples were diluted in 80 μL of RNase-free water (Ambion, Waltham, MA, USA) and stored at −20 °C until further analysis.
Real-time quantitative polymerase chain reaction (RT-qPCR)
PRIMER EXPRESS software (Applied Biosystems, Waltham, MA, USA) was used to design primers for use in real-time quantitative PCR. Carp-specific primers (5’ to 3’) for gene expression of clock genes: per1, per2, cry1, cry2, clock, bmal1, and bmal2 were used (). The 40S ribosomal protein s11 gene served as an internal standard. This housekeeping gene showed a relatively constant expression level in all tissues/organs tested.
Table 1. Primer sequences with corresponding accession numbers used to quantify clock gene expression.
All reactions were carried out on the thermal cycler Rotor-Gene Q (Qiagen, MD, USA). The reaction mixture included 7 μL of SYBR® Select Master Mix (Applied Biosystems, Waltham, MA, USA), 2 μL of both forward and reverse primers (2 μM for 40S and 1 μM for others) and 4 μL of the analyzed cDNA sample. Amplification was specific and no amplification was observed in negative control samples (non-template control and non-reverse transcriptase control). The real-time qPCR conditions were as follows: preheating at 50 °C for 2 min, denaturation at 95 °C for 2 min and 40 cycles of amplification and quantification (15 s at 95 °C and 60s at 60 °C), followed by melt curve analysis (at ramp +0.5 °C). The constitutive expression of target genes was rendered as a ratio of the reference gene (40S gene) relative to the target gene and was calculated according to the equation:
where E is the amplification efficiency and Ct is the threshold cycle (the number of PCR cycles needed for the signal to exceed a predetermined threshold value).
Statistical analysis
Statistical analysis were performed with GraphPad Prism (GraphPad Software, San Diego, CA, USA). To compare the results obtained from multiple groups, when data sets followed a Gaussian distribution measured using the Shapiro-Wilk normality test or met the equal variance requirement (Brown-Forsythe test), one-way ANOVA followed by Tukey’s post hoc test was used. If the data results did follow a Gaussian distribution, but did not have equal standard deviation, the Brown-Forsythe and Welch ANOVA test followed by Dunnett’s T3 multiple comparison test were used. If the results did not follow a Gaussian distribution, the Kruskal-Wallis test followed by Dunn’s multiple comparison test was used. The level of significance was set at p < .05. Grubb’s test was employed to remove outliers. COSINOR was performed to determine the parameters defining rhythmicity and rhythm percentage (RP). The analysis was performed by fitting a periodic sinusoidal function to the expression of clock genes in the four ZT/CTs, using the formula , where f(t) is the gene expression level at a given time, Mesor is the mean value, Amplitude is the difference in the level between peak and trough values, t is time in hours and Acrophase is the time of peak expression. An F test was used to determine the significance of a 24-hour rhythm by rejecting the zero amplitude hypothesis (p < .05). The n values indicate the number of individuals analysed. Data were presented as means ± SEM.
Results
Diurnal changes of per gene expression
The highest expression of per1 and per2 occurred in the brain and the lowest in the liver at all four time points under the photoperiod of LD (, p < .05; One-way ANOVA). For all organs tested under the LD photoperiod, the expression of per1 () and per2 () expression was higher at ZT2 and 22 and lower at ZT10 and 14, and followed a diurnal pattern (p < .05; One-way ANOVA). In constant darkness (DD regime) and constant lighting (LL regime), circadian changes of expression of per1 were observed only in the liver (, p < .05; One-way ANOVA). The weakest changes in amplitude were found only in the liver under all the light regimes examined (). In case of per2, its circadian expression was observed under the DD regime only in the brain (, p < .05; One-way ANOVA) and the pituitary gland (, p < .05; One-way ANOVA), while under the constant lighting per2 circadian expression was found, similar to the expression of per1, only in the liver (, p < .01; One-way ANOVA).
Figure 2. Diurnal changes in the expression of the per1 gene in various organs of common carp. Relative levels of per1 mRNA at different time points in the brain (a), pituitary gland (b), retina (c), heart (d) and liver (e) of fish kept under LD (12L:12D, gray bars), DD (0L:24D, black bars) and LL (24L:0D, white bars) light regimes. Data obtained from RT-qPCR analysis are shown as mean ± SEM (n = 8). The 40S ribosomal protein s11 gene served as the reference housekeeping gene. When significant (Kruskal-Wallis test or one-way ANOVA, p < .05), differences between time points are indicated by different letters (A, B, C for LD; a, b, c for DD and α, β for LL).
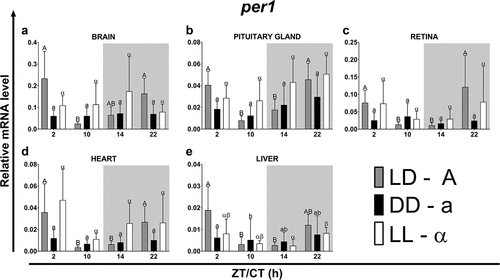
Figure 3. Diurnal changes in the expression of the per2 in various organs of common carp. Relative per2 mRNA levels at different time points in the brain (a), pituitary gland (b), retina (c), heart (d) and liver (e) of fish kept under LD (12L:12D, gray bars), DD (0L:24D, black bars) and LL (24L:0D, white bars) light regimes. Data obtained from RT-qPCR analysis are shown as mean ± SEM (n = 8). The 40S ribosomal protein s11 gene served as the reference housekeeping gene. When significant (Kruskal-Wallis test or one-way ANOVA, p < .05), differences between time points are indicated by different letters (A, B, C for LD; a, b, c for DD and α, β for LL).
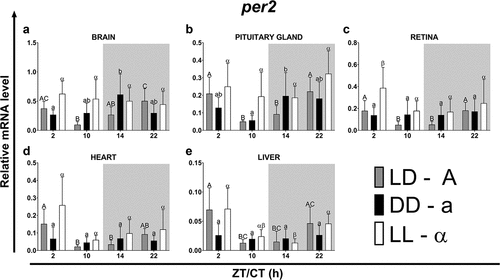
Table 2. Parameters defining daily oscillations of per1 in various tissues of common carp (n = 8) obtained with Cosinor analysis. LD – 12L:12D, DD – 0L:24D, LL – 24L:0D, RP – rhythm percentage.
Under both the DD and the LL light regimes, there were phase shifts in the expression of per1 and per2 in the organs tested compared to the fish maintained under the LD photoperiod (, ). The length of the rhythm period was independent of the light conditions only in the heart (in the case of both genes), in the brain (per1) and in the liver (per2). In the case of the remaining organs, the period was lengthened (per2 under DD and LL in the retina) or shortened (per1 under DD and LL in the pituitary gland and liver, per1 under DD in the retina, per2 under DD and LL in the pituitary gland, and per2 under DD in the brain) (). Among all examined organs, under all analyzed light regimes, the lowest amplitudes of per expression were observed in the liver while the highest amplitudes were found in neural tissues – in the brain under the LD (per1 and per2), LL (per1) and DD (per2) regimes, and in the retina under DD (per1) and LL (per2) photoperiods ().
Table 3. Parameters defining daily oscillations of per2 in various tissues of common carp (n = 8) obtained with Cosinor analysis. LD – 12L:12D, DD – 0L:24D, LL – 24L:0D, RP – rhythm percentage.
Diurnal changes of cry gene expression
In fish maintained under the LD photoperiod, at all time points tested of the day, the highest expression of cry1 and cry2 was observed in the brain, while in the rest of the organs tested it was at the lower similar level (, p < .05; One-way ANOVA). Under the LD photoperiod in most of the organs analyzed, cry gene expression was highest at the beginning of the light phase (ZT2) or at the beginning of the night (ZT14) ().
Figure 4. Diurnal changes in the expression of the cry1 in various organs of common carp. Relative levels of cry1 mRNA at different time points in the brain (a), pituitary gland (b), retina (c), heart (d) and liver (e) of fish kept under LD (12L:12D, gray bars), DD (0L:24D, black bars) and LL (24L:0D, white bars) light regimes. Data obtained from RT-qPCR analysis are shown as mean ± SEM (n = 8). The 40S ribosomal protein s11 gene served as the reference housekeeping gene. When significant (Kruskal-Wallis test or one-way ANOVA, p < .05), differences between time points are indicated by different letters (A, B, C for LD; a, b, c for DD and α, β for LL).
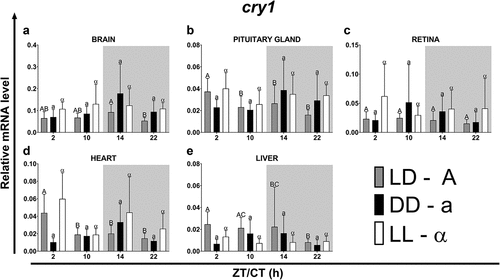
In fish maintained under the photoperiod of LD, the most pronounced diurnal changes in the amplitude of cry1 expression were observed in the pituitary gland (, p < .05; One-way ANOVA) and heart (, p < .01; One-way ANOVA), while in the case of cry2, these changes were observed in the brain (, p < .05; One-way ANOVA). In fish kept under the DD light regime, the expression of the cry2 gene followed daily changes in the pituitary gland (, p < .01; One-way ANOVA) and the heart (, p < .05; One-way ANOVA).
Figure 5. Diurnal changes in the expression of the cry2 in various organs of common carp. Relative levels of cry2 mRNA at different time points in the brain (a), pituitary gland (b), retina (c), heart (d) and liver (e) of fish kept under LD (12L:12D, gray bars), DD (0L:24D, black bars) and LL (24L:0D, white bars) light regimes. Data obtained from RT-qPCR analysis are shown as mean ± SEM (n = 8). The 40S ribosomal protein s11 gene served as the reference housekeeping gene. When significant (Kruskal-Wallis test or one-way ANOVA, p < .05), differences between time points are indicated by different letters (A, B, C for LD; a, b, c for DD and α, β for LL).
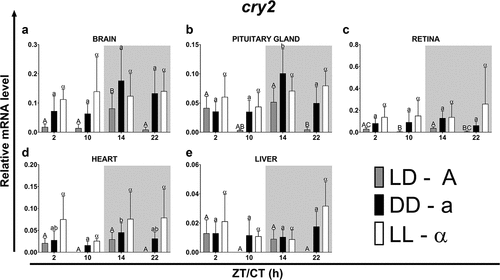
In the case of cry1, the phase shifts occurred in both the DD and LL regimes, while in the case of cry2, they were mainly observed in fish from the LL regime and in all organs, except the brain, they consisted of a delay in the rhythm phase (). Under the LD photoperiod, the cry1 rhythm was longer than that of cry2 in all organs, except the brain. Furthermore, in most organs, the rhythm period of cry1 was shortened under constant lighting conditions (DD and LL), while in the case of cry2, the rhythm period was usually prolonged, both in the DD and LL regimes (). Both transcript levels showed a significant daily variation; however, this was higher for cry2. For both genes under the LD and DD regimes, the amplitude was highest in the brain, while in the LL it was highest in the heart ().
Table 4. Parameters defining daily oscillations of cry1 in various tissues of common carp (n = 8) obtained with Cosinor analysis. LD – 12L:12D, DD – 0L:24D, LL – 24L:0D, RP – rhythm percentage.
Table 5. Parameters defining daily oscillations of cry2 in various tissues of common carp (n = 8) obtained with Cosinor analysis. LD – 12L:12D, DD – 0L:24D, LL – 24L:0D, RP – rhythm percentage.
Diurnal changes of bmal gene expression
In fish maintained under LD photoperiod, at ZT14 and 22 the highest expression of bmal1 was observed in the brain and pituitary gland, while in the rest of the organs tested it was at a similar lower level (, p < .05; One-way ANOVA). Furthermore, the expression of bmal1 in the pituitary gland (, p < .05; One-way ANOVA) and the heart (, p < .05; One-way ANOVA) was the lowest during the light phase (at ZT2 and 10) and the highest at the beginning of the night (ZT14). On the contrary, the highest expression of bmal2 was found in the liver at ZT2 (, p < .01; One-way ANOVA) and the lowest at ZT22 in the pituitary gland (, p < .05; One-way ANOVA), retina (, p < .05; One-way ANOVA) and liver (, p < .01; One-way ANOVA). In the retina, the expression level of this gene was highest at the end of the day (ZT10) and at the beginning of the night (ZT14) and the lowest at the end of the night (ZT22) (, p < .05; One-way ANOVA). In turn, in the brain (, ns; One-way ANOVA) and heart (, ns; One-way ANOVA), the expression of bmal2 under the LD photoperiod remained at a similar level throughout the day. The lowest expression of bmal2 was measured at ZT22 and was at a similar level in all organs except the brain and heart (, p < .05; One-way ANOVA).
Figure 6. Diurnal changes in the expression of the bmal1 in various organs of common carp. Relative levels of bmal1 mRNA at different time points in the brain (a), pituitary gland (b), retina (c), heart (d) and liver (e) of fish kept under LD (12L:12D, gray bars), DD (0L:24D, black bars) and LL (24L:0D, white bars) light regimes. Data obtained from RT-qPCR analysis are shown as mean ± SEM (n = 8). The 40S ribosomal protein s11 gene served as the reference housekeeping gene. When significant (Kruskal-Wallis test or one-way ANOVA, p < .05), differences between time points are indicated by different letters (A, B, C for LD; a, b, c for DD and α, β for LL).
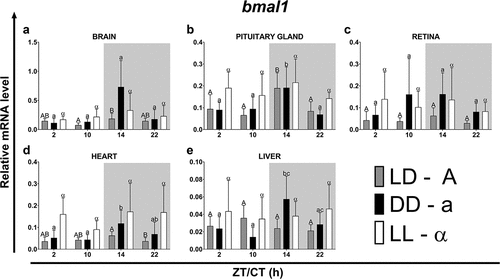
Figure 7. Diurnal changes in the expression of the bmal2 in various organs of common carp. Relative levels of bmal2 mRNA at different time points in the brain (a), pituitary gland (b), retina (c), heart (d) and liver (e) of fish kept under LD (12L:12D, gray bars), DD (0L:24D, black bars) and LL (24L:0D, white bars) light regimes. Data obtained from RT-qPCR analysis are shown as mean ± SEM (n = 8). The 40S ribosomal protein s11 gene served as the reference housekeeping gene. When significant (Kruskal-Wallis test or one-way ANOVA, p < .05), differences between time points are indicated by different letters (A, B, C for LD; a, b, c for DD and α, β for LL).
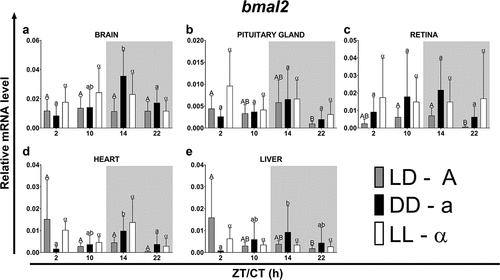
Under constant lighting conditions (DD or LL regime), the rhythm phase of both genes was advanced or delayed in various organs. Only in the pituitary gland and the retina the rhythm phase, respectively, for the bmal1 and bmal2, remain unchanged despite changing lighting conditions (). Only in the pituitary gland there was no change in the rhythm period of bmal2 expression after the transfer of the fish to the DD and LL light regimes (). Regardless of the light regime, the highest amplitudes of the bmal1 expression rhythm occurred in the brain and the lowest in the liver. On the other hand, regardless of the analyzed regime and organ, the bmal2 rhythm was characterized by much lower amplitudes ().
Table 6. Parameters defining daily oscillations of bmal1 in various tissues of common carp (n = 8) obtained with Cosinor analysis. LD – 12L:12D, DD – 0L:24D, LL – 24L:0D, RP – rhythm percentage.
Table 7. Parameters defining daily oscillations of bmal2 in various tissues of common carp (n = 8) obtained with Cosinor analysis. LD – 12L:12D, DD – 0L:24D, LL – 24L:0D, RP – rhythm percentage.
Diurnal changes of clock gene expression
In all organs examined except the heart, a similar pattern of clock gene expression was observed under the LD photoperiod, with the highest level at ZT14 (). The expression of the clock at ZT14 was highest in the brain, pituitary gland, and retina, and lowest in the heart and liver (). At other time points in all examined organs, the clock mRNA level was very low (). In fish kept under LD photoperiod, the most pronounced diurnal changes of clock expression were observed in the pituitary gland (, p < .05; One-way ANOVA), heart (, p < .05; One-way ANOVA) and liver (, p < .05; One-way ANOVA). Under both the DD and the LL photoperiods, the level of clock expression was at the same level at all of the time points examined ().
Figure 8. Diurnal changes in the expression of the clock in various organs of common carp. Relative levels of clock mRNA at different time points in the brain (a), pituitary gland (b), retina (c), heart (d) and liver (e) of fish kept under LD (12L:12D, gray bars), DD (0L:24D, black bars) and LL (24L:0D, white bars) light regimes. Data obtained from RT-qPCR analysis are shown as mean ± SEM (n = 8). The 40S ribosomal protein s11 gene served as the reference housekeeping gene. When significant (Kruskal-Wallis test or one-way ANOVA, p < .05), differences between time points are indicated by different letters (A, B, C for LD; a, b, c for DD and α, β for LL).
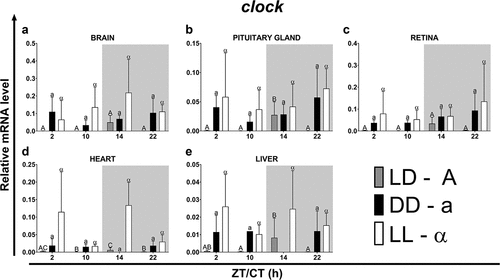
Figure 9. Diurnal changes of the expression of clock genes in various organs of common carp. Relative mRNA levels of clock genes at different time points in all organs examined of fish kept under LD (12L:12D) light regime. Data obtained from RT-qPCR analysis are shown as mean ± SEM (n = 8). The 40S ribosomal protein s11 gene served as the reference housekeeping gene. When significant (Kruskal-Wallis test or one-way ANOVA, p < .05), differences between time points are indicated by different letters (A, B, C).
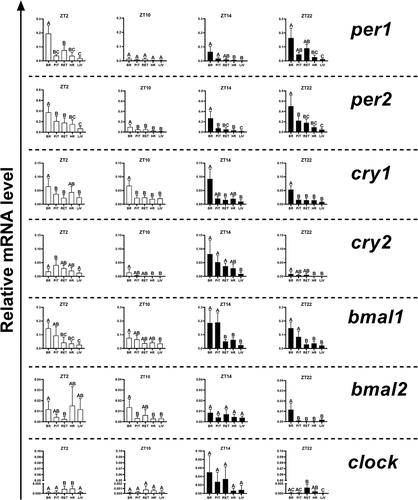
In constant darkness, the rhythm phase of clock expression was advanced (brain, pituitary gland) or delayed (heart, liver) compared to the LD regime, while in constant light, only in the pituitary gland and liver there was a delay in the phase. In the remaining organs, acrophase was observed at the same time as in the LD regime (). In fish maintained under the LD photoperiod, only in the heart the rhythm period of the clock differed from that of other organs and was about 1.5 hours shorter. In the other organs, the period of clock expression was approximately 22 hours. On the other hand, in constant darkness or in constant light, the rhythm was extended (brain, retina under DD and LL, pituitary gland under LL) or shortened (pituitary gland under DD, heart and liver under LL) (). Regardless of the light regime, the highest amplitudes were observed in the brain, while the lowest in the heart, under the LD regime, and in the liver, under the DD and LL regimes ().
Table 8. Parameters defining daily oscillations of clock in various tissues of common carp (n = 8) obtained with Cosinor analysis. LD – 12L:12D, DD – 0L:24D, LL – 24L:0D, RP – rhythm percentage.
Discussion
In the present study, we investigated the diurnal variations in the gene expression of key elements of central and peripheral biological clocks in common carp. Our data reveal robust diurnal oscillations of the main components of the biological clock in the neural and peripheral organs of carp in individual light regimes, LD, DD, and LL. Moreover, we found that the daily expression changes are gene- and organ-specific and synchronized with the photoperiod. As in the case of other studies, the expression patterns of the studied genes are characterized by tissue-dependent acrophases that are affected by the photoperiod (Cermakian et al. Citation2000; Davie et al. Citation2009; Huang et al. Citation2010; López-Patiño et al. Citation2011).
In other animal groups the main components of the clock mechanism are found primarily in different areas of the nervous system, such as the suprachiasmatic nuclei of the mammalian hypothalamus (Mohawk et al. Citation2012), the pineal gland in birds and reptiles (Menaker et al. Citation1997), the eye of mollusks (Block et al. Citation1995), the visual lobes or the middle part of the brain of insects (Peschel and Helfrich-Förster Citation2011). Similarly, in fish the main niche of the biological clock is the nervous system. Therefore, it is not surprising that in the current study the expression of biological clock genes was highest in the nervous system, especially in the brain, but also in the pituitary gland and the retina. Genes encoding positive elements of the molecular circadian clock, such as clock and bmal (especially bmal1), showed the highest expression at the beginning of the dark phase. On the other hand, the genes per1, per2, cry1, and cry2, which are responsible for the negative arm of the clock mechanism, showed higher expression at the end of the night and at the beginning of the light phase (per) or at the beginning of the day and at the beginning of the dark phase (cry). This is in line with the vertebrate circadian clock model, where the positive and negative components are expressed in antiphase (Cahill Citation2002). For example, similar changes were also observed in the pituitary gland of European sea bass (Dicentrarchus labrax), where additional acrophases of per1, like in our study, appeared close to light onset, in antiphase with clock (Herrero and Lepesant Citation2014). Also, in whole brain homogenates of this fish, both in nocturnal and diurnal individuals, acrophases for per1 occurred around light-on (Del Pozo et al. Citation2012a; Sánchez et al. Citation2010; Sánchez and Sánchez-Vázquez Citation2009). Also in birds, such as white-rumped muna (Lonchura striata) and redheaded bunting (Emberiza bruniceps), in various organs such as: retina, hypothalamus, liver, heart, intestine and stomach, there were increased expression of the clock and bmal1 genes with the onset of night (Lalpekhlui et al. Citation2022; Singh et al. Citation2013). Similarly, in the liver of mice at the beginning of the resting phase, high levels of Bmal1 mRNA were noted (Wu et al. Citation2017). We found that under LD conditions, regardless of the organ examined, both per1 and per2 show similar phasing with acrophase close to light onset. This is in agreement with the results obtained for zebrafish (Tamai et al. Citation2005), golden rabbitfish (Park et al. Citation2007), goldfish (Velarde et al. Citation2009), wrasse (Hur et al. Citation2012), and rainbow trout (López-Patiño et al. Citation2011). Similar changes were also observed in the expression of per2 in numerous organs of white-rumped muna and redheaded bunting and in the expression of the per2 and per3 genes in tree sparrow (Passer montanus) (Lalpekhlui et al. Citation2022; Renthlei et al. Citation2019; Singh et al. Citation2013). The increase in per2 expression in the liver also accompanies the initial phase of the activity of mice (Wu et al. Citation2017). However, under constant light conditions (DD or LL), diurnal fluctuations of the expression of per1 and per2 changed. There was a marked phase shift, especially in tissues related to the nervous system (brain, retina). Interestingly, the presented changes were less related to peripheral organs, such as the heart and liver, in which the circadian changes of the per genes expression differ primarily in amplitude. This strongly suggests that central biological clocks are more sensitive to light signals, while peripheral clocks are endogenously regulated and are less susceptible to incoming light information.
On the other hand, acrophases for cry genes in the brain and pituitary gland of sea bass were reported shortly after light-on (cry1) and at the end of the light phase (cry2) (Del Pozo et al. Citation2012b; Herrero and Lepesant Citation2014). In this case, it was also observed that the acrophases for cry1 were similar in the heart and liver as well as for cry2 in the liver. On the contrary, cry2 expression in the heart of seabass was not rhythmic and peaked at the beginning of the dark phase (Del Pozo et al. Citation2012b). In our study, we confirmed that cry acrophases can differ in a tissue-dependent manner, similar to different cry genes in zebrafish (Kobayashi et al. Citation2000) and goldfish, or the same cry subtype in different tissues (Velarde et al. Citation2009). We observed that the acrophases for cry1 and cry2 differed between tissues within the subtype of a given gene, as well as between genes. It turns out that this lack of a specific daily pattern of changes in the expression of cry genes is characteristic not only of fish, as similar differences regarding, for example, the time of acrophase occurrence during the day depending on the tissue, were observed in white-rumped muna and redheaded bunting (Emberiza bruniceps) (Lalpekhlui et al. Citation2022; Singh et al. Citation2013). Expression of cry1 in most organs except the brain was highest at the beginning of light phase, while in the brain the highest expression was just after the lights were turned off. In turn, the peak of cry2 expression was observed at the beginning of the dark phase and was found only in the liver at the beginning of the light phase. This diurnal variability of the cry2 mRNA level resembles the daily oscillation of the cry gene expression level observed in various organs in tree sparrow, where the highest level of mRNA, especially cry1, was found at the transition from day to night (Renthlei et al. Citation2019). We did not find the rhythmicity of the cry expression in the organs tested. Previously, similar results were obtained for cry1 expression in the liver and intestine of goldfish (Velarde et al. Citation2009). However, in constant light, acrophases appeared shortly before or after the start of the subjective day, except for the brain. Interestingly, in constant darkness, a clear phase shift and acrophases were noted in all tissues except the retina and liver during subjective night. We are probably dealing here with the effect of light, which seems to be a factor responsible for maintaining the daily variability in the expression of the clock genes. Here, light plays a major role in the synchronization of per and cry gene expression leading to the simultaneous expression of protein products of these genes, which play a key role in the molecular clock mechanism. Such simultaneous maximum expression of these genes, immediately after switching on the light, was observed in the brain, retina, liver, heart, and intestine in various species (Del Pozo et al. Citation2012b; Lahiri et al. Citation2005; Sánchez et al. Citation2010; Sánchez and Sánchez-Vázquez Citation2009; Vallone et al. Citation2005; Velarde et al. Citation2009). This allows the protein products of the per and cry genes to bind together and generate a functional PER-CRY complex that ultimately inhibits the transcription of the per and cry, thereby closing the negative feedback loop of the clock mechanism.
Thereafter, the expression of the clock showed clear diurnal oscillations with acrophase at the beginning of the dark phase in all carp organs examined. This is a typical diurnal variability for this gene, which was also observed, e.g., in the pituitary gland of the sea bass (Herrero and Lepesant Citation2014) or in the brain and in other organs of the zebrafish (Whitmore et al. Citation1998; Zhdanova et al. Citation2008), as well as in the retina and the hypothalamus of the rainbow trout (López-Patiño et al. Citation2011). It turned out that under constant lighting these changes persisted in the brain, retina, and heart, and under constant darkness only in the retina. A distinct phase shift was observed in the remaining organs. This indicates an endogenous regulation of this gene expression in the retina and the key role of light in regulating diurnal changes in the expression of the clock in both central and peripheral clocks. It also confirms that under constant darkness, the circadian pattern of clock gene expression is disturbed. Interestingly, in constant darkness, the expression of both bmal genes in all tissues studied is characterized by acrophase at the transition between subjective day and night or at the beginning of a subjective night. In other light regimes, it varies depending on the gene as well as the organ. However, it seems that the key role in the molecular mechanism of the clock is played by bmal1, which in the normal light cycle (LD) is characterized by acrophase in all organs, except the brain and liver, at a time of day similar to constant darkness and at a time similar to the clock (beginning of the dark phase). Similarly, in the case of the trout hypothalamus, the maximum expression of the clock1a and bmal1 genes occurs at the same time of the day, around light-off (López-Patiño et al. Citation2011). This indicates that the expression of these genes and hence the formation of the CLOCK-BMAL complex, is strictly timed and takes place at the beginning of the night. However, in the pituitary gland of sea bass, bmal expression peak occurs a few hours after clock, which may indicate that the expression of these genes may depend on the tissue or the studied paralogs, similar to our research, as well as the expression of bmal in zebrafish (Cermakian et al. Citation2000). It also suggests that the protein products of bmals may have partners other than CLOCK. This is even more likely, as mammalian BMAL1 is able to interact with other factors than CLOCK (Hogenesch et al. Citation1998; Takahata et al. Citation1998). Furthermore, the differential expression of bmal1 and bmal2 mRNA indicates dynamic combinatorial associations with CLOCK in various tissues and at different times of the circadian cycle. However, the levels of the respective proteins may vary in different phases or amplitudes. The two BMAL proteins may also differ in their association potential with the CLOCK and their transactivation capacity, suggesting that the resulting complexes may affect different target genes depending on the time of the circadian cycle (Cermakian et al. Citation2000).
In conclusion, we report expression of several clock genes in the brain, pituitary gland, retina, heart, and liver of the common carp. We found that the diurnal changes in the expression of individual genes are tissue/organ dependent, and for some genes they also vary by gene subtype. However, due to the analysis carried out at 4 time points of the day, it was not possible to confirm that the presented changes are of the nature of rhythms. For this purpose, it would be necessary to conduct experiments at additional time points of the day. The endogenously regulated expression of the clock in the retina highlights the importance of this organ as one of the central oscillators in fish. These results provide information necessary for a better understanding of the organization and functioning of the fish molecular clock. The research conducted also confirms the presence of local clocks in various central and peripheral tissues of the carp. Moreover, in fish, unlike mammals, it seems that the time-varying expression of individual genes in different tissues allows for a diverse and tissue-specific response to secure oscillations with variable phase and period.
Acknowledgements
The authors thank the reviewers for their critical and constructive suggestions and Dr. Niedharsan Pooranachandran (Jagiellonian University) for the linguistic revision of the manuscript.
Disclosure statement
No potential conflict of interest was reported by the authors.
Additional information
Funding
References
- Amaral IP, Johnston IA. 2012. Circadian expression of clock and putative clock-controlled genes in skeletal muscle of the zebrafish. Am J Physiol Regul Integr Comp Physiol. 302:R193–R206. doi:10.1152/ajpregu.00367.2011.
- Betancor MB, McStay E, Minghetti M, Migaud H, Tocher DR, Davie A. 2014. Daily rhythms in expression of genes of hepatic lipid metabolism in Atlantic salmon (Salmo salar L.). PLoS One. 9:e106739. doi:10.1371/journal.pone.0106739.
- Bloch G, Barnes BM, Gerkema MP, Helm B. 2013. Animal activity around the clock with no overt circadian rhythms: patterns, mechanisms and adaptive value. Proc Biol Sci. 280:20130019. doi:10.1098/rspb.2013.0019.
- Block G, Geusz M, Khalsa S, Michel S, Whitmore D. 1995. Cellular analysis of a molluscan retinal biological clock. Ciba Found Symp. 183:51–66. doi:10.1002/9780470514597.ch4.
- Cahill GM. 2002. Clock mechanisms in zebrafish. Cell Tissue Res. 309:27–34. doi:10.1007/s00441-002-0570-7.
- Cermakian N, Whitmore D, Foulkes NS, Sassone-Corsi P. 2000. Asynchronous oscillations of two zebrafish CLOCK partners reveal differential clock control and function. Proc Natl Acad Sci U S A. 97:4339–44. doi:10.1073/pnas.97.8.4339.
- Davie A, Minghetti M, Migaud H. 2009. Seasonal variations in clock-gene expression in Atlantic Salmon (Salmo salar). Chronobiol Int. 26:379–95. doi:10.1080/07420520902820947.
- Del Pozo A, Montoya A, Vera LM, Sánchez JA, Sánchez-Vázquez FJ. 2012a. Daily rhythms of clock gene expression, glycaemia and digestive physiology in diurnal/nocturnal European seabass. Physiol Behav. 106:446–50. doi:10.1016/j.physbeh.2012.03.006.
- Del Pozo A, Sanchez-Ferez JA, Sanchez-Vazquez FJ. 2011. Circadian rhythms of self-feeding and locomotor activity in zebrafish (Danio rerio). Chronobiol Int. 28:39–47. doi:10.3109/07420528.2010.530728.
- Del Pozo A, Vera LM, Sánchez JA, Sánchez-Vázquez FJ. 2012b. Molecular cloning, tissue distribution and daily expression of cry1 and cry2 clock genes in European seabass (Dicentrarchus labrax). Comp Biochem Physiol A. 163:364–71. doi:10.1016/j.cbpa.2012.07.004.
- Doyle S, Menaker M. 2007. Circadian photoreception in vertebrates. Cold Spring Harb Symp Quant Biol. 72:499–508. doi:10.1101/sqb.2007.72.003.
- Falcón J, Besseau L, Magnanou E, Herrero MJ, Nagai M, Boeuf G. 2011. Melatonin, the time keeper: biosynthesis and effects in fish. Cybium. 35:3–18 doi:10.26028/cybium/2011-351-001.
- Falcón J, Migaud H, Muñoz-Cueto JA, Carrillo M. 2010. Current knowledge on the melatonin system in teleost fish. Gen Comp Endocrinol. 165:469–82. doi:10.1016/j.ygcen.2009.04.026.
- Hernández-Pérez J, Míguez JM, Naderi F, Soengas JL, López-Patiño MA. 2017. Influence of light and food on the circadian clock in liver of rainbow trout, Oncorhynchus mykiss. Chronobiol Int. 34:1259–72. doi:10.1080/07420528.2017.1361435.
- Herrero MJ, Lepesant JMJ. 2014. Daily and seasonal expression of clock genes in the pituitary of the European sea bass (Dicentrarchus labrax). Gen Comp Endocrinol. 208:30–38. doi:10.1016/j.ygcen.2014.08.002.
- Hirayama J, Fukuda I, Ishikawa T, Kobayashi Y, Todo T, Fukuda I, Ishikawa T, Kobayashi Y, Todo T, and Ishikawa T. 2003. New role of zCRY and zPER2 as regulators of sub-cellular distributions of zCLOCK and zBMAL proteins. Nucleic Acids Res. 31:935–43. doi:10.1093/nar/gkg174.
- Hogenesch JB, Gu YZ, Jain S, Bradfield CA. 1998. The basic-helix-loop-helix-PAS orphan MOP3 forms transcriptionally active complexes with circadian and hypoxia factors. Proc Natl Acad Sci U S A. 95:5474–79. doi:10.1073/pnas.95.10.5474.
- Hsu CY, Chuang YC, Chang FC, Chuang HY, Chiou TT, Lee CT. 2021. Disrupted sleep homeostasis and altered expressions of clock genes in rats with chronic lead exposure. Toxics. 9:217. doi:10.3390/toxics9090217.
- Huang TS, Ruoff P, Fjelldal PG. 2010. Diurnal expression of clock genes in pineal gland and brain and plasma levels of melatonin and cortisol in Atlantic salmon parr and smolts. Chronobiol Int. 27:1697–714. doi:10.3109/07420528.2010.514630.
- Hur SP, Takeuchi Y, Itoh H, Uchimura M, Takahashi K, Kang HC, Lee YD, Kim SJ, Takemura A. 2012. Fish sleeping under sandy bottom: interplay of melatonin and clock genes. Gen Comp Endocrinol. 177:37–45. doi:10.1016/j.ygcen.2012.01.007.
- Iuvone PM, Tosini G, Pozdeyev N, Haque R, Klein DC, Chaurasia SS. 2005. Circadian clocks, clock networks, arylalkylamine N-acetyltransferase, and melatonin in the retina. Prog Retin Eye Res. 24:433–56. doi:10.1016/j.preteyeres.2005.01.003.
- Kaneko M, Hernandez-Borsetti N, Cahill GM. 2006. Diversity of zebrafish peripheral oscillators revealed by luciferase reporting. Proc Natl Acad Sci U S A. 103:14614–19. doi:10.1073/pnas.0606563103.
- Kobayashi Y, Ishikawa T, Hirayama J, Daiyasu H, Kanai S, Toh H, Fukuda I, Tsujimura T, Terada N, Kamei Y, et al. 2000. Molecular analysis of zebrafish photolyase/cryptochrome family: two types of cryptochromes present in zebrafish. Genes Cells. 5:725–38. doi:10.1046/j.1365-2443.2000.00364.x.
- Lahiri K, Vallone D, Gondi SB, Santoriello C, Dickmeis T, Foulkes NS. 2005. Temperature regulates transcription in the zebrafish circadian clock. PLoS Biol. 3:e351. doi:10.1371/journal.pbio.0030351.
- Lalpekhlui R, Renthlei Z, Trivedi AK. 2022. Molecular expression of clock genes in central and peripheral tissues of white-rumped munia (Lonchura striata). Chronobiol Int. 39:1058–67. doi:10.1080/07420528.2022.2062374.
- López-Patiño MA, Rodríguez-Illamola A, Conde-Sieira M, Soengas JL, Míguez JM. 2011. Daily rhythmic expression patterns of Clock1a, Bmal1, and Per1 genes in retina and hypothalamus of the rainbow trout, Oncorhynchus mykiss. Chronobiol Int. 28:381–89. doi:10.3109/07420528.2011.566398.
- Maywood ES, O’Neill JS, Reddy AB, Chesham JE, Prosser HM, Kyriacou CP, Godinho SI, Nolan PM, Hastings MH. 2007. Genetic and molecular analysis of the central and peripheral circadian clockwork of mice. Cold Spring Harb Symp Quant Biol. 72:85–94. doi:10.1101/sqb.2007.72.005.
- Menaker M, Moreira LF, Tosini G, Braz J. 1997. Evolution of circadian organization in vertebrates. Med Biol Res. 30:305–13. doi:10.1590/S0100-879X1997000300003.
- Mohawk JA, Green CB, Takahashi JS. 2012. Central and peripheral circadian clocks in mammals. Annu Rev Neurosci. 35:445–62. doi:10.1146/annurev-neuro-060909-153128.
- Okamura H, Yamaguchi S, Yagita K. 2002. Molecular machinery of the circadian clock in mammals. Cell Tissue Res. 309:47–56. doi:10.1007/s00441-002-0572-5.
- Panda S, Hogenesch JB, Kay SA. 2002. Circadian rhythms from flies to human. Nature. 417:329–35. doi:10.1038/417329a.
- Park JG, Park YJ, Sugama N, Kim SJ, Takemura A. 2007. Molecular cloning and daily variations of the Period gene in a reef fish Siganus guttatus. J Comp Physiol A. 193:403–11. doi:10.1007/s00359-006-0194-6.
- Partch CL, Green CB, Takahashi JS. 2014. Molecular architecture of the mammalian circadian clock. Trends Cell Biol. 24:90–99. doi:10.1016/j.tcb.2013.07.002.
- Peschel N, Helfrich-Förster C. 2011. Setting the clock–by nature: circadian rhythm in the fruitfly Drosophila melanogaster. FEBS Lett. 585:1435–42. doi:10.1016/j.febslet.2011.02.028.
- Plautz JD, Kaneko M, Hall JC, Kay SA. 1997. Independent photoreceptive circadian clocks throughout Drosophila. Science. 278:1632–35. doi:10.1126/science.278.5343.1632.
- Postlethwait JH, Yan YL, Gates MA, Horne S, Amores A, Brownlie A, Donovan A, Egan ES, Force A, Gong Z, et al. 1998. Vertebrate genome evolution and the zebrafish gene map. Nat Genet. 18:345–49. doi:10.1038/ng0498-345.
- Potter GD, Skene DJ, Arendt J, Cade JE, Grant PJ, Hardie LJ. 2016. Circadian rhythm and sleep disruption: causes, metabolic consequences, and countermeasures. Endocr Rev. 37:584–608. doi:10.1210/er.2016-1083.
- Renthlei Z, Gurumayum T, Borah BK, Trivedi AK. 2019. Daily expression of clock genes in central and peripheral tissues of tree sparrow (Passer montanus). Chronobiol Int. 36:110–21. doi:10.1080/07420528.2018.1523185.
- Sánchez JA, Madrid JA, Sánchez-Vázquez FJ. 2010. Molecular cloning, tissue distribution, and daily rhythms of expression of per1 gene in European sea bass (Dicentrarchus labrax). Chronobiol Int. 27:19–33. doi:10.3109/07420520903398633.
- Sánchez JA, Sánchez-Vázquez FJ. 2009. Feeding entrainment of daily rhythms of locomotor activity and clock gene expression in zebrafish brain. Chronobiol Int. 26:1120–35. doi:10.3109/07420520903232092.
- Singh D, Rani S, Kumar V. 2013. Daily expression of six clock genes in central and peripheral tissues of a night-migratory songbird: evidence for tissue-specific circadian timing. Chronobiol Int. 30:1208–17. doi:10.3109/07420528.2013.810632.
- Takahashi JS, Hong HK, Ko CH, McDearmon EL. 2008. The genetics of mammalian circadian order and disorder: implications for physiology and disease. Nat Rev Genet. 9:764–75. doi:10.1038/nrg2430.
- Takahata S, Sogawa K, Kobayashi A, Ema M, Mimura J, Ozaki N, Fujii-Kuriyama Y. 1998. Transcriptionally active heterodimer formation of an Arnt-like PAS protein, Arnt3, with HIF-1a, HLF, and clock. Biochem Biophys Res Commun. 248:789–94. doi:10.1006/bbrc.1998.9012.
- Takata M, Burioka N, Ohdo S, Takane H, Terazono H, Miyata M, Sako T, Suyama H, Fukuoka Y, Tomita K, et al. 2002. Daily expression of mRNAs for the mammalian clock genes Per2 and Clock in mouse suprachiasmatic nuclei and liver and human peripheral blood mononuclear cells. Jpn J Pharmacol. 90:263–69. doi:10.1254/jjp.90.263.
- Tamai TK, Carr AJ, Whitmore D. 2005. Zebrafish circadian clocks: cells that see light. Biochem Soc Trans. 33:962–66. doi:10.1042/BST0330962.
- Vallone D, Lahiri K, Dickmeis T, Foulkes NS. 2005. Zebrafish cell clocks feel the heat and see the light! Zebrafish. 2:171–87. doi:10.1089/zeb.2005.2.171.
- Velarde E, Haque R, Iuvone PM, Azpeleta C, Alonso-Gómez AL, Delgado MJ. 2009. Circadian clock genes of goldfish, Carassius auratus: cDNA cloning and rhythmic expression of period and cryptochrome transcripts in retina, liver, and gut. J Biol Rhythms. 24:104–13. doi:10.1177/0748730408329901.
- Velingkaar N, Mezhnina V, Poe A, Makwana K, Tulsian R, Kondratov RV. 2020. Reduced caloric intake and periodic fasting independently contribute to metabolic effects of caloric restriction. Aging Cell. 19:e13138. doi:10.1111/acel.13138.
- Vera LM, Migaud H. 2016. Hydrogen peroxide treatment in Atlantic salmon induces stress and detoxification response in a daily manner. Chronobiol Int. 33:530–42. doi:10.3109/07420528.2015.1131164.
- Wang H. 2008. Comparative analysis of teleost fish genomes reveals preservation of different ancient clock duplicates in different fishes. Mar Genomics. 1:69–78. doi:10.1016/j.margen.2008.06.003
- Wang H. 2009. Comparative genomic analysis of teleost fish bmal genes. Genetica. 136:149–61. doi:10.1007/s10709-008-9328-9.
- Whitmore D, Foulkes NS, Strahle U, Sassone-Corsi P. 1998. Zebrafish Clock rhythmic expression reveals independent peripheral circadian oscillators. Nat Neurosci. 1:701–07. doi:10.1038/3703.
- Wu Y, Tang D, Liu N, Xiong W, Huang H, Li Y, Ma Z, Zhao H, Chen P, Qi X, et al. 2017. Reciprocal regulation between the circadian clock and hypoxia signaling at the genome level in mammals. Cell Metab. 25:73–85. doi:10.1016/j.cmet.2016.09.009.
- Zhao Z, Xu H, Liu Y, Mu L, Xiao J, Zhao H. 2015. Diurnal expression of the Per2 gene and protein in the lateral habenular nucleus. Int J Mol Sci. 16:16740–49. doi:10.3390/ijms160816740.
- Zhdanova IV, Yu L, Lopez-Patiño M, Shang E, Kishi S, Guelin E. 2008. Aging of the circadian system in zebrafish and the effects of melatonin on sleep and cognitive performance. Brain Res Bull. 75:433–41. doi:10.1016/j.brainresbull.2007.10.053.
