
ABSTRACT
This cross-sectional study aimed to elucidate the association between disruption of circadian activity rhythms and obesity-related indices. This study included 69 older participants (male, n = 36; female, n = 33), and disruption of circadian activity rhythms in daily life was assessed using the cosinor method based on physical activity data. The daily physical activity data were fitted to a cosine curve to estimate the peak phase (acrophase), and the difference in the peak phase (time) for each day was determined. The standard deviation (SD) of the mean peak phase differences over 6 days was obtained. The higher the SD value, the more disturbed the circadian rhythm of activity. Based on the calculated values, the samples were divided into tertiles (small, medium, and large). A significant positive correlation was found between Log SD and body fat percentage on the disruption of circadian activity rhythms and obesity-related indices. In addition, positive associations were observed among body mass, body mass index, and Log SD. However, these associations were not observed in women. These results suggest that disruption of circadian activity rhythms is associated with obesity-related indices and may differ according to sex.
Introduction
Circadian rhythms, with one cycle per day, are recognized in behavioral patterns, such as eating and sleeping, and various physiological functions, such as glucose and lipid metabolisms, and play an important role in maintaining homeostasis. They are oscillated by an internal biological clock that exists within cells. Therefore, many studies have widely reported that when the internal clock is disrupted, glucose and lipid metabolisms are disturbed, increasing the risk of obesity and type 2 diabetes (Chaput et al. Citation2023; Doi Citation2012; Froy Citation2012; Li et al. Citation2022; Noh Citation2018; Turek et al. Citation2005). In particular, individuals who repeatedly work rotating shifts, such as in shift-based work, have irregular life rhythms, such as light stimulation and feeding, which can disrupt the internal clock. Shift workers are more susceptible to obesity and metabolic diseases and have a higher risk of cardiovascular events (Pan et al. Citation2011; Suwazono et al. Citation2006, Citation2008). In addition, an association between the genotype of a group of clock genes that constitute the human internal clock and the prevalence of obesity has been reported. In particular, haplotypes of CLOCK, a core clock gene, are associated with the prevalence of obesity and metabolic syndrome (Scott et al. Citation2008). In other words, individuals with genetically disturbed or easily disturbed biological clock functions are more likely to develop obesity. Therefore, regular lifestyle and proper regulation of circadian rhythms are important for preventing metabolic diseases, such as obesity.
Circadian rhythms in humans have been studied using blood, follicle cells, and body temperature (Hasselberg et al. Citation2013; Takahashi et al. Citation2018; Wehrens et al. Citation2017). These methods are burdensome to individuals because they require sequential measurement of responses at different times of the day. Accelerometers can be worn from waking up to bedtime for approximately 1 week (including holidays) to provide an objective and continuous assessment of physical activity in the context of daily life (Atienza et al. Citation2011). Most studies of physical activity using accelerometers have used a summary measure averaged over the entire wear period (Manns et al. Citation2015). However, accelerometer data are recorded at a significantly higher resolution and may be suitable for assessing circadian rhythms. A previous study showed an association between circadian activity rhythms and brain function in older adults, with later peak times of physical activity being associated with increased dementia (Tranah et al. Citation2011). A previous study also examined the degree of similarity (interdaily stability) in the shape of each physical activity cycle and demonstrated an association between irregularities in activity rhythms and obesity and metabolic syndrome (Li et al. Citation2022; Sohail et al. Citation2015). However, interdaily stability was not assessed for 24-h rhythmicity as in the cosinor analysis. It is important to examine the rhythmicity of the 24-h period when assessing disturbances in circadian activity rhythms. However, the effects of the disruption of daily physical activity rhythms on health indicators remain unclear. Furthermore, because daily physical activity rhythms vary with individual lifestyle and social environment (Evenson et al. Citation2012; Sallis et al. Citation2006), it is possible that human physical activity rhythms more closely reflect real-life circadian rhythm disruption. Therefore, it is important to study the rhythms of physical activity in greater detail.
Therefore, this study aimed to examine the association between disruption of circadian activity rhythms and obesity. As part of a cross-sectional study of older participants, this study was conducted to test the hypothesis that disruption of circadian activity rhythms, objectively measured using accelerometers, is associated with obesity.
Materials and methods
Participants
This study comprised 69 healthy older adults (male, n = 36; female, n = 33, age range, 65–82 years) who did not smoke or exercise regularly and had no medical conditions on physical examination. The participants’ characteristics are presented in . The exclusion criteria for this study were those diagnosed with diabetes and dyslipidemia through physical examination and on medication, those already participating in another research intervention program, or those with missing accelerometer data. In total, 14 and 17 male and female participants, respectively, met the exclusion criteria. The reason for exclusion was missing accelerometer data (). None of the participants had difficulties with mobility or activities of daily living. Prior to this study, all the participants received a thorough explanation of the study and its safety. Written informed consent was obtained from all the participants. The study protocol conformed to the Declaration of Helsinki and was approved by the Ethics Committee for Humans at Waseda University (approval no. 2018-031).
Figure 1. Flow diagram of the study participants.
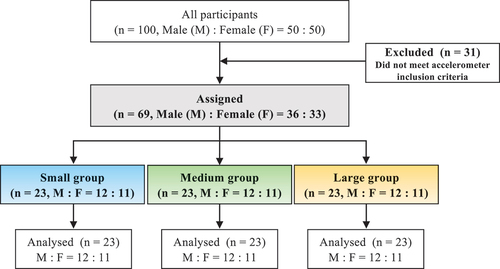
Table 1. Characteristics of study participants.
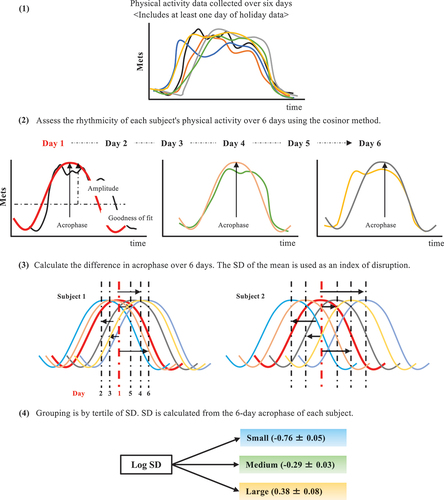
Figure 2. Circadian activity rhythm assessment and grouping. (1) Each participant is asked to wear an accelerometer for at least 6 consecutive days (including at least 1 holiday). (2) the cosinor method is used to evaluate the circadian activity rhythm from the obtained accelerometer data. The acrophase (peak time), amplitude, and goodness of fit (rhythmicity) of the normalized data are determined using the single cosinor method. For disruption of circadian activity rhythms, the peak phase (acrophase) is first estimated by fitting the daily physical activity data to a cosine curve. (3) the difference in the peak phase (time) is then determined up to day 6, using the acrophase on day 1 as the reference, as the difference between days 1 and 2 and between days 1 and 3. The standard deviation (SD) of the mean 6-day difference in the peak phase is calculated. (4) the higher the SD value, the more disrupted the circadian activity rhythm. SD is used after logarithmic transformation (Log SD). SD, standard deviation.
Study design
This was a cross-sectional study. Using a triaxial accelerometer, we assessed the disruption of circadian activity rhythms and examined its association with obesity. Grouping was performed according to the tertile of disruption in each participant’s circadian activity rhythm (small, n = 23; medium, n = 23; and large, n = 23) (). We also examined the effects of sex on the disruption of circadian activity rhythms. Each participant was instructed to record their waking and sleeping times.
Circadian activity rhythm
A triaxial accelerometer (Active-style Pro HJA-750C; Omron Healthcare Co., Ltd., Kyoto, Japan) was used to assess physical and circadian activity rhythms in daily life. All participants were instructed to wear a triaxial accelerometer for 1 week. Accelerometers were worn every day, from morning to night, except during showering and bedtime. Data were used if the participants wore the device for at least 10 h (600 min) per day for at least 6 consecutive days (including at least 1 holiday). The data recording interval was set to 60 s. All minute records of ≥ 3 metabolic equivalents were classified as moderate-to-vigorous physical activity (MVPA) (Kim et al. Citation2022).
We assessed the circadian activity rhythm based on accelerometer data using the cosinor method (Refinetti et al. Citation2007). The acrophase (peak time), amplitude, and goodness of fit (rhythmicity) of the normalized data were determined using the single cosinor method (Acro.exe version 3.5). Rhythmicity was observed in all physical activity data. To evaluate disruption of circadian activity rhythms, we initially estimated the peak phase (acrophase) by fitting the daily physical activity data to a cosine curve. We then calculated the difference in the peak phase (time) over 6 days, with the acrophase on day 1 as the reference point, determining differences between days 1 and 2 and between days 1 and 3. We further computed the standard deviation (SD) of the mean 6-day difference in the peak phase. A higher SD value indicated greater circadian activity rhythm disruption, as depicted in . These SD values were logarithmically transformed (Log SD) and utilized in the analysis.
Chronotype and energy intake
To determine participants’ chronotype (morningness to eveningness), the Morningness-Eveningness Questionnaire (MEQ), a lifestyle survey, was administered. Scores ranged from 16 to 86 points. The participants were divided into the following three chronotype groups: morningness (59–86), intermediate (42–58), and eveningness (16–41) (Horne and Ostberg Citation1976).
The Food Frequency Questionnaire was used to assess the participants’ dietary and nutritional intake. The average daily energy intake was depicted as kilocalories per day (kcal/day) (Kim et al. Citation2021).
Anthropometry and body composition
Body mass (kg) and height (cm) were measured using a digital scale (Inbody 270; Inbody Inc., Tokyo, Japan) and a wall-mounted stadiometer (YS-OA; As One Corp., Osaka, Japan), respectively. Body mass index (BMI) was calculated as weight (kg) divided by height squared (m). Body fat percentage (%Fat) was measured using bioelectrical impedance analysis (InBody 270; InBody Inc., Tokyo, Japan). Body mass (BM), BMI, and %Fat were used after logarithmic transformation (Log BM, Log BMI, Log %Fat).
Statistical analysis
All measurements are expressed as means ± standard errors. One-way analysis of variance was used to compare obesity-related indices between groups. Pearson’s product-moment and partial correlation coefficients were calculated between circadian activity rhythms and obesity-related indices, with sex as a control variable. A multiple linear regression analysis was performed using %Fat, BMI, and body mass as the dependent variables. SD, BMI, and body mass were subjected to logarithmic transformation to approximate a normal distribution, enhancing statistical power. %Fat was used after arcsine transformation. All statistical procedures were performed using PASW Statistics 28.0, with a significance level of <5%.
Results
Characteristics of study participants
No significant differences were found among the groups for any of the items, including energy intake, wake time, bedtime, and MEQ score ().
Comparison of circadian activity rhythms
The comparison of the disruption of circadian activity rhythms showed significant differences among the groups in Log SD (All, F (2,66) = 99.973, p < 0.001, Male, F (2,33) = 39.980, p < 0.001, Female, F (2,30) = 95.920, p < 0.001) (, Figures S1–S3). However, there were no significant differences among the groups in terms of the amplitude, acrophase, and goodness of fit. In contrast, only amplitude showed a different trend among the groups (, all = 69, p = 0.067).
Figure 3. Comparison of circadian activity rhythm disruption. SD is used after logarithmic transformation (Log SD). SD, standard deviation. ***p < 0.001 compared with the Log SD among groups (Tukey).
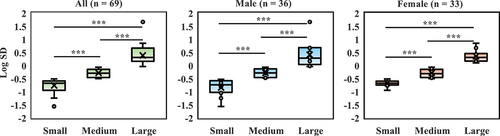
Table 2. Amplitude, acrophase, and goodness of fit of circadian activity rhythm.
Comparison of obesity-related indices
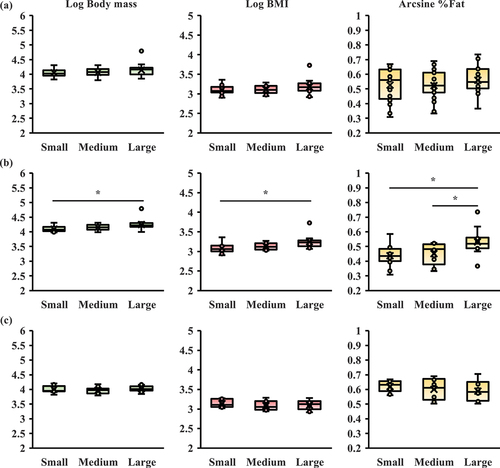
No significant differences were found among the groups in terms of body mass, BMI, and %Fat (). When the results were examined according to sex, significant differences were found between groups in body mass (F (2,33) = 3.911, p = 0.030) and %Fat (F (2,33) = 4.907, p = 0.014) only in male participants. Body mass was significantly lower in the small group than in the large group (, p < 0.05). In addition, %Fat was significantly lower in the small and medium groups than in the large group (; p < 0.05). However, no significant differences were noted in BMI among the groups. Moreover, in female participants, there was no significant difference between the groups ().
Figure 4. Comparison of obesity-related indices among groups. (a) All participants (n = 69), (b) men participants (n = 39), (c) women participants (n = 33). BMI, body mass index; %Fat, body fat percentage. Body mass and BMI are used after logarithmic transformation (Log BM, Log BMI). %Fat is used after arcsine transformation (arcsine %Fat). *p < 0.05 compared with the obesity-related indices among groups (Tukey).
Association between circadian activity rhythms and obesity-related indices
The association between circadian activity rhythms and obesity-related indices showed a significant positive association between Log SD and %Fat (). Additionally, a positive association was observed among body mass, BMI, and Log SD (). However, this association was not observed in female participants (, ).
Figure 5. The association between disruption of circadian activity rhythms (Log SD) and %Fat. For all participants (n = 69), sex is the controlling variable of partial correlation. Male (n = 36) and female participants (n = 33) calculate Pearson’s product-moment correlation coefficient. SD is used after logarithmic transformation (Log SD). %Fat is used after arcsine transformation (arcsine %Fat).
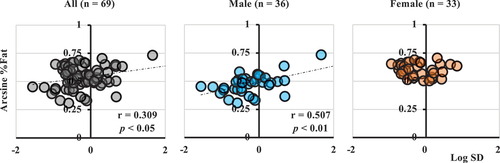
Table 3. The relationship between circadian activity rhythms and obesity-related indices and physical activity.
Multiple linear regression analysis for %Fat, body mass index, and body mass
Log SD was significantly correlated with %Fat, BMI, and body mass. However, MVPA and step count were also significantly correlated with %Fat and BMI, except for body mass (). Therefore, we used %Fat, BMI, and body mass as the dependent variables to perform a multiple linear regression analysis. The results showed that Log SD was a significant, positive, and independent predictor of %Fat, BMI, and body mass, even when MVPA (model 1) or step count (model 2) was included as an independent variable ().
Table 4. Multiple linear regression analysis for the %Fat, BMI, and body mass.
Discussion
To the best of our knowledge, this is the first study to assess circadian disruption using an accelerometer and examine its association with obesity-related indices. A novel finding of this study is that disrupted circadian activity rhythms are associated with obesity. The association between disrupted circadian activity rhythms and obesity differed according to sex, with a positive association between disrupted circadian activity rhythms and obesity-related indices seen only in men. These findings suggest that disruption of circadian activity rhythms in older men may contribute to the development of obesity.
Aligning the rhythm of physical activity in daily life is important for preventing obesity. Physical activity is important for preventing and improving metabolic diseases, such as obesity and diabetes. Therefore, physical activity guidelines recommend the appropriate amount and duration of physical activity (Bull et al. Citation2020; Piercy et al. Citation2018). However, recently, individuals of all ages are forced to live in a 24-h society that has brought about lifestyle changes and deviates from the natural cycles associated with the Earth’s rotation cycle. Behind this change in lifestyle is thought to be the influence of society as a whole becoming more night-oriented because of a 24-h society, such as the increase in the number of stores open all night and the proliferation of smartphones. The discrepancy between environmental time and body clocks is constantly occurring in a wide range of generations. However, most previous studies investigating the association between circadian disruption and metabolic diseases, such as obesity and diabetes, have examined shift workers, such as those who perform shift work (Gan et al. Citation2015; Grundy et al. Citation2017; Guo et al. Citation2013; Tenkanen et al. Citation1997). Shift work is associated with an increased risk of several diseases, including obesity, diabetes, and cardiovascular diseases, and sleep and gastrointestinal disorders (Gan et al. Citation2015; Grundy et al. Citation2017; Guo et al. Citation2013; Tenkanen et al. Citation1997). However, there is limited existing evidence to support the association between metabolic diseases, such as obesity and diabetes, and disruption of circadian activity rhythm in daily life. In particular, physical activity in daily life may vary according to individual characteristics (sex, age) and social and physical environments, depending on the time of day and life situations (Evenson et al. Citation2012; Sallis et al. Citation2006). Therefore, daily physical activity may better reflect disruptions in an individual’s biological rhythms. However, circadian activity rhythms have rarely been considered in the efforts to maintain and promote health. To the best of our knowledge, this is the first study focusing on disruption of circadian activity rhythm and its association with obesity-related indicators. These results indicate that circadian disruption may be associated with obesity, especially in men. Therefore, it may be important to align circadian activity rhythms in daily life to prevent and treat obesity. However, no association between disrupted circadian activity rhythms and obesity-related indices was observed in women, and more detailed studies are required in the future.
Physiological responses to circadian disruption vary according to sex (Walton et al. Citation2022). In a previous human study, circadian disruption by a 12-h phase shift increased circulating leptin in men but decrease leptin with an increase in ghrelin in women (Qian et al. Citation2019). These findings suggest a possible mechanism for the sex differences in weight gain due to shift work. Moreover, the disruption of circadian activity rhythm in this study differed according to sex, being smaller in women than in men (Log SD, men: −1.56–1.66, women: −0.94–0.84). However, the exact mechanism of the association between the disruption of circadian activity rhythms and obesity is unclear, although the disruption of circadian rhythms is thought to be one of the factors. Previous studies have shown that circadian disruption is associated with obesity (Doi Citation2012; Suwazono et al. Citation2006). In other words, the disruption of circadian activity rhythms may lead to the disruption of circadian rhythms, which in turn may lead to the development of obesity. However, the present study focuses on human physical activity and examines its association with obesity-related indices by assessing rhythm disturbances. Therefore, it remains unclear whether disruption in circadian activity rhythms can directly influence variations in internal circadian rhythms. Further comprehensive research is warranted to explore this aspect in greater detail.
Men are more susceptible to disrupted circadian rhythms than women. A previous study demonstrated that the amount of physical activity varied according to sex and age (Varma et al. Citation2017). Generally, physical activity is higher in men than in women from adolescence to early adulthood (Deaner et al. Citation2012; Rosenfeld Citation2017). Conversely, the decline in physical activity is more pronounced in men from middle to old age than women, and the variability of the decline in physical activity is greater in old age in men than in women (Varma et al. Citation2017). Furthermore, the present study showed a negative correlation among Log SD, number of steps, and MVPA only in men. Therefore, the association between circadian rhythm disruption and obesity-related indicators may have yielded different results depending on sex. This novel finding highlights the importance of considering sex differences to better understand the association between circadian disruption and obesity-related indicators. In addition, because the circadian rhythms in this study were assessed using physical activity data, the influence of physical activity on the results is undeniable. In this study, steps and MVPA were negatively correlated with %Fat and BMI. Therefore, we examined the association between Log SD and obesity using multiple linear regression analysis. These results indicate that Log SD may be an independent predictor of %Fat, BMI, and body mass.
This study has some limitations. This study was conducted among older adults. Similar results may not be obtained for younger individuals or children with different lifestyles. Therefore, future studies should consider life stages. Most older adults in this study were healthy individuals who did not meet the criteria for obesity. In particular, female participants may not have been associated with circadian activity rhythms because of the small inter-individual variation in %Fat. Therefore, it is necessary to investigate the association between the disruption circadian activity rhythms and obesity-related indices in a wider range of human participants, including obese individuals, to clarify the efficacy of circadian rhythms. Abnormalities in sleep variability (sleep quantity) and regularity (sleep timing) have been reported as contributors to obesity and its associated adverse effects on cardiometabolic health (Lunsford-Avery et al. Citation2018). However, because the sleep patterns examined in this study represent only 1 day of data for each participant, it was not possible to examine the association between sleep and obesity. Therefore, the effects of sleep variability and regularity should be considered in future studies. The circadian rhythm of activity indicated by the accelerometer is not unimodal. Therefore, while the validity of the rhythmic nature of the acrophase study used in this study may be a subject of debate, the cosinor method used in this study is one of the most widely used methods for evaluating biological rhythms, and its validity has been demonstrated. Therefore, evaluation of the circadian activity rhythm presented in this study is considered valid. Consequently, future research including evaluation of circadian activity rhythm should consider not only acrophase but also orthophase. Finally, the circadian activity rhythm used in this study was evaluated using an accelerometer, which cannot represent internal circadian rhythms. However, if the association between internal circadian rhythm and circadian activity rhythm is clarified in the future, it may be used as a new index of biological rhythm.
Conclusions
Disruptions in circadian activity rhythms in older men are associated with obesity-related indicators, suggesting that they may contribute to increased obesity risk. Future studies should investigate whether interventions affecting circadian activity rhythms (physical activity, diet, and sleep) can reduce the risk of obesity in older adults.
Authors’ contributions
The authors’ contributions were as follows: H.-K. K., and Y.T., conceptualization; H.-K.K., Y.T., and Y.Y., data curation; H.-K.K., Y.T., Y,Y., and M.T., formal analysis; H.-K.K. and S.S., funding acquisition; H.-K.K. and M.T., investigation; H.-K.K., Y.Y., Y.T., R.O., M.T., and S.S., study methodology; H.-K.K. and S.S., project administration; S.S. and H.-K.K., project resources; S.S., supervision; H.-K.K., and Y.Y., visualization; H.-K.K., writing – original draft; Y.T., R.O., Y.Y., M.T., and S.S., writing, review, and editing. All authors have read and approved the final manuscript for publication.
Supplemental Material
Download PDF (141.4 KB)Acknowledgments
We wish to thank all of the investigators and volunteers who participated in this study.
Disclosure statement
No potential conflict of interest was reported by the author(s).
Data availability statement
The data supporting the results of this study are available upon request from the corresponding author, Hyeon-Ki Kim. The data are not publicly available due to restrictions that include information that could compromise the privacy of research participants.
Supplementary material
Supplemental data for this article can be accessed online at https://doi.org/10.1080/07420528.2023.2285314.
Additional information
Funding
References
- Atienza AA, Moser RP, Perna F, Dodd K, Ballard-Barbash R, Troiano RP, Berrigan D. 2011. Self-reported and objectively measured activity related to biomarkers using NHANES. Med Sci Sports Exerc. 43:815–821. doi:10.1249/MSS.0b013e3181fdfc32.
- Bull FC, Al-Ansari SS, Biddle S, Borodulin K, Buman MP, Cardon G, Carty C, Chaput JP, Chastin S, Chou R, et al. 2020. World Health Organization 2020 guidelines on physical activity and sedentary behaviour. Br J Sports Med. 54:1451–1462. doi:10.1136/bjsports-2020-102955.
- Chaput JP, McHill AW, Cox RC, Broussard JL, Dutil C, da Costa BGG, Sampasa-Kanyinga H, Wright KP Jr. 2023. The role of insufficient sleep and circadian misalignment in obesity. Nat Rev Endocrinol. 19:82–97. doi:10.1038/s41574-022-00747-7.
- Deaner RO, Geary DC, Puts DA, Ham SA, Kruger J, Fles E, Winegard B, Grandis T, Hayward M. 2012. A sex difference in the predisposition for physical competition: males play sports much more than females even in the contemporary U.S. PLoS One. 7:e49168. doi:10.1371/journal.pone.0049168.
- Doi M. 2012. Circadian clock-deficient mice as a tool for exploring disease etiology. Biol Pharm Bull. 35:1385–1391. doi:10.1248/bpb.b12-00364.
- Evenson KR, Buchner DM, Morland KB. 2012. Objective measurement of physical activity and sedentary behavior among US adults aged 60 years or older. Prev Chronic Dis. 9:E26. doi:10.5888/pcd9.110109.
- Froy O. 2012. Circadian rhythms and obesity in mammals. ISRN Obes. 2012:437198. doi:10.5402/2012/437198.
- Gan Y, Yang C, Tong X, Sun H, Cong Y, Yin X, Li L, Cao S, Dong X, Gong Y, et al. 2015. Shift work and diabetes mellitus: a meta-analysis of observational studies. Occup Environ Med. 72:72–78. doi:10.1136/oemed-2014-102150.
- Grundy A, Cotterchio M, Kirsh VA, Nadalin V, Lightfoot N, Kreiger N. 2017. Rotating shift work associated with obesity in men from northeastern Ontario. Health Promot Chronic Dis Prev Can. 37:238–247. doi:10.24095/hpcdp.37.8.02.
- Guo Y, Liu Y, Huang X, Rong Y, He M, Wang Y, Yuan J, Wu T, Chen W, Behrens T. 2013. The effects of shift work on sleeping quality, hypertension and diabetes in retired workers. PLoS ONE. 8:e71107. doi:10.1371/journal.pone.0071107.
- Hasselberg MJ, McMahon J, Parker K. 2013. The validity, reliability, and utility of the iButton® for measurement of body temperature circadian rhythms in sleep/wake research. Sleep Med. 14:5–11. doi:10.1016/j.sleep.2010.12.011.
- Horne JA, Ostberg O. 1976. A self-assessment questionnaire to determine morningness-eveningness in human circadian rhythms. Int J Chronobiol. 4:97–110.
- Kim HK, Chijiki H, Fukazawa M, Okubo J, Ozaki M, Nanba T, Higashi S, Shioyama M, Takahashi M, Nakaoka T, et al. 2021. Supplementation of protein at breakfast rather than at dinner and lunch is effective on skeletal muscle mass in older adults. Front Nutr. 8:797004. doi:10.3389/fnut.2021.797004.
- Kim HK, Furuhashi S, Takahashi M, Chijiki H, Nanba T, Inami T, Radak Z, Sakamoto S, Shibata S. 2022. Late-afternoon endurance exercise is more effective than morning endurance exercise at improving 24-h glucose and blood lipid levels. Front Endocrinol (Lausanne). 13:957239. doi:10.3389/fendo.2022.957239.
- Li J, Vungarala S, Somers VK, Di J, Lopez-Jimenez F, Covassin N. 2022. Rest-activity rhythm is associated with obesity phenotypes: a cross-sectional analysis. Front Endocrinol (Lausanne). 13:907360. doi:10.3389/fendo.2022.907360.
- Lunsford-Avery JR, Engelhard MM, Navar AM, Kollins SH. 2018. Validation of the sleep regularity index in older adults and associations with cardiometabolic risk. Sci Rep. 8:14158. doi:10.1038/s41598-018-32402-5.
- Manns P, Ezeugwu V, Armijo-Olivo S, Vallance J, Healy GN. 2015. Accelerometer-derived pattern of sedentary and physical activity time in persons with mobility disability: national health and nutrition examination survey 2003 to 2006. J Am Geriatr Soc. 63:1314–1323. doi:10.1111/jgs.13490.
- Noh J. 2018. The effect of circadian and sleep disruptions on obesity risk. J Obes Metab Syndr. 27:78–83. doi:10.7570/jomes.2018.27.2.78.
- Pan A, Schernhammer ES, Sun Q, Hu FB, Groop L. 2011. Rotating night shift work and risk of type 2 diabetes: two prospective cohort studies in women. PLoS Med. 8:e1001141. doi:10.1371/journal.pmed.1001141.
- Piercy KL, Troiano RP, Ballard RM, Carlson SA, Fulton JE, Galuska DA, George SM, Olson RD. 2018. The physical activity guidelines for Americans. JAMA. 320:2020–2028. doi:10.1001/jama.2018.14854.
- Qian J, Morris CJ, Caputo R, Wang W, Garaulet M, Scheer F. 2019. Sex differences in the circadian misalignment effects on energy regulation. Proc Natl Acad Sci USA. 116:23806–23812. doi:10.1073/pnas.1914003116.
- Refinetti R, Lissen GC, Halberg F. 2007. Procedures for numerical analysis of circadian rhythms. Biol Rhythm Res. 38:275–325. doi:10.1080/09291010600903692.
- Rosenfeld CS. 2017. Sex-dependent differences in voluntary physical activity. J Neurosci Res. 95:279–290. doi:10.1002/jnr.23896.
- Sallis JF, Cervero RB, Ascher W, Henderson KA, Kraft MK, Kerr J. 2006. An ecological approach to creating active living communities. Annu Rev Public Health. 27:297–322. doi:10.1146/annurev.publhealth.27.021405.102100.
- Scott EM, Carter AM, Grant PJ. 2008. Association between polymorphisms in the clock gene, obesity and the metabolic syndrome in man. Int J Obes (Lond). 32:658–662. doi:10.1038/sj.ijo.0803778.
- Sohail S, Yu L, Bennett DA, Buchman AS, Lim AS. 2015. Irregular 24-hour activity rhythms and the metabolic syndrome in older adults. Chronobiol Int. 32:802–813. doi:10.3109/07420528.2015.1041597.
- Suwazono Y, Dochi M, Sakata K, Okubo Y, Oishi M, Tanaka K, Kobayashi E, Kido T, Nogawa K. 2008. A longitudinal study on the effect of shift work on weight gain in male Japanese workers. Obes (Silver Spring). 16:1887–1893. doi:10.1038/oby.2008.298.
- Suwazono Y, Sakata K, Okubo Y, Harada H, Oishi M, Kobayashi E, Uetani M, Kido T, Nogawa K. 2006. Long-term longitudinal study on the relationship between alternating shift work and the onset of diabetes mellitus in male Japanese workers. J Occup Environ Med. 48:455–461. doi:10.1097/01.jom.0000214355.69182.fa.
- Takahashi M, Tahara Y, Tsubosaka M, Fukazawa M, Ozaki M, Iwakami T, Nakaoka T, Shibata S. 2018. Chronotype and social jetlag influence human circadian clock gene expression. Sci Rep. 8:10152. doi:10.1038/s41598-018-28616-2.
- Tenkanen L, Sjöblom T, Kalimo R, Alikoski T, Härmä M. 1997. Shift work, occupation and coronary heart disease over 6 years of follow-up in the Helsinki heart study. Scand J Work Environ Health. 23:257–265. doi:10.5271/sjweh.218.
- Tranah GJ, Blackwell T, Stone KL, Ancoli-Israel S, Paudel ML, Ensrud KE, Cauley JA, Redline S, Hillier TA, Cummings SR, et al. 2011. Circadian activity rhythms and risk of incident dementia and mild cognitive impairment in older women. Ann Neurol. 70:722–732. doi:10.1002/ana.22468.
- Turek FW, Joshu C, Kohsaka A, Lin E, Ivanova G, McDearmon E, Laposky A, Losee-Olson S, Easton A, Jensen DR, et al. 2005. Obesity and metabolic syndrome in circadian Clock mutant mice. Science. 308:1043–1045. doi:10.1126/science.1108750.
- Varma VR, Dey D, Leroux A, Di J, Urbanek J, Xiao L, Zipunnikov V. 2017. Re-evaluating the effect of age on physical activity over the lifespan. Prev Med. 101:102–108. doi:10.1016/j.ypmed.2017.05.030.
- Walton JC, Bumgarner JR, Nelson RJ. 2022. Sex differences in circadian rhythms. Cold Spring Harb Perspect Biol. 14:a039107. doi:10.1101/cshperspect.a039107.
- Wehrens SMT, Christou S, Isherwood C, Middleton B, Gibbs MA, Archer SN, Skene DJ, Johnston JD. 2017. Meal timing regulates the human circadian system. Curr Biol. 27:1768–1775.e3. doi:10.1016/j.cub.2017.04.059.