Abstract
Christensen, D.R. and B.C. Moore. 2009. Using stable isotopes and a multiple-source mixing model to evaluate fish dietary niches in a mesotrophic lake. Lake Reserv. Manage. 25:167–175.
We used stable isotope analysis (SIA) of δ13C and δ15N and a multiple-source mixing model to evaluate dietary niches within the Twin Lakes, Washington, fish community to identify potential for exploitative competition, resource partitioning, and predation. The SIA revealed distinct spatial feeding niches; pelagic species were δ13C depleted, while littoral organisms were δ13C enriched. Trophic feeding niches were identified from δ15N enrichment with each successive trophic level. We found δ15N progression with increasing largemouth bass size, suggesting ontogenetic diet variability. Model results suggested that the smaller bass (i.e., ⩽299 mm length) fed principally on golden shiner, crayfish, and macroinvertebrates while larger bass (⩾300 mm) primarily consumed brook trout and golden shiner. Isotopic signatures for golden shiner were intermediary, indicating both pelagic and littoral feeding sources, including phantom midges (nocturnal and pelagic) and damselflies (littoral) as principal diet sources, suggesting possible horizontal diel migration in golden shiner. Pelagic zooplankton was indicated as the most important food source for rainbow trout. Food resources appeared to be partitioned among the Twin Lakes fish community, possibly limiting competitive interactions. Piscivory in largemouth bass was focused on golden shiner and brook trout, suggesting possible top-down regulation of lower trophic levels. Stable isotope analysis and multiple-source mixing models are useful tools that can improve lake and fishery management decisions by providing data on food web dynamics such as competition, resource partitioning, and predation in lakes.
Understanding food web dynamics in aquatic systems can aid resource managers in identifying potential for competition or predation between undesirable fish and native or economically important species. The roles of fish in aquatic food webs can often be complex, however, because they may occupy multiple trophic levels and consume varied food sources. Spatial and temporal differences in the abundance of consumers and of their food sources increase interspecific variability in any aquatic system, and ontogenetic diet shifts can induce intraspecific variability, affecting energy flow and top-down trophic regulation (CitationCarpenter and Kitchell 1993, CitationVander Zanden et al. 2000, CitationPost 2003). Understanding ecological roles and interactions within fish communities can be crucial, not only to managing fisheries, but also for lake water quality management.
Natural dietary variability can be misinterpreted when using traditional gut content analysis (GCA). Gut content analysis gives a “snapshot” of immediate feeding trends but may overlook variation between sampling periods (CitationVander Zanden et al. 2000, CitationPower et al. 2002, CitationClarke et al. 2005). To improve statistical power in these analyses, sample size and frequency often need to be increased, which can be time consuming, labor intensive, and expensive (CitationClarke et al. 2005). Gut content data may also be difficult or impossible to perform on smaller fish and invertebrates.
Stable isotope analysis (SIA) has become a popular way to examine trophic relationships in all aquatic ecosystems. Stable isotope ratios of δ13C/δ12C and δ15N/δ14N (heavier, less abundant/lighter, more abundant isotopes) can give a time-integrated estimation of predatory diets (CitationVander Zanden and Rasmussen 1999), diminishing the need for large sample size and sampling frequency common with gut content studies (CitationClarke et al. 2005). Ratios of δ13C/δ12C in muscle tissue are similar to those of the prey consumed (CitationVander Zanden and Rasmussen 1999). Dietary niches can be identified spatially because phytoplankton and benthic algae fractionate carbon differently, resulting in δ13C-enriched benthic algae and δ13C-depleted pelagic phytoplankton (CitationVander Zanden and Rasmussen 1999). However, δ15N is fractionated and enriched from prey to predator by about 3–4‰, indicating the trophic position of the fish (CitationDeNiro and Epstein 1981, CitationCabana and Rasmussen 1994, CitationVander Zanden and Rasmussen 1999). Combined isotopic signatures of both δ13C and δ15N can yield a time-integrated diet estimate based on spatial and trophic feeding niches.
Stable isotope analysis has been used successfully in several aspects of aquatic ecology. CitationCabana and Rasmussen (1996), CitationVander Zanden and Rasmussen (1999) and Vander Zanden et al. (Citation1999a, Citation1999b) used SIA to compare and define trophic food webs in lentic environments. CitationPost (2003) identified ontogenetic diet variations in largemouth bass (Micropterus salmoides L.) and found that an early shift to piscivory ultimately resulted in increased rates of growth and survival. CitationClarke et al. (2005) used SIA to determine diet similarity and predation pressure by large piscivores to examine causes of dwindling kokanee (Onkorhynchus nerka W.) populations. CitationPower et al. (2002) documented dietary niche shifts in brook trout (Salvelinus fontinalis M.) and arctic charr (Salvelinus alpinus L.) and suggested that lake morphometry and interspecific interactions influenced dietary niches. CitationGrey (2001) determined the trophic ecology of adfluvial brown trout (Salmo trutta L.) from embryo to adult within a watershed. Vander Zanden and coauthors (CitationVander Zanden and Rasmussen 1999, CitationVander Zanden et al. 1999a, Citation1999b, Citation2000) identified alterations in food web structure after the introduction of non-native bass. CitationCunjak et al. (2005) and CitationMcCarthy and Waldron (2000) identified spatial and trophic feeding niches utilizing SIA to identify fish migrating from different areas within a watershed. Bioaccumulation of contaminants through food webs has also been addressed using SIA (CitationCabana and Rasmussen 1994, CitationKidd et al. 1995, CitationGustin et al. 2005). CitationSarakinos et al. (2002) demonstrated feasibility of SIA to recreate historic food webs by use of organisms preserved in formalin and ethanol.
Despite numerous successful applications of SIA, limitations exist, as they do for all methods. Numerous considerations are needed when conducting SIA, such as spatial, temporal, and ontogenetic variability for both predator and prey feeding behaviors (CitationVander Zanden et al. 2000, CitationMacAvoy et al. 2001, CitationPost 2003). System productivity and potential sources of carbon (phytoplankton, benthic algae, macrophyte, and terrestrial inputs) should also be considered (CitationVander Zanden and Rasmussen 1999, CitationVander Zanden and Vadeboncoeur 2002). For diet analyses, all possible diet sources should be identified before SIA is conducted. Combining SIA with GCA may be beneficial when addressing possible limitations.
In the past, stable isotope mixing models could identify dietary contributions of only two or three food sources. With the δ15N scale, two sources could be plotted, and possible source contribution could be deducted based on distance from the consumer. When a third source was added to the δ13C axis, possible diet proportions could also be deducted, but with less certainty (CitationPhillips and Koch 2002). However, with more than three potential sources, no effective method adequately estimated contributions (CitationPhillips and Gregg 2003). To address this problem, a multiple-source mixing model, called IsoSource (available from the website of the US Environmental Protection Agency), was created by CitationPhillips and Gregg (2003). IsoSource employs a mass-balance approach to estimate the range of all possible diet proportions from 0–100% for as many as 10 contributing prey sources. The model outputs all isotopic combinations that sum to the isotopic signature of the consumer as viable solutions (CitationPhillips and Gregg 2003). All major diet contributions must be correctly identified before SIA is performed because too many or too few sources will change model outputs. Model outputs are simply estimates of the range of possible diet contributions rather than exact measurements.
In this study, we used SIA and the multiple source-mixing model, IsoSource, to evaluate diets of principal species within the Twin Lakes, Washington. The fishery is comprised of non-native cold- and warmwater species, some of which are considered as game fish and some as nondesirable species. Largemouth bass and golden shiner (Notemigonus crysoleucas M.), which were apparently illegally introduced in the 1980s, and which have become well established in Twin Lakes, have raised concerns about potential negative trophic interactions with rainbow and brook trout. Fishery managers at the Twin Lakes sought to identify (1) how resources are partitioned within the ecosystem, (2) the potential for competition with salmonids, and (3) how largemouth bass may influence lower trophic levels through predation.
Study site
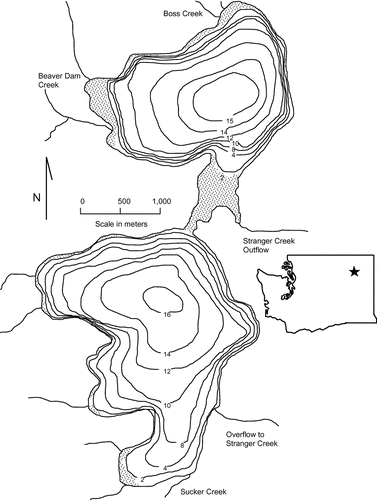
North and South Twin Lakes, Washington, are dimictic, mesotrophic (determined by annual chlorophyll-a concentrations of 3–7 ppb and unpublished monitoring data, 2004 to 2007; current authors) lakes. North and South Twin Lakes are similar in elevation (784 m), surface area (371 and 413 ha, respectively), maximum depth (15.2 and 17.4 m), and mean depth (9.7 and 10.4 m; ). A small channel connects the lakes; both show distinct summer stratification with clinograde dissolved oxygen and temperature profiles. By late June epilimnetic temperatures typically exceed 20°C while hypolimnetic waters are hypoxic to anoxic (CitationChristensen and Moore 2008).
Figure 1 North and South Twin Lakes showing bathymetry, tributaries, connective channel, and weed bed development (shaded). Depth scale in meters. The star represents the approximate location of the lakes in the state of Washington.
The lakes are located within the reservation of the Colville Confederated Tribes (CCT) that manage the lakes primarily for a put, grow, and take trout fishery. Angling revenue is a valuable aspect of the local tribal economy. Rainbow trout, brook trout, largemouth bass, and golden shiners comprise the majority of the fish community and were all introduced. Fish raised at the tribal fish hatchery supplement rainbow and brook trout populations. Largemouth bass and golden shiners were illegally introduced, probably in the 1980s, and have established successful breeding populations. While the bass are also a popular game fish, the general public perception has been that shiners negatively impact the trout fishery; managers have been concerned that both species may be reducing trout growth and survival through predation and competition (E. Schallenberger, Fishery Manager, Colville Confederated Tribes, pers. comm.).
Methods
Fish and invertebrate sampling
Largemouth bass and golden shiner were sampled using a Smith Root 5.0 GPP electrofishing boat in July 2006 using a stratified random sample design comprised of three transects in each of the two Twin Lakes. Electrofishing was conducted at night for 30 min of generator on-time per transect. Rainbow and brook trout were sampled using two 76.2 m sinking monofilament gillnets with 1.8-m vertical panels and varying mesh size (40–125 mm stretched). Gill nets were set perpendicular to shore and extended to depths around 10 m and left overnight for approximately 8 hr. We separated largemouth bass into functional feeding groups defined by lengths of 100–199 mm, 200–299 mm and ⩾300 mm to detect ontogenetic shifts in feeding behavior. These feeding groups were identified in a previous study conducted at Twin Lakes by CitationChristensen and Moore (2007).
Macroinvertebrates were collected for SIA from the littoral region during July 2006 using hand-held scoop nets. Zooplankton and Chaoborus were collected using a 75-μm mesh zooplankton net with a 30-cm opening. Pelagic zooplankton was collected with tows through the entire water column, from the bottom of the deepest (15 m) portion of the lake to the surface. Littoral zooplankton was collected in near-shore areas, from the bottom (6–8 m) to the surface. Zooplankton sampling locations were chosen to maintain consistency with the long-term utilization of these sites for other studies. Chaoborus were sampled in the same locations as were zooplankton, but during the night when they were distributed throughout the water column. Only invertebrates abundant in gut content samples from previous studies (CitationChristensen and Moore 2007, Citation2008) were subjected to SIA. All samples were rinsed with deionized water and frozen at −10°C.
Algae were identified in a previous study as an important dietary item for golden shiner (CitationChristensen and Moore 2008). We focused our collections on epilithic and epiphytic algae due to the difficulty in sampling adequate amounts of phytoplankton for SIA. Algae samples were collected by scraping littoral substrates. We termed these samples as benthic algae to differentiate from phytoplankton.
Stable isotope analysis
About 1–4 g (wet) of white muscle tissue was sampled from the left side of each fish just below and anterior to the dorsal fin for SIA (CitationPinnegar and Polunin 1999). Muscle tissue was preserved by immediately freezing. Because of the small size of most invertebrates, the entire organism had to be used for SIA. Crayfish and littoral Chaoborus were not abundant in the 2006 sampling, so these tissues were supplemented with crayfish and littoral Chaoborus specimens sampled in 2005 and preserved in 5–10% formalin. Because formalin can deplete δ13C and may cause some unexplainable N enrichment, the 2005 crayfish and littoral chaoborus samples were corrected for formalin effects by the addition of 1.65‰ δ13C and the subtraction of 0.08‰ δ15N (CitationSarakinos et al. 2002). These corrections represent average values determined from a variety of aquatic invertebrate tissues, such as clams, caddisflies, and mud shrimp. Tissues in this study were preserved in similar amounts of formalin (5–10%) and for comparable duration (>6 mo).
On return to the lab, samples were thawed and re-rinsed with deionized water. Samples were then dried in a laboratory oven at 75°C for 48 hr and homogenized with a mortar and pestle. Subsamples to yield approximately 0.6 mg were selected from the dried tissues, placed in small tin capsules, and weighed. Because of the small size of many invertebrates, multiple organisms of the same species were pooled to obtain adequate dry weight and mean isotopic signatures (CitationVander Zanden and Rasmussen 1999). Stable 13C and 15N analysis were performed using a continuous flow isotope ratio mass spectrometer (Delta PlusXP, Thermofinnigan, Bremen; CitationBrenna et al. 1997) at the Isotope Core Laboratory, Department of Biological Sciences, Washington State University (Pullman, WA).
Delta (δ) notation is used to express the ratios of 13C and 15N deviation from a standard material. Values are expressed in parts per thousand (‰):
Stable isotope mixing model
IsoSource (CitationPhillips and Gregg 2003) was used to determine the range of diet possibilities from the stable isotope data. Model mass balance tolerance was set at 0.1 with 1% increments. Trophic fractionation of δ15N was assumed to be between 3 and 4‰, and consumer δ15N values were adjusted appropriately within those ranges (CitationDeNiro and Epstein 1981, CitationCabana and Rasmussen 1994). CitationPhillips and Gregg (2003) emphasized the importance of displaying the entire range of possible outcomes rather than focusing on the mean because many source combinations may have an equal probability of occurrence.
Mixing polygons created around the adjusted consumer on a δ13C and δ15N scatter plot indicate possible source contributions. IsoSource uses the location and distance of sources around the adjusted consumer on a δ13C and δ15N scatter-plot to estimate possible diet contributions (CitationPhillips and Gregg 2003). A “constrained solution” occurs when the consumer isotopic signature is nearest the line connecting two sources. Those two sources contribute the greatest to that consumer's diet, indicated by a more complete bell-shaped curve of possible solutions. A consumer signature more toward the middle of the polygon is considered “diffuse,” where multiple sources contribute comparably to the organism's diet, often indicated by incomplete curves illustrating a more intermittent diet contribution. We expressed the range of possible solutions in histogram form with bell-shaped curves representative of sources contributing the most to the diet of a consumer.
Results
Twelve golden shiner, 24 largemouth bass between 100–299 mm, and 7 largemouth bass ⩾300 mm were sampled for SIA. One hatchery rainbow trout released the previous year (as indicated by an inserted elastomer tag from the tribal hatchery) and 10 recently released hatchery brook trout were sampled for SIA. Brook trout were abundant in our samples because of recent hatchery stocking, while rainbow trout were scarce. In general, sampling efforts indicated largemouth bass to be littoral, rainbow and brook trout to be pelagic, and golden shiner migrated from littoral habitats to near surface pelagic habitats at night. We also sampled five major groups of invertebrates including zooplankton (primarily D. pulicaria, Diaptomus spp. and Chaoborus spp.), damselflies (Coenagrionidae and Lestidae), dragonflies (Gomphidae and Libellulidae), scuds (Amphipoda), and crayfish (Decapoda).
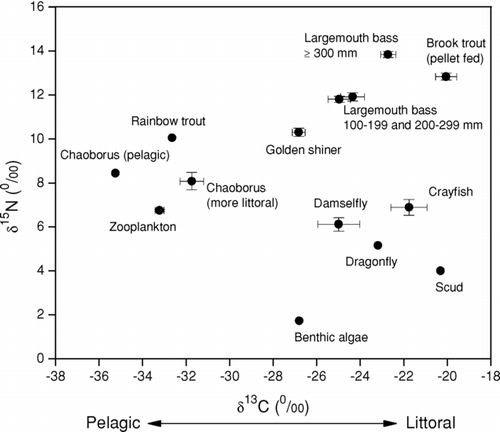
Stable isotope signatures indicated distinct pelagic and littoral habitat use between sampled species (). Littoral species had less negative δ13C values than did pelagic organisms; however, pelagic invertebrates had greater δ15N values when compared to similar littoral invertebrates within the same trophic level. Golden shiners had intermediary isotopic signatures, indicative of both littoral and pelagic feeding behavior. Rainbow trout had an isotopic signature distinctive of a pelagic dietary feeding niche. Brook trout isotopic signatures were greatly enriched due to the consumption of protein and nitrogen-rich feed consumed at the tribal hatchery prior to their release. Because of slow turnover of isotopes in muscle tissue (CitationMacAvoy et al. 2001), the sampled brook trout did not yet express stable isotope signatures of prey consumed in the lakes, so no dietary analysis was performed for that species.
Figure 2 Late spring to early summer stable isotope signatures for fish and principal prey organisms in the Twin Lakes, Washington, food web. Vertical and horizontal error bars represent ±1 SE. Circles with no error bars represent single pooled samples.
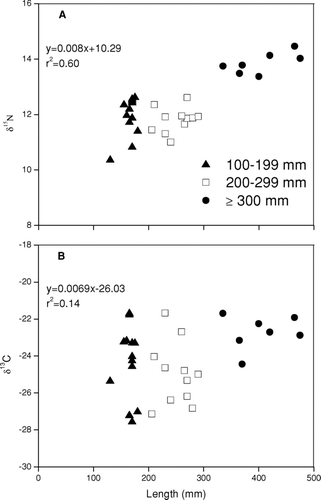
We combined largemouth bass smaller size classes of 100–199 mm and 200–299 mm for diet estimation because no significant difference was detected between these two feeding groups for either δ13C (df = 22, p = 0.416) or δ15N (df = 22, p = 0.737), respectively. The smaller bass (<299 mm) had elevated δ15N over other species, but this signature was significantly lower (df = 28, p < 0.001) than for the larger size bass (⩾300 mm). The larger bass size class had the most enriched δ15N isotopic signature of all fish species, indicating a piscivorous status at the top of the Twin Lakes food web (). Isotopic signatures became more 15N enriched with increasing largemouth bass length (y = 0.008x + 10.29, r2= 0.60, t = 6.54, p < 0.001). In general, isotopic signatures also became more 13C enriched with increasing bass length, although the relationship was not statistically significant (y = 0.0069x − 26.03, r2= 0.14, t = 2.14, P = 0.080).
Figure 3 Change in δ15N (A) and δ13C (B) signatures with increasing largemouth bass length.
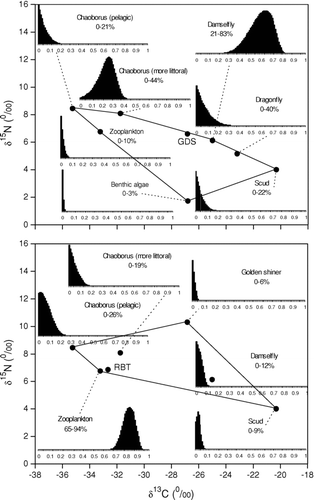
IsoSource model outputs estimated largemouth bass ⩾300 mm to have consumed mostly brook trout and golden shiner during the late spring and early summer of 2006 (). The abundance of newly released hatchery brook trout shoaling in shallow littoral waters provided big largemouth bass a probable prey source. Largemouth bass ⩽299 mm were too small to have consumed the stocked hatchery brook trout, which were approximately 250 mm in mean total length. The smaller bass had diets consisting primarily of golden shiner and crayfish. Macroinvertebrates contributed more to the diets of smaller bass than with the larger bass, indicating ontogenetic diet variability.
Figure 4 Mixing polygons for δ13C and δ15N signatures of principal prey organisms of largemouth bass (LMB) sampled from Twin Lakes, WA. Consumer corrections were made assuming a trophic fractionation of 3–4‰ of δ15N from prey to predator. Histograms represent the range of possible contributions of prey organisms to the diet of the selected fish. Diet estimates and isotope signatures represent late spring to early summer feeding behavior. Estimated values are presented on a 1–99 percentile range. The range of diet contributions were estimated using the model IsoSource (CitationPhillips and Greggs 2003; see text for details).
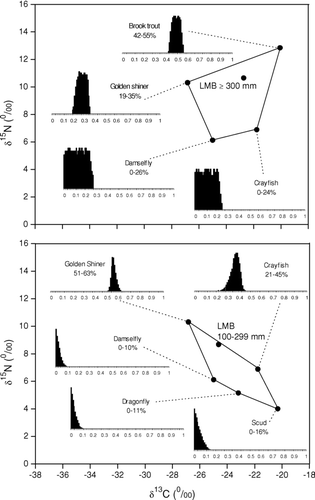
Golden shiner consumed the greatest range of prey organisms. Primary golden shiner diet constituents were damselflies and the more littoral Chaoborus (). A mixture of prey items supports the observed diel nature of golden shiner at utilizing both littoral and pelagic habitats. In contrast to shiners, rainbow trout displayed the lowest variety of prey organisms, with diets largely confined to zooplankton (D. pulicaria) and pelagic Chaoborus.
Figure 5 Mixing polygons for δ13C and δ15N signatures of principal prey organisms of golden shiner (GDS) and rainbow trout (RBT) sampled from Twin Lakes, WA. Consumer corrections were made assuming a trophic fractionation of 3–4‰ of δ15N from prey to predator. Histograms represent the range of possible contributions of prey organisms to the diet of the selected fish. Diet estimates and isotope signatures represent late spring to early summer feeding behavior. Estimated values are presented on a 1–99 percentile range. The range of diet contributions were estimated using the model IsoSource (CitationPhillips and Greggs 2003) (see text for details).
Discussion
Stable isotope analysis of δ13C and δ15N was an effective way to elucidate food web interactions within the Twin Lakes. The ability to identify spatial as well as temporal feeding patterns makes SIA more advantageous than traditional gut content analysis (GCA) alone, when funds, time, and personnel are limiting. Although GCA allows fine-scale estimation and quantification of source contributions, obtaining adequate sample size and frequency to accurately measure long-term diet trends can be difficult (CitationClarke et al. 2005). Relatively low standard error in δ13C, and especially δ15N, in our study fish suggests that samples of only 10–20 fish may yield reliable data for general food web evaluations. Because SIA is time-integrated, fewer sampling excursions would be needed to determine seasonal feeding behavior than with GCA.
Smaller sample size and decreased sampling frequency with SIA can make food web evaluations more feasible for state or government agencies with limited budgets and personnel. The cost of tissue preparation is relatively low, and most stable isotope labs at universities charge less than $15.00 per sample for δ13C and δ15N analysis (personal observation). When time and funds are available for fishery managers, combining SIA with GCA may effectively address short-comings in either methodology and allow better food web interpretation (CitationPower et al. 2002, CitationPost 2003, CitationClark et al. 2005).
In a previous GCA study at Twin Lakes, CitationChristensen and Moore (2007) found largemouth bass diets to vary ontogenetically; these fish became principally piscivorous at approximately 300 mm in length. Ontogenetic variation was also observed in this study, with largemouth bass ⩾300 mm determined to be the most piscivorous. Compared to the GCA study, however, the SIA estimated that golden shiner contributed much more to the diets of largemouth bass ⩽299 mm, indicating an earlier possible onset of piscivory. Observed differences may be explained by temporal and methodical variation (i.e., GCA vs. SIA). Annual variability in largemouth bass diets was evident in the GCA as well as the abundance and availability of golden shiner and stocked trout for bass consumption (CitationChristensen and Moore 2007). As largemouth bass ⩾300 mm shift their diets to the pulse of recently released hatchery trout, smaller bass may increasingly target golden shiner, which in turn may become more available for consumption. This study focused on late spring and early summer. Further SIA that evaluates seasonal and long-term annual trends may better identify annual piscivory rates in largemouth bass.
An important finding in this study was the consumption of hatchery brook trout by largemouth bass ⩾300 mm, illustrating that stocked trout can be vulnerable to bass predation. Christensen and Moore (Citation2007, Citation2008) found through GCA that largemouth bass ⩾300 mm consumed the most trout directly after the fish were stocked into the Twin Lakes. This corresponds to our current study that identified isotopic signatures of hatchery-reared brook trout stocked into the lakes in late April and model predictions suggesting they constituted a large proportion of the diet of largemouth bass ⩾300 mm.
Predation of hatchery-reared and released trout by largemouth bass represents an interesting challenge and expense for Twin Lakes fish management. The presence of a top predator such as largemouth bass may have a community-wide influence on the abundance of other desirable sport fish such as trout, possibly affecting the recreational fishery (CitationCarpenter and Kitchell 1993). However, our results indicate bass also consume significant numbers of golden shiner, potentially reducing shiner competition with trout for zooplankton (CitationCarpenter and Kitchell 1993); reduction in shiner populations may also positively impact public perceptions about the Twin Lakes fishery.
Understanding when largemouth bass become piscivorous is also important if managers wish to protect bass with regulations to encourage top-down control on nuisance fish such as the golden shiner and develop trophy recreational fisheries (CitationCarpenter and Kitchell 1993). In the absence of largemouth bass predation in Twin Lakes, golden shiner densities could be greater, possibly negatively influencing trout through competition for pelagic zooplankton. The CCT has already implemented slot limits for bass to enhance survival of specific size classes and to potentially maximize shiner consumption. Adjustments in trout stocking practices, including density, fish size, time, and/or location may need to be implemented to reduce mortality from bass predation (CitationChristensen and Moore 2007, Citation2008).
Another important finding in this study was the evidence of resource partitioning between species. Potential for exploitative competition may have been reduced because fish species had differentiated feeding niches (CitationWinemiller 1989, CitationDeclerck et al. 2002). Stable isotope signatures for pelagic, semi-pelagic and littoral species were distinctly evident. In particular, golden shiner feeding behavior on Chaoborus in pelagic waters at night and on damselflies in the littoral region during the day was identified by SIA. This diurnal variation may reduce predation-risk and diet overlap in either pelagic or littoral habitats (CitationCarpenter and Kitchell 1993). A previous study by CitationChristensen and Moore (2008) using GCA also revealed resource partitioning within the Twin Lakes fish community.
Potential limitations in SIA should be addressed before engaging in detailed trophic studies. Temporal and spatial variability can become sources of confusion in long-term food web analysis. Variability in the distribution, abundance, and diversity of prey species and their changing diets in space and time can alter the flow of energy and isotopic composition of an organism (CitationVander Zanden et al. 2000, CitationMacAvoy et al. 2001, CitationPost 2003). For example, we found Chaoborus from profundal areas of Twin Lakes to be δ13C-depleted compared to littoral Chaoborus.
Hatchery-stocked fish may also cause confusion in stable isotope studies. We found isotopic signatures of hatchery brook trout were enriched in both δ13C and δ15N due to high protein pellet feed. This “artificial” enrichment precluded any estimation of in-lake feeding with SIA until sufficient time had passed for turnover of δ13C and δ15N signatures in brook trout muscle tissues. However, the elevated brook trout isotopic were expressed in signatures of the picivorous large bass (⩾300 mm), making it necessary to include brook trout in the estimation of bass diets. Previous GCA supported the SIA evidence for consumption of hatchery stocked trout by largemouth bass (CitationChristensen and Moore 2007, Citation2008). Overall, SIA must consider that spatial isotopic variability within a single species may exist in any water body. These may be due to varying sources for fish cohorts, such as different streams, or hatchery versus in-lake bred fish. Ontogenetic differences, discussed previously, can also produce varying signatures within a single species.
Isotopic variability between carbon sources such as phytoplankton, benthic algae, macrophytes, and terrestrial plants may also create confusion (CitationVander Zanden and Rasmussen 1999, CitationVander Zanden and Vadeboncoeur 2002). We estimated the contribution of epilithic and epiphytic algae in golden shiner diets. Model estimates suggested these algae contributed very little to golden shiner diets despite considerable consumption estimates measured in past GCA (CitationChristensen and Moore 2008). It is possible that shiners do not digest algae completely so that the associated carbon is not assimilated into their tissues, or that the algal material being consumed was not adequately identified. Effective application of IsoSource necessitates accurate identification of all major diet sources because model outputs are highly sensitive to the number of diet source inputs.
Compared to older linear mixing models that could identify only two or three diet contributors, the multiple-source mixing model, IsoSource, was an especially useful tool for evaluating dietary niches in Twin Lakes, where fish diets consisted of multiple taxa. Focusing on only two or three diet sources could lead to misidentification of source contributions and erroneous estimations of diet proportionality (CitationPhillips and Gregg 2003). The model estimates the range of possible outcomes, each with equal probability, rather than a mean value with an associated confidence interval; therefore, exact quantification may require accompanying use of GCA data. We recommend combining GCA with SIA and multiple source models, such as IsoSource, as an effective strategy to identify probable prey sources, to provide greater resolution, and to better elucidate lake food web ecology to support both lake and fishery management decisions.
Acknowledgments
Funding for this project was provided in part by the Colville Confederated Tribes, Nespelem, Washington. We would like to recognize the field assistance of several individuals; Ed Shallenberger, Rod Stensgard, Marvin Bob and occasional student helpers. Ed Shallenberger is especially thanked for his helpful critiques, and for his sound advice and helpful input into these studies. We would also like to thank two anonymous reviewers for their recommendations.
References
- Brenna , J. T. , Corso , T. N. , Tobias , H. J. and Caimi , R. J. 1997 . High-precision continuous-flow isotope ratio mass spectrometry . Mass Spect. Rev. , 16 : 227 – 258 .
- Cabana , G. and Rasmussen , J. B. 1994 . Modeling food chain structure and contaminant bioaccumulation using stable nitrogen isotopes , Vol. 372 , 255 – 257 . London : Nature .
- Cabana , G. and Rasmussen , J. B. 1996 . Comparison of aquatic food chains using nitrogen isotopes . Proc. Natl. Acad. Sci. , 93 : 10844 – 10847 .
- Carpenter , S. R. and Kitchell , J. F. 1993 . The trophic cascade in lakes , Cambridge , , UK : Cambridge University Press .
- Christensen , D. R. and Moore , B. C. 2007 . Differential prey selectivity of largemouth bass functional feeding groups in Twin Lakes, Washington . Lake Reserv. Manage. , 23 : 39 – 48 .
- Christensen , D. R. and Moore , B. C. 2008 . Diet composition and overlap in a mixed warm- and coldwater fishery . J. Freshw. Ecol. , 23 ( 2 ) : 195 – 204 .
- Clarke , L. R. , Vidergar , D. T. and Bennett , D. H. 2005 . Stable isotopes and gut content show diet overlap among native and introduced piscivores in a large oligotrophic lake . Ecol. Freshw. Fish , 14 : 267 – 277 .
- Cunjak , R. A. , Roussel , J. M. , Gray , M. A. , Dietrich , J. P. , Cartwright , D. F. , Munkittrick , K. R. and Jardine , T. D. 2005 . Using stable isotope analysis with telemetry or mark-recapture data to identify fish movement and foraging . Oecologia , 144 : 636 – 646 .
- Declerck , S. , Louette , G. , Bie , T. D. and Meester , L. D. 2002 . Patterns of diet overlap between populations of non-indigenous and native fishes in shallow ponds . J. Fish Biol. , 61 : 1182 – 1197 .
- DeNiro , M. J. and Epstein , S. 1981 . Influence of diet on the distribution of nitrogen isotopes in animals . Geochim. Cosmochim. Acta , 45 : 341 – 353 .
- Grey , J. 2001 . Ontogeny and dietary specialization in brown trout (Salmo trutta L.) from Loch Ness, Scotland, examined using stable isotopes of carbon and nitrogen . Ecol. Freshw. Fish , 10 : 168 – 176 .
- Gustin , M. S. , Saito , L. and Peacock , M. 2005 . Anthropogenic impacts on mercury concentrations and nitrogen and carbon isotope ratios in fish muscle tissue of the Truckee River watershed, Nevada, USA . Sci. Total Environ. , 347 : 282 – 294 .
- Kidd , K. A. , Schindler , D. W. , Hesslein , R. H. and Muir , D. C.G. 1995 . Correlation between stable nitrogen isotope ratios and concentrations of organochlorines in biota from a freshwater food web . Sci. Total Environ , 160/161 : 381 – 390 .
- MacAvoy , S. E. , Macko , S. A. and Garman , G. C. 2001 . Isotopic turnover in aquatic predators: quantifying the exploitation of migratory prey . Can. J. Fish. Aquat. Sci. , 58 : 923 – 932 .
- McCarthy , I. D. and Waldron , S. 2000 . Identifying migratory Salmo trutta using carbon and nitrogen stable isotope ratios . Rapid Commun. Mass Spectrom. , 14 ( 15 ) : 1325 – 1331 .
- Phillips , D. L. and Koch , P. L. 2002 . Incorporating concentration dependence in stable isotope mixing models . Oecologia , 130 : 114 – 125 .
- Phillips , D. L. and Gregg , J. W. 2003 . Source partitioning using stable isotopes: coping with too many sources . Oecologia , 136 : 261 – 269 .
- Pinnegar , J. K. and Polunin , N. V.C. 1999 . Differential fractionation of δ13C and δ15N among fish tissues: implications for the study of trophic interactions . Ecology , 13 : 225 – 231 .
- Post , D. M. 2003 . Individual variation in the timing of ontogenetic niche shifts in largemouth bass . Ecology , 84 ( 5 ) : 1298 – 1310 .
- Power , M. , Power , G. , Caron , F. , Doucett , R. R. and Guiguer , K. R.A. 2002 . Growth and dietary niche in Salvelinus alpinus and Salvelinus fontinalis as revealed by stable isotope analysis . Environ. Biol. Fish. , 64 : 75 – 85 .
- Sarakinos , H. C. , Johnson , M. L. and Zanden , M. J.V. 2002 . A synthesis of tissue-preservation effects on carbon and nitrogen stable isotope signatures . Can. J. Zool. , 80 : 381 – 387 .
- Vander Zanden , M. J. and Rasmussen , J. B. 1999 . Primary consumer δ13C and δ15N and the trophic position of aquatic consumers . Ecology , 80 ( 4 ) : 1395 – 1404 .
- Vander Zanden , M. J. , Casselman , J. M. and Rasmussen , J. B. 1999a . Stable isotope evidence for the food web consequences of species invasions in lakes . Nature , 401 : 464 – 467 .
- Vander Zanden , M. J. , Shuter , B. J. , Lester , N. and Rasmussen , J. B. 1999b . Patterns of food chain length in lakes: A stable isotope study . Am. Nat. , 154 ( 4 ) : 406 – 416 .
- Vander Zanden , M. J. , Shuter , B. J. , Lester , N. P. and Rasmussen , J. B. 2000 . Within- and among-population variation in the trophic position of a pelagic predator, lake trout (Salvelinus namaycush) . Can. J. Fish. Aquat. Sci. , 57 : 725 – 731 .
- Vander Zanden , M. J. and Vadeboncoeur , Y. 2002 . Fishes as integrators of benthic and pelagic food webs in lakes . Ecology , 83 ( 8 ) : 2152 – 2161 .
- Winemiller , K. O. 1989 . Ontogenetic diet shifts and resource partitioning among piscivorous fishes in the Venezuelan ilanos . Environ. Biol. Fish. , 26 : 177 – 199 .