Abstract
A survey of microcystin in 187 Florida lakes was completed from Jan to Dec 2006. Annual average microcystin concentrations of the 187 Florida lakes ranged from nondetectable (< 0.1 μ g/L) to 12 μ g/L, with concentrations in individual water samples (N = 862) ranging from nondetectable to 32 μ g/L. Only 7% of all the individual samples exceeded the World Health Organization (WHO) drinking guidance value of 1 μ g/L. Three individual water samples collected from two lakes (0.3%) exceeded the WHO recreational guidance value of 20 μ g/L. Using chlorophyll concentrations and Secchi depth measurements, tables were constructed to predict the probability that microcystin concentrations exceeded the WHO guidance values in Florida lakes. Additionally, six hypereutrophic lakes (Harris Chain of Lakes, Lake County, FL) were studied from Sep 2006 to Aug 2007 and 40% of the samples exceeded 1 μ g/L but none exceeded 20 μ g/L. This study also provides baseline information and relations between trophic status, seasonality, water chemistry and microcystin concentrations in Florida lakes.
Introduction
Cyanobacteria blooms are of particular concern because some strains of cyanobacteria produce toxins, the most common of which is microcystin (CitationBotes et al. 1984, CitationSivonen and Jones 1999). Although microcystin is most commonly associated with the cyanobacteria species Microcystis aeruginosa, other cyanobacteria genera, such as Anabaena, Planktothrix and Nostoc also produce the toxin (CitationDawson 1998). Reported cases of livestock, wildlife, pet, and even human deaths have been attributed to consumption of freshwaters with elevated microcystin concentrations (CitationSteyn 1943, CitationAshworth and Mason 1946, CitationCarmichael 1986, Citation1994, CitationJochimsen et al. 1998). These and other reports have garnered public attention, and there are now increasing efforts to measure microcystin concentrations in lakes. With the exception of microcystin being suggested as a possible tumor promoter (CitationChorus and Bartram 1999), the effects of long-term exposure to microcystins on humans are not well known (CitationJacoby and Kann 2007).
Algal toxins other than microcystin have potential associated risks, synergistic effects and possible presence in aquatic systems (including Florida lakes). However, more data exist for microcystins and have allowed the development of provisional tolerable daily intake (TDI) and guidance values for microcystin. The World Health Organization (WHO) suggests a drinking water guidance value of 1 μ g L−1 and a recreational guidance value of 20 μ g L−1 for activities in direct contact with water, and 100 μ g L−1 for activities having indirect contact with water (CitationChorus and Bartram 1999). These guidance values represent a moderate probability of adverse health effects for humans. Associated with each guidance value is an uncertainty factor of 1000. The uncertainty factor accounts for the differences between inter- and intraspeices sensitivities to a chemical substance and other factors such as inadequacies in the database or severity of effects of the toxin.
Managers understand that eutrophic and hypereutrophic waters are more likely to contain cyanobacteria (CitationWetzel 1966, CitationLund 1969, CitationCanfield et al. 1989) and, by extension, the probability of higher microcystin concentrations (CitationKotak et al. 1995, CitationWu et al. 2006, CitationKotak and Zurawall 2007). Although cyanobacteria dominance has been identified in Florida lakes of all trophic states (CitationCanfield et al. 1989), cyanobacteria have been shown to dominate more than 90% of phytoplankton biomass in highly productive lakes (CitationDuarte et al. 1992) and represent the dominant community of phytoplankton in many Florida lakes (CitationAgusti et al. 1990). Florida offers optimal growing conditions (e.g., abundant light, nutrient rich waters, high temperatures, and a longer growing season) for cyanobacteria proliferation. Hence, Florida represents an ideal location for evaluating the distribution of microcystin on a regional basis.
This study is one of the first statewide evaluations of microcystin concentrations in a large number of subtropical lakes. The overall objective of this study was to evaluate variance in microcystin concentrations among many lakes versus examining the variance within individual lakes. This study provides an integral contribution to the understanding of the relationship between microcystin toxin concentrations, trophic state and seasonality in the subtropics. Another purpose was to assess the probability that microcystin concentrations in Florida lakes exceeded the WHO guidance values for drinking water and recreation. Our approach was to first conduct a statewide survey of 187 Florida lakes based on individual water samples collected six times during the year at open-water sites. We more intensively studied six hypereutrophic lakes (Harris Chain of Lakes, Lake County, FL) where microcystin concentrations exceeding the WHO drinking water guidance value were previously documented (CitationWilliams et al. 2007). Finally, trophic state, seasonality and water chemistry variables (i.e., total phosphorus, total nitrogen, and chlorophyll concentrations) were examined to better understand factors related to microcystin in Florida lakes. Tables relating chlorophyll concentration and Secchi depth to microcystin concentration were constructed for use in predicting the probability that microcystin concentrations in a Florida lake would be detectable and/or exceed the drinking water–recreational guidance values.
Methods
Study lakes and sampling
The 187 Florida lakes selected for study encompassed a statewide distribution (38 counties; ) and a wide range of trophic states (). Each lake was sampled six times a year (Jan–Dec 2006) by Florida LAKEWATCH, a citizen volunteer monitoring program started in 1986 with the goal of collecting credible total phosphorus, total nitrogen, chlorophyll and Secchi depth data from a large number of Florida lakes (CitationCanfield et al. 2002). The Florida LAKEWATCH program was utilized to collect water samples used for evaluation of microcystin concentrations among the 187 Florida lakes.
Table 1 Summary statistics for nutrients (μ g/L), chlorophyll (μ g/L), Secchi depth (m) and microcystin concentrations (μ g/L) for the annual average of 187 Florida lakes and 862 individual water samples collected Jan to Dec 2006.
Figure 1 The 187 Florida lakes sampled for microcystin Jan to Dec 2006 and the Harris Chain of Lakes (Beauclaire, Dora [East and West], Eustis, Harris and Griffin) located in Lake County, FL, sampled for microcystin Sep 2006 to Aug 2007.
![Figure 1 The 187 Florida lakes sampled for microcystin Jan to Dec 2006 and the Harris Chain of Lakes (Beauclaire, Dora [East and West], Eustis, Harris and Griffin) located in Lake County, FL, sampled for microcystin Sep 2006 to Aug 2007.](/cms/asset/9dcae741-dae7-480e-b94f-139f934865b8/ulrm_a_413828_o_f0001g.gif)
Florida LAKEWATCH collected water samples for nutrient, chlorophyll and microcystin analyses during six time periods: (1) Jan to Feb; (2) Mar to Apr; (3) May to June; (4) July to Aug; (5) Sep to Oct; and (6) Nov to Dec. Water samples were collected at three previously established open-water sites by the Florida LAKEWATCH program. Some of these sites were located in near-shore areas. Water samples were collected at a depth of 0.3 m in a 1-L brown acid-washed, triple-rinsed Nalgene bottle; Secchi depth was recorded at each site. LAKEWATCH volunteers were notified of this study and asked to watch for algal blooms events (open-water, near-shore, around docks, beach areas) and take additional water samples if such blooms occurred. No additional water samples were received for the 187 lakes during this study.
Following LAKEWATCH protocol, water samples were stored frozen until analyses were conducted. Nutrient and chlorophyll analyses were completed for the three stations. From the three stations, means were calculated for nutrient and chlorophyll concentrations for each lake and sampled time period. A composite 60-ml water sample (20-ml from each station were combined into a 60-ml acid-cleaned, triple-rinsed Nalgene bottle) was used for microcystin analyses and assayed within 6 mo of freezing. Some individual water samples (N = 260) were missed during each time period due to sampling difficulties.
We sampled the Harris Chain of Lakes monthly from Sep 2006 to Aug 2007 (). The Harris Chain of Lakes lies in the southern part of the central lake-district region (CitationGriffith et al. 1997). Lakes in this region generally have elevated total phosphorus (≥ 20 μ g/L), total nitrogen (> 900 μ g/L) and chlorophyll (> 6 μ g/L) concentrations. Specific conductance is typically > 99 μ S/cm at 25 C, pH is > 7.2 and Secchi depth measurements are ≤ 1 m (CitationCanfield and Hoyer 1988). The Harris Chain of Lakes are large (407–6679 ha), shallow depth (1.4–4.3 m), and generally hypereutrophic (chlorophyll concentrations > 40 μ g/L).
Three open-water sites (including coves and bays) were randomly selected and consistently sampled for each lake in the Harris Chain of Lakes. At each site, Secchi depth was recorded and water for nutrient and chlorophyll analyses was collected at 0.3 m in a 1-L brown, acid-washed, triple-rinsed Nalgene bottle. At each site, water samples for microcystin analysis were collected at 0.3 m in an 60-ml opaque, acid-washed, triple-rinsed Nalgene bottle. All samples were placed into a cooler with ice for transportation to the laboratory where they were refrigerated and analyzed within 24 h. From the three sampled stations, means were calculated for nutrient, chlorophyll, and microcystin concentration for each lake and month sampled. We chose the three open-water sites and 0.3 m sampling depth to remain consistent with the Florida LAKEWATCH sampling protocol and to allow better comparisons between the Harris Chain of Lakes and the 187 Florida lake data.
Water chemistry analyses
Water chemistry analyses included measurements of total phosphorus, total nitrogen and total chlorophyll concentrations. Total phosphorus concentrations (μ g/L) were determined using procedures of CitationMurphy and Riley (1962) following persulfate digestion (CitationMenzel and Corwin 1965). Total nitrogen concentrations (μ g/L) were determined by oxidizing water samples with persulfate and measuring nitrate-nitrogen with second derivative spectroscopy (D'Elia et al. 1997, CitationSimal et al. 1985, CitationWollin 1987). Chlorophyll concentrations (μ g/L) were determined spectrophotometrically following pigment extraction with hot 90% ethanol (Method 10200 H, APHA 1992; Sartory and Grobbelarr 1984). Measurements represent total chlorophyll because there was no correction for pheophytins.
Determination of microcystin concentration
All water samples were allowed to reach room temperature. Aliquots of 5 ml were pipetted into 10-ml glass vials and boiled at 100 C for 1 min to extract microcystin from the cyanobacterial cells (Metcalf and Codd 2005). The boiled samples were cooled to room temperature and centrifuged for 30 min at 2000 rpm to remove particulate material. The nonparticulate solution was extracted (50 μ l) for each sample and pipetted into a well of the 96-well ELISA (enzyme-linked immunosorbent) plate. All ELISA standards and lake water samples were run in duplicate.
The ELISA kit (Abraxis LLC, product # 520011, Warminster, PA, USA) provided the antibody-coated, 96-well plate, microcystin standards and all reagents used to determine total microcystin concentration. The absorbance of the samples was read at 450 nm and at a reference of 650 nm with a Stat Fax 3200 Microplate Reader (Awareness Technology Inc., Palm City, FL, USA). Microcystin concentrations were calculated from the absorbance values using the slope and intercept of the linear regression equation generated from a semi-logarithm plot. The semi-logarithm plot was generated using the logarithm of the machine-read absorbance of the Abraxis, LLC standards versus the calculated B/Bo % (the mean absorbance value of each standard divided by the mean absorbance of the zero standard). Total microcystin concentrations were reported in μ g/L. The sensitivity for microcystin detection is 0.1 μ g/L. Samples with microcystin concentrations > 5 μ g/L (highest standard) were diluted with deionized water to remain within the range of the standard curve.
ELISA assays (protein phosphatase inhibition assays) can produce highly variable results, that can be high both within and among ELISA assays for microcystin. Variation, such as large well-to-well variation, may be attributed to inaccurate pipetting, inconsistent substrates and mixing, fluctuations in temperature, or incomplete reactions. The manufacture (Abraxis LLC) indicates a < 15% expected coefficient of variation for the ELISA kit. Additionally, the ELISA method may also produce false positive or false negative microcystin results. To account for some of these limitations, means for microcystin concentration were calculated from the duplicate samples run for all ELISA standards and lake water samples. The microcystin concentrations reported are not necessarily the amount of toxin, but the measure of the response to what a pure microcystin strain would yield.
To determine if freezing affected microcystin concentration, six 60-ml acid-washed, triple-rinsed, polypropylene Nalgene bottles were filled with 25 ml of a cultured Microcystis aeruginosa (PCC 7806) strain grown in BG-11 medium according to the method of CitationStanier et al. (1971) and diluted by half with deionized water before aliquots were taken. A sample of the cultured strain was assayed immediately to determine the “initial” microcystin concentration, and the remaining subsamples were frozen. Once every 30 days for a 150-day period, a subsample was thawed and the contents analyzed for microcystin. This procedure was also completed with lake water from the Harris Chain of Lakes.
Seasonal trends in microcystin concentrations
Seasonal trends were evaluated by calculating the mean percent difference in microcystin concentrations for each time period sampled: (1) Jan to Feb; (2) Mar to Apr; (3) May to June; (4) July to Aug; (5) Sep to Oct; and (6) Nov to Dec. The 187 Florida lakes were grouped into trophic states by the annual average chlorophyll concentration for each lake, following the trophic classification system of CitationForsburg and Ryding (1980). The mean percent difference was calculated by subtracting the annual mean microcystin concentration of all individual water samples in each trophic state category (designated the annual mean microcystin concentration) from the microcystin concentration of the individual water sample. This value was then divided by the annual mean microcystin concentration and multiplied by 100. For the Harris Chain of Lakes, the same time periods were used as for the 187 Florida lakes. The annual average chlorophyll concentration of each of the Harris Chain of Lakes and individual water samples were categorized as hypereutrophic; therefore, the calculation of the mean percent difference included all water samples collected in the Harris Chain of Lakes. The standard error of the mean for the mean percent differences was calculated for each time period among trophic states and the Harris Chain of Lakes.
Chlorophyll, Secchi depth, and microcystin tables
Probability tables relating chlorophyll concentration and Secchi depth to microcystin concentration in Florida lakes were constructed. The chlorophyll concentrations (N = 856) and Secchi depths (N = 766) that corresponded to the 862 individual water samples assayed for microcystin concentrations were used to construct the chlorophyll, Secchi depth and microcystin concentration categories. Chlorophyll categories were constructed to include at least 50 individual samples, generally at an interval of 1 μ g/L. At higher chlorophyll concentrations there were fewer samples; therefore, the intervals of these chlorophyll categories increased because each group encompassed at least 50 individual samples. CitationBachmann et al. (2003) followed similar methods of unequal-sized chlorophyll groups because many of their data were also clustered at lower chlorophyll concentrations, and if unequal-sized groups had not been used the upper data points would have been poorly defined. Secchi depths were also separated into categories to include at least 50 individual samples per category. Microcystin concentrations were grouped into < 1 μ g/L, 1 ≤ × < 20 μ g/L, and ≥ 20 μ g/L categories.
Statistical analyses
Summary statistics, linear regression analysis, Shapiro-Wilk test for normality, standard errors, correlations, ANOVA and Tukey-Kramer Honest Significant Difference (HSD) were performed using the JMP 5.0.1. statistical package (SAS Institute 1989). ArcMap Version 9.2 was used to create the Florida and Harris Chain of Lakes map. CricketGraph Mac OS 1.5 was used to create time period and percent difference microcystin concentration plots. Total phosphorus, total nitrogen and chlorophyll concentration data were not normally distributed; therefore, the data were transformed using logarithms to meet the requirements of parametric statistics (CitationSnedecor and Cochran 1980). Many of the microcystin concentrations from the 187 Florida lakes and the Harris Chain of Lakes were below levels of detection (< 0.1 μ g/L); therefore, the detection limit value of 0.1 was added to all microcystin concentrations before logarithmic transformations were performed. These transformed microcystin data were used in ANOVA, Tukey-Kramer HSD and correlation analyses. A repeated measures of analysis of variance was used for the cultured Microcystis strain data because the microcystin concentrations in these samples were not independent from one another. Statements of statistical significance imply P ≤ 0.05.
Results
A repeated measures of analysis of variance indicated that freezing the water samples prior to analysis did not influenced the microcystin concentrations over a 150-day freezing period (P = 0.62). Measured microcystin concentrations showed no significant change in concentration for a cultured Microcystis aeruginosa strain (PCC 7806) or for five lake water samples from Beauclaire, Dora, Eustis, Griffin and Harris.
From the 187 Florida lakes, 862 individual water samples were analyzed with averages and ranges similar to CitationCanfield and Hoyer (1988), suggesting these data are representative of a wide range of Florida lakes (). The annual average microcystin concentrations for the 187 lakes averaged 0.4 μ g/L and ranged from < 0.1 to 12 μ g/L. From the annual average of the 187 Florida lakes, 29% had detectable microcystin (≥ 0.1 μ g/L) and 7% exceeded the WHO drinking water guidance value of 1 μ g/L. None of the 187 lakes had annual average microcystin concentrations exceeding the WHO recreational guidance value of 20 μ g/L.
Individual water samples (N = 862) collected from the 187 lakes had microcystin concentrations that averaged 0.4 μ g/L and ranged from < 0.1 to 32 μ g/L. Of these individual water samples, 28% contained detectable microcystin (≥ 0.1 μ g/L) and 7% exceeded the WHO drinking water guidance value of 1 μ g/L. These results are similar to the annual average microcystin concentrations of the 187 Florida lakes. However, three individual water samples, two samples collected from Lake Jessup (Seminole County) and one collected from Lake Hunter (Polk County), contained microcystin concentrations exceeding the WHO recreational guidance value of 20 μ g/L. The highest microcystin concentration measured was 32 μ g/L in December 2006 from Lake Jessup.
An analysis of variance of the log-transformed microcystin concentrations from the 862 individual water samples demonstrated microcystin concentrations were significantly different among time periods (F = 15.5, P < 0.001). A Tukey-Kramer HSD showed the mean microcystin concentration for time period 3 (May–Jun) was significantly lower than periods 1 (Jan–Feb), 5 (Sep–Oct) and 6 (Nov–Dec), while periods 2 (Mar–Apr) and 4 (Jul–Aug) were not significantly different from other time periods.
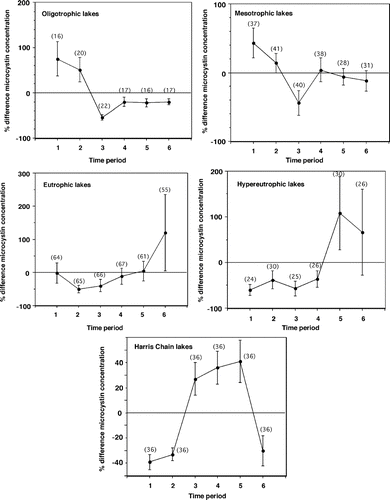
To further evaluate seasonality, the 862 individual water samples collected from the 187 Florida lakes were classified into trophic states based on chlorophyll concentrations. Examining the mean percent differences for each trophic category showed seasonal trends were present among Florida lakes (). For the oligotrophic lakes, the percent difference of microcystin concentration of each time period ranged from 95% below to 611% above the annual average of microcystin concentrations for all of the oligotrophic classified individual water samples. The percent difference for microcystin concentration for mesotrophic lakes ranged from 97% below to 731% above the annual average microcystin concentration; eutrophic lakes ranged from 99% below to 5980% above; and hypereutrophic lakes ranged from 98% below to 2395% above. Oligotrophic and mesotrophic lakes had mean microcystin concentrations above the annual average microcystin concentration from Jan to June. From June to Dec, oligotrophic lakes remained below the annual average microcystin concentration. Mesotrophic lakes were above the annual average microcystin concentration from July to Aug and then fell below from Sep to Dec. Eutrophic lakes were below the annual average microcystin concentration from Jan to Aug; the mean microcystin concentration slightly increased in Sep to Oct and then drastically increased above the annual average during Nov to Dec. Hypereutrophic lakes remained below the annual average microcystin concentration from Jan to Aug and above the annual average from Sep to Dec.
Figure 2 The mean percent difference of microcystin concentrations from annual means averaged across time periods for individual water samples categorized into trophic states and the individual water samples (hypereutrophic) from the Harris Chain of Lakes. The number of individual water samples for each time period is listed. Error bars represent the standard error of the mean for the mean percent differences of each time period.
From annual averages (187 lakes) and 862 individual water samples, the percentage of lakes with detectable microcystin increased with trophic state (). Annual averages in 36% of the eutrophic and 86% of the hypereutrophic lakes had detectable microcystin. Individual water samples in 33% of the eutrophic samples and 76% of the hypereutrophic samples had detectable microcystin.
Table 2 Percent by trophic state category (based on chlorophyll concentrations), in which microcystins were detected (≥ 0.1 μ g/L) for the 187 Florida lakes (annual average) and 862 individual water samples collected Jan to Dec 2006.
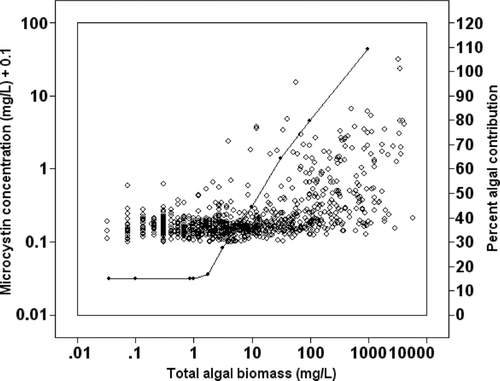
The chlorophyll concentrations that corresponded to the 862 individual water samples measured for microcystin concentrations were converted to total algal biomass (mg/L) using a Florida-specific equation developed by CitationCanfield et al. (1985). These data from the individual water samples suggest that as total algal biomass increased, microcystin concentrations increased (). In Florida lakes, CitationDuarte et al. (1992) showed that as total algal biomass increased the percent algal biomass contribution of cyanobacteria to the phytoplankton community increased. At a total algal biomass of 100 mg/L, where CitationDuarte et al. (1992) suggest cyanobacteria dominate about 90% of the Florida phytoplankton community, microcystin concentrations reached and surpassed concentrations of 1 μ g/L ().
Figure 3 Individual samples (○) measured for microcystin concentration (N = 862) from 187 Florida lakes sampled Jan to Dec 2006. Total algal biomass values were calculated from chlorophyll concentrations using an equation specific to Florida (CitationCanfield et al. 1985). The closed circles (•) represent the relationship between total algal biomass and percent algal contribution for cyanobacteria in Florida lakes as suggested by CitationDuarte et al. (1992).
The constructed chlorophyll and microcystin concentration table suggests that as chlorophyll concentrations increase, the probability of encountering elevated microcystin concentrations increases (). The Secchi depth and microcystin concentration table also suggests that as Secchi depth decreases, the probability of encountering elevated microcystin concentrations increases ().
Table 3 Probability (%) that microcystin concentrations (μ g/L) will exceed the listed WHO microcystin guidance values as suggested by the chlorophyll concentration (μ g/L) categories, which were constructed to include at least 50 of the individual water samples (N = 856) collected from the 187 Florida lakes.
Table 4 Probability (%) that microcystin concentrations (μ g/L) will exceed the listed WHO microcystin guidance values as suggested by the Secchi depth (m) categories, which were constructed to include at least 50 of the individual water samples (N = 788) collected from the 187 Florida lakes.
In the six Harris Chain of Lakes, microcystin concentrations from 216 individual water samples collected at 0.3 m averaged 1.0 μ g/L and ranged from < 0.1 to 3.6 μ g/L (). Of the samples, 57% contained detectable microcystin (≥ 0.1 μ g/L) and 40% were above 1 μ g/L. No individual water samples had microcystin concentrations exceeding 20 μ g/L.
Table 5 Summary statistics for nutrient (μ g/L), chlorophyll (μ g/L), Secchi depth (m) and microcystin concentrations (μ g/L) of 216 individual samples collected from Sep 2006 to Aug 2007 from six Harris Chain of Lakes located in Lake County, FL.
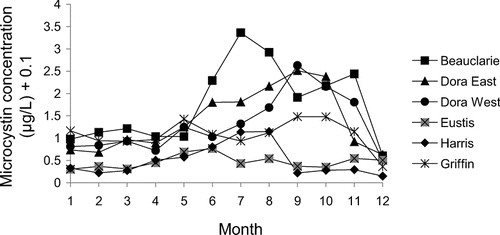
Using the average of the microcystin concentrations from the three stations in each lake, the highest consistently followed the flow of water in the Harris Chain of Lakes (Lake Beauclaire, Lake Dora East, and Lake Dora West; ). Measured concentrations of total phosphorus, total nitrogen and chlorophyll followed the same pattern as microcystin among sampled months. Examining the individual water samples collected in the Harris Chain of Lakes, the correlations of log-transformed nutrient and chlorophyll relationships with log-transformed microcystin concentration were significant but showed a weak relationship for total phosphorus (r = 0.16, P < 0.0001) and chlorophyll (r = 0.35, P < 0.0001). The relationship between total nitrogen and microcystin was stronger (r = 0.44, P < 0.0001).
Figure 4 Mean monthly microcystin concentrations for six Harris Chain of Lakes located in Lake County, FL, sampled Sep 2006 to Aug 2007.
An analysis of variance of the 216 individual water samples collected from the six Harris Chain of Lakes, demonstrated that microcystin concentrations were significantly related to time period (F = 10.4, P < 0.0001). Time periods 1 (Jan–Feb) and 6 (Nov–Dec) were statistically lower than all other time periods, while time periods 3 (May–Jun) and 4 (Jul–Aug) were significantly higher than all other time periods as shown by Tukey-Kramer HSD. The percent difference in microcystin concentration for the Harris Chain of Lakes among time periods ranged from 97% below to 263% above the annual average microcystin concentration of the 216 individual water samples (). During the time periods Jan to Apr and Nov to Dec these hypereutrophic Harris Chain of Lakes were below the annual average. From May to Oct concentrations were above the annual average.
Discussion
The results of this study are reported with caution due to the limitations of the study. Enlisting the Florida LAKEWATCH program was beneficial to achieve the study objective to sample a large number of lakes, but it restricted the sampling design (i.e., water sample collected at a depth of 0.3 m, three open-water sites, lakes sampled six times per year). Spatial coverage of sampling may also be limited, constraining the ability to capture peak blooms and areas of the lake with higher microcystin concentrations. Intense blooms could occur at any time and place within a lake, and wind can concentrate blooms on shorelines or in specific areas of the lake (CitationVerhagen 1994, CitationFalconer et al. 1999). Areas likely to experience these intense blooms events (shorelines and near-shore areas) may have microcystin concentrations orders of magnitude higher than the sampled open-water sites. Or it may be that metalimnetic blooms contain the highest microcystin levels in the lake. The sporadic occurrence of these elevated microcystin concentrations illustrates the spatial and temporal variability in microcystin concentrations within and among individual lakes. Every additional study of microcystin in lakes adds to our ability to predict the occurrence and concentrations of microcystin.
CitationKotak and Zurawell (2007) showed that frequency of occurrence of microcystin increased with trophic status in temperate lakes. In this subtropical lakes study, the highest microcystin concentrations were measured in lakes and water samples classified as hypereutrophic (based on chlorophyll concentrations). Lakes of higher trophic status yielding higher microcystin concentrations can be attributed to the shift in phytoplankton species that occurs with increasing trophic state; green algae dominating oligotrophic waters, diatoms peaking in mesotrophic waters, and cyanobacteria dominating eutrophic waters (CitationWatson et al. 1997). Additionally, increases in nutrients have long been shown to cause an increase in algal biomass (CitationSakamoto 1966, CitationCanfield 1983), higher cell densities (algal blooms) and usually display higher toxin content (CitationChorus and Bartram 1999).
Cyanobacteria have been shown to dominate in oligotrophic Florida lakes (CitationCanfield et al. 1989), and microcystin did occur in oligotrophic lakes during this study. Consequently, it would not be unexpected if microcystins were found in other world-wide oligotrophic lakes as the presence of microcystin is not an indicator of human-induced eutrophication. Despite the trend of increasing microcystin concentrations with increasing trophic state in Florida, only two of the lakes in our study produced water samples with microcystin concentrations above the WHO recreational guidance value.
It is not clear, based on existing research, what genetic and environmental factors control temporal variation in microcystin production (CitationJacoby et al. 2000, CitationJacoby and Kann 2007, CitationKotak and Zurawell 2007); however, seasonality seems to consistently affect the amount of microcystin present. Seasonal changes that occur in lakes include, but are not limited to, stratification, temperature and light fluctuations. One of these factors strongly related to phytoplankton community is water temperature fluctuations (Wetzel 1983). With increasing temperature, algal communities generally shift from green algae to diatoms to blue-green algae, which have been shown to occur in both Florida and temperate lakes (CitationDuarte et al. 1992, CitationPhlips et al. 2007). Microcystis spp. proliferates from 25 C to 28 C (CitationRobarts and Zohary 1987) and increases with intensity of sunlight (CitationJiang et al. 2008). Microcystin concentrations in temperate lakes usually increase beginning in May or June and peak during Sep to Oct (CitationJacoby and Kann 2007, CitationKotak and Zurawell 2007), while in subtropical lakes blooms begin earlier in the year and persist longer (CitationSivonen and Jones 1999). Subtropical lakes offer optimal weather conditions for cyanobacterial growth during most of the year. This survey of the 187 Florida lakes indicates that seasonality does influence microcystin concentrations, with the majority of elevated concentrations (≥ 1.0 μ g/L) occurring from May to November. Similarly, elevated microcystin concentrations were also found to occur May to October in China's subtropical lakes (CitationYang et al. 2006). Annual climate variation may change the timing of these bloom events among years, however, so the findings in this study may not always equate to previous or future years.
The seasonality of microcystin differed among trophic states of the Florida lakes. In the oligotrophic and mesotrophic lakes, microcystin concentrations exceeding the annual average microcystin concentrations occurred earlier in the year (Jan–Apr). In the eutrophic and hypereutrophic lakes, microcystin concentrations exceeding the annual average occurred in the mid-to-later part of the year (Sep–Dec). Compared to the chlorophyll concentrations established by CitationBrown et al. (1998) in Florida lakes, the peaks of microcystin concentrations in the oligotrophic and mesotrophic lakes correspond to lower chlorophyll concentrations, while the peaks in the eutrophic and hypereutrophic lakes followed the monthly chlorophyll peaks. Similar microcystin and chlorophyll concentrations trends have been shown to occur in other subtropical lakes as well as temperate lakes (CitationGiani et al. 2005, CitationWu et al. 2006).
Reviewing the tables of algal bloom frequency established for Florida lakes further suggests that the probability of encountering elevated microcystin concentrations increases with increasing chlorophyll concentrations. These tables are useful for lake managers and users to predict when elevated microcystin concentrations would likely occur (based on chlorophyll concentrations and Secchi depth) in their lake(s). For example, a 80 μ g/L chlorophyll concentration in a Florida lake is expected to exceed the WHO drinking water guidance value 30% of the time; a 0.5 m Secchi depth measurement in a Florida lake is expected to exceed the WHO drinking water guidance value 24% of the time. Although the tables were developed for Florida lakes, these tables may be useful to lake managers in other regions because there is a general relationship between microcystin and chlorophyll in both subtropical and temperate lakes. Furthermore, lake managers must recognize that detecting microcystin is possibile in any lake, but the probability of detection increases significantly in eutrophic and hypereutrophic lakes.
The ratio of microcystin to chlorophyll in the 187 Florida lakes varied from 0 to 0.56 with a mean of 0.2, low values compared to some temperate lake studies. CitationFastner et al. (1999) found microcystin to chlorophyll ratios varied from 0.1 to 0.5 (maximum 1 to 2) in 55 German lakes. CitationJohnston and Jacoby (2003) found higher microcystin to chlorophyll ratios from 0.4 to 0.6 in Lake Sammamish, Washington, USA. The low microcystin to chlorophyll ratios found in Florida may partially explain the low microcystin concentrations found in these productive, cyanobacteria-dominated lakes. Additionally, CitationWu et al. (2006) found similar low microcystin concentrations (mean 0.58 μ g/L) in 30 subtropical, shallow, eutrophic to hypereutrophic lakes. Subtropical lakes, therefore, may have low microcystin concentrations to high cyanobacterial biomass compared to temperate lake systems. Additional research is needed to determine the reasons for these results.
Conclusions
Microcystin concentrations were low (seldom exceeding the WHO drinking water and recreational guidance values) among Florida lakes as measured for 2006. There is a relation between lake trophic state and elevated microcystin concentrations, and some Florida lakes do experience frequent blooms of cyanobacteria. If these eutrophic lakes are utilized by animals and/or humans then microcystin monitoring efforts by professionals would be well warranted. For general recreational uses, the tables incorporating chlorophyll concentration and Secchi depth provide lake users with the probability that microcystin concentrations will exceed the recreational guidance value.
The data obtained in this study may not represent conditions throughout individual lakes through time; therefore, despite the small apparent risk, further, more frequent sampling is probably needed in high use areas (i.e., swimming and water intakes). Volunteer monitoring programs such as Florida LAKEWATCH can gather data useful in assessing overall regional conditions; however, these programs may need to be focused to target lake-specific human risk aspects.
New microcystin technologies are currently available that may offer lake users the option to independently monitor microcystin concentrations. Professionals could use lake volunteers in conjunction with these new methodologies to focus monitoring programs and allow lake users the option to make independent decisions whether to have lake contact. If professionals and volunteers work together, development of long-term databases including many lakes could further advance our understanding of the toxic algal (microcystin) risk.
The results of this study are not limited to Florida lakes. Although differences exist between subtropical and temperate lakes regarding microcystin, there are many more commonalities. It is essential for lake managers to identify the dissimilar relationships and utilize the applicable relationships to assist in monitoring and understanding microcystin problems. CitationKotak and Zurawell (2007) suggest there is an incomplete understanding of the geographic distribution of microcystin primarily due to the lack of monitoring programs and information that remains unpublished. This study identifies not only a subtropical distribution of microcystin but suggests some common relationships applicable to microcystin management worldwide.
Acknowledgments
We thank Drs. Roger Bachmann, Mete Yilmaz, Karl Havens, Mark Brenner and Charles Cichra for their suggestions and reviews of this manuscript. We thank three anonymous reviews for their helpful suggestions. The authors also thank Ms. Christy Horsburgh, Mr. Jesse Stephens, Mrs. Jenney Lazzarino and the LAKEWATCH water chemistry laboratory, staff and volunteers for their assistance during this study.
Notes
*ND represents nondetectable (< 0.1 μ g/L) microcystin concentration.
*ND represents nondetectable (< 0.1 μ g/L) microcystin concentration.
References
- Agusti , S. , Duarte , C. M. and Canfield , D. E. Jr. 1990 . Phytoplankton abundance in Florida lakes: Evidence for the frequent lack of nutrient limitation . Limnol. Oceanogr. , 35 ( 1 ) : 181 – 188 .
- APHA (American Public Health Association) . 1992 . American Water Works Association, and Water Environment Federation. Guidance value methods for the examination of water and wastewater, , 18th edition , Washington , D. C. : APHA .
- Ashworth , C. T. and Mason , M. F. 1946 . Observations on the pathological changes produced by a toxic substance present in blue-green algae (Microcystis aeruginosa) . Am. J. Pathol. , 22 : 369 – 383 .
- Bachmann , R. W. , Hoyer , M. V. and Canfield , D. E. Jr. 2003 . Predicting the frequencies of high chlorophyll levels in Florida lakes from average chlorophyll or nutrient data . Lake Reserv. Manage. , 19 ( 3 ) : 229 – 241 .
- Botes , D. P. , Tuinman , A. A. , Wessels , P. L. , Viljoen , C. C. and Kruger , H. 1984 . The structure of cyanoginosin-LA, a cyclic heptapeptide toxin from the Microcystis aeruginosa . J. Chem. Soc. Perkin T. 1 , : 2311 – 2318 .
- Brown , C. D. , Canfield , D. E. Jr. , Bachmann , R. W. and Hoyer , M. V. 1998 . Seasonal patterns of chlorophyll, nutrient concentrations and Secchi disk transparency in Florida lakes . Lake and Reserv. Manage. , 14 ( 1 ) : 60 – 76 .
- Canfield , D. E. Jr. 1983 . Prediction of chlorophyll a concentrations in Florida lakes: the importance of phosphorus and nitrogen . Water Res. Bull. , 19 ( 2 ) : 255 – 262 .
- Canfield , D. E. Jr. , Brown , C. D. , Bachmann , R. W. and Hoyer , M. V. 2002 . Volunteer lake monitoring: testing the reliability of data collected by the Florida LAKEWATCH program . Lake Reserv. Manage. , 18 ( 1 ) : 1 – 9 .
- Canfield , D. E. Jr. and Hoyer , M. V. 1988 . Regional geology and the chemical and trophic state characteristics of Florida lakes . Lake Reserv. Manage. , 4 ( 1 ) : 21 – 31 .
- Canfield , D. E. Jr. , Linda , S. B. and Hodgson , L. M. 1985 . Chlorophyll-biomass-nutrient relationships for natural assemblages of Florida phytoplankton . Water Resour. Bull. , 21 ( 3 ) : 381 – 391 .
- Canfield , D. E. Jr. , Phlips , E. J. and Duarte , C. M. 1989 . Factors influencing the abundance of blue-green algae in Florida lakes . Can. J. Fish. Aquat. Sci. , 46 : 1232 – 1237 .
- Carmichael , W. W. 1986 . Algal toxins . Adv. Bot. Res. , 12 : 47 – 101 .
- Carmichael , W. W. 1994 . The toxins of cyanobacteria . Sci. Am. , 270 : 78 – 86 .
- Chorus , I. and Bartram , J. , eds. 1999 . Toxic cyanobacteria in water: a guide to their public health consequences, monitoring, and management , E & FN Spon Publishers, London and New York (published on behalf of the World Health Organization) .
- Dawson , R. M. 1998 . Review article: The toxicology of microcystins . Toxicon. , 36 : 953 – 962 .
- D'Elia , C. F. , Steudler , P. A. and Corwin , N. 1977 . Determination of total nitrogen in aqueous samples using persulfate digestion . Limnol. Oceanogr. , 22 : 760 – 764 .
- Duarte , C. M. , Agusti , S. and Canfield , D. E. Jr. 1992 . Patterns in phytoplankton community structure in Florida lakes . Limnol. Oceanogr. , 37 ( 1 ) : 155 – 161 .
- Falconer , I. R. , Bartram , J. , Chorus , I. , Kuiper-Goodman , T. , Utkilen , H. , Burch , M. and Codd , G. A. 1999 . “ Safe levels and safe practices ” . In Toxic cyanobacteria in water: a guide to their public health consequences, monitoring, and management , Edited by: Chorus , I. and Bartram , J. 155 – 177 . London and New York : E & FN Spon . World Health Organization report
- Fastner , J. , Neumann , U. , Wirsing , B. , Weckesser , J. , Wiedner , C. , Nixdorf , B. and Chorus , I. 1999 . Microcystins (hepatotoxic heptapeptides) in German fresh water bodies . Environ. Toxicol. , 14 : 13 – 22 .
- Forsburg , C. and Ryding , S. O. 1980 . Eutrophication parameters and trophic state indices in 30 Swedish waste-receiving lakes . Arch. Hydrobiol. , 89 : 189 – 207 .
- Giani , A. , Bird , D. F. , Prairie , Y. T. and Lawrence , J. F. 2005 . Empirical study of cyanobacterial toxicity along a trophic gradient of lakes . Can. J. Fish. Aquat. Sci. , 62 : 2100 – 2109 .
- Griffith , G. E. , Canfield , D. E. Jr. , Horsburg , C. A. and Omernik , J. M. 1997 . Lake regions of Florida , EPA (U. S. Environmental Protection Agency) . report R-97/127 Corvallis, OR
- Jacoby , J. M. , Collier , D. C. , Welch , E. B. , Hardy , F. J. and Crayton , M. 2000 . Environmental factors associated with a toxic bloom of Microcystis aeruginosa . Can. J. Fish. Aquat. Sci. , 57 : 231 – 240 .
- Jacoby , J. M. and Kann , J. 2007 . The occurrence and response to toxic cyanobacteria in the Pacific Northwest, North America . Lake Reserv. Manage. , 23 : 123 – 143 .
- Jiang , Y. , Ji , B. , Wong , R. N. S. and Wong , M. H. 2008 . Statistical study of the effects of environmental factors on the growth and microcystins production of bloom-forming cyanobacterium- Microcystis aeruginosa . Harmful Algae , 7 : 127 – 136 .
- Jochimsen , E. M. , Carmichael , W. M. , An , J. , Cardo , D. M. , Cookson , S. T. , Christianne , E. M. , Bernadete , M. , Antunes , C. , De Melo Filho , D. A. Lyra , T. M. 1998 . Liver failure and death after exposure to microcystins at a hemodialysis center in Brazil . New Engl. J. Med. , 338 ( 13 ) : 873 – 878 .
- Johnston , B. R. and Jacoby , J. M. 2003 . Cyanobacterial toxicity and migration in a mesotrophic lake in western Washington, USA . Hydrobiologia , 495 : 79 – 91 .
- Kotak , B. G. , Lam , A. K. Y. , Prepas , E. E. , Kenefick , S. L. and Hrudey , S. E. 1995 . Variability of the hepatotoxin microcystin-LR in hypereutrophic drinking water lakes . J. Phycol. , 31 ( 2 ) : 248 – 263 .
- Kotak , B. G. and Zurawell , R. W. 2007 . Cyanobacteria toxins in Canadian freshwaters: A review . Lake Reserv. Manage. , 23 : 109 – 122 .
- Lund , J. W. G. 1969 . “ Phytoplankton ” . In Eutrophication: causes, consequences, correctives , Edited by: Rohlich , G. A. 306 – 300 . Washington , D. C. : National Academy of Sciences .
- Menzel , D. W. and Corwin , N. 1965 . The measurement of total phosphorus in seawater based on the liberation of organically bound fractions by persulfate oxidation . Limnol. Oceanogr. , 10 : 280 – 282 .
- Metcalf , J. S. and Codd , G. A. 2000 . Microwave oven and boiling water bath extraction of hepatotoxins from cyanobacterial cells . FEMS Microbiol. Lett. , 184 : 241 – 246 .
- Murphy , J. and Riley , J. P. 1962 . A modified single solution method for determination of phosphate in natural waters . Anal. Chim. Acta , 27 : 31 – 36 .
- Phlips , E. J. , Hendrickson , J. , Quinlan , E. L. and Cichra , M. 2007 . Meteorological influences on algal bloom potential in a nutrient-rich blackwater river . Freshwater Bio. , 52 : 2141 – 2155 .
- Robarts , R. D. and Zohary , T. 1987 . Temperature effects on photosynthetic capacity, respiration, and growth rates of bloom-forming cyanobacteria . N. Z. J. Mar. Freshw. Res. , 21 : 391 – 399 .
- Sakamoto , M. 1966 . Primary production by phytoplankton community in some Japanese lakes and its dependence on lake depth . Arch. Hydrobiol. , 62 ( 1 ) : 1 – 28 .
- Sartory , D. P. and Grobbelarr , J. U. 1984 . Extraction of chlorophyll a from freshwater phytoplankton for spectrophotometric analysis . Hydrobiologia , 114 : 117 – 187 .
- Simal , J. , Lage , M. A. and Iglesias , I. 1985 . Second derivative ultraviolet spectroscopy and sulfamic acid for determination of nitrates in water . J. Assoc. Off. Anal. Chem. , 68 : 962 – 964 .
- Sivonen , K. and Jones , G. 1999 . “ Cyanobacterial toxins ” . In Toxic cyanobacteria in water: a guide to their public health consequences, monitoring, and management , Edited by: Chorus , I. and Bartram , J. 41 – 111 . London and New York : E & FN Spon . World Health Organization report
- Snedecor , G. W. and Cochran , W. G. 1980 . Statistical methods, , 7th Ed. , Ames , IA : The Iowa State University Press .
- Stanier , R. Y. , Kunisawa , R. , Mandel , M. and Cohenbaz , G. 1971 . Purification and properties of unicellular blue-green algae (Order Chroococcales) . Bacteriol. Rev. , 35 : 171 – 205 .
- Steyn , D. G. 1943 . Poisoning of animals by algae on dams and pans . Farm S. Afr. , 18 : 489 – 510 .
- Verhagen , J. H. G. 1994 . Modeling phytoplankton patchiness under the influence of wind-driven currents in lakes . Limnol. Oceanogr. , 39 ( 7 ) : 1551 – 1565 .
- Watson , S. B. , McCauley , E. and Downing , J. A. 1997 . Patterns in phytoplankton taxonomic composition across temperate lakes of differing nutrient status . Limnol. Oceanogr. , 42 ( 3 ) : 487 – 495 .
- Wetzel , R. G. 1966 . Variations in productivity of Goose and hypereutrophic Sylvan lakes, Indiana . Investigations of Indiana Lakes and Streams , 7 : 147 – 184 .
- Williams , C. D. v , Aubel , M. T. , Chapman , A. D. and D' Aiuto , P. E. 2007 . Identification of cyanobacteria toxins in Florida's freshwater systems . Lake Reserv. Manage. , 23 : 144 – 152 .
- Wollin , K. M. 1987 . Nitrate determination in surface waters as an example of the application of UV derivative spectrometry to environmental analysis . Acta Hydrochim. Hydrobiol. , 15 : 459 – 469 .
- Wu , S. K. , Xie , P. , Liang , G. D. , Wang , S. B. and Liang , X. M. 2006 . Relationships between microcystins and environmental parameters in 30 subtropical shallow lakes along the Yangtze River, China . Freshwater Biol. , 51 : 2309 – 2319 .
- Yang , H. , Xie , P. , Xu , J. , Zheng , L. , Deng , D. , Zhou , Q. and Wu , S. 2006 . Seasonal variation of microcystin concentration in Lake Chaohu, a shallow subtropical lake in the People's Republic of China . Bull. Environ. Contam. Toxicol. , 77 : 367 – 374 .