
Abstract
Background: The Oxford classification has been widely used in IgA nephropathy. However, its clinical usefulness of determining immunosuppression is unknown.
Aim: Whether the Oxford classification could predict the development of proteinuria ≥1 g/g Cr and worsening kidney function, as well as the clinical efficacy of corticosteroid treatment according to each histologic variable of the Oxford-MEST.
Methods: We included 377 patients with early-stage IgA nephropathy. The study endpoints were the development of a heavy proteinuria and a decline renal function.
Results: The results showed that among the Oxford-MEST lesions, only M1 predicted the risk of the development of proteinuria ≥1.0 g/g Cr compared to other lesions in a time-varying Cox model adjusted for multiple confounding factors. In addition, the risk of reaching a 30% decline in eGFR was significantly higher in patients with M1 than in those with M0. Furthermore, patients with M1 had a greater decline of eGFR than patients with M0. However, steroid treatment in M1 lesion was not associated with improving clinical outcomes in the unmatched and propensity score matched cohort.
Conclusions: This finding may provide a rationale for using the Oxford classification as a guidance to initiate immunosuppression in the early stages of IgA nephropathy.
M1 has independently predictive role among the Oxford lesions in IgA nephropathy.
Oxford classification should be defined during pathologic approach.
Decision of starting immunosuppression according to the Oxford lesions.
KEY MESSAGES
Introduction
Primary IgA nephropathy (IgAN) is the most common type of glomerulonephritis worldwide, and its incidence is particularly higher in Asia than in North America or Europe (Citation1). As glomerulonephritis is the third most common cause of end-stage renal disease (ESRD), and given the devastating medical and socio-economic burdens in patients with chronic kidney disease, diverse therapeutic options should be considered to slow the progression of kidney disease (Citation2–4).
Several therapeutic strategies, such as inhibition of the renin-angiotensin-aldosterone system, strict control of blood pressure, low protein intake (Citation5), and dyslipidemia regulation (Citation6), have been used in the management of IgAN. However, these treatments are generally effective in the early stages of IgAN, and their clinical efficacy in the advanced stages is yet unproven. In fact, IgAN often progresses despite the maximal use of renin-angiotensin system blockade (RASB), alone or in combination with other strategies to reduce proteinuria. The 2012 Kidney Disease: Improving Global Outcomes (KDIGO) guidelines suggest a 6-month course of glucocorticoid treatment in patients with persistently elevated urinary protein excretion (≥1 g/day) despite 3–6 months of proper supportive care, and with preserved kidney function with an estimated glomerular filtration rate (eGFR) of ≥50 ml/min/1.73 m2 (Citation7). However, findings from previous randomized controlled trials that examined the effect of glucocorticoids have yielded inconclusive results (Citation8–10); thus, the suggestion by the KDIGO guideline is not confirmative. In clinical practice, the use of glucocorticoids is generally determined by using clinical biomarkers such as declining kidney function and increasing proteinuria. Moreover, whether pathologic classification systems can aid in determining immunosuppression is currently unknown.
Recently, the Oxford classification was proposed by the Working Group of the International IgA Nephropathy Network and the Renal Pathology Society (Citation11,Citation12), and has been validated through several studies (Citation13–22). This classification identified four pathological components: mesangial hypercellularity (M1), endocapillary proliferation (E1), segmental glomerulosclerosis/adhesion (S1), and tubular atrophy/interstitial fibrosis (T1 or T2). Of note, this classification aids in predicting patient outcome (Citation11,Citation12). In line with these studies, we previously reported that adding the Oxford classification to clinical parameters increased the predictability for doubling of the baseline serum creatinine (Cr) levels and ESRD (Citation23). Interestingly, a recent study revealed that M1 at biopsy provided a comparable prediction of adverse outcomes to clinical data measured at 2 years, suggesting a potential role of this component in early risk stratification (Citation21). However, this study examined a 50% reduction in eGFR or ESRD as a study outcome, which develops long after proteinuria appears. From a therapeutic perspective, it would be interesting to investigate which components of the Oxford-MEST can predict the development of significant proteinuria because immunosuppression is generally effective in patients with moderate urinary protein excretion and preserved kidney function. Currently, it is unknown whether this classification can aid in the decision concerning the use of immunosuppression. Thus, we investigated whether individual components of the Oxford-MEST could predict the development of proteinuria (≥1.0 g/g Cr) and the progression of kidney disease in patients with low-grade proteinuria (<1.0 g/g Cr) and early-stage IgAN. We further examined the clinical effectiveness of glucocorticoid treatment according to the Oxford classification.
Materials and methods
Ethics statement
The study was performed in accordance with the Declaration of Helsinki and approved by the Institutional Review Board (IRB) of the Yonsei University Health System (YUHS) Clinical Trial Center. Although all patients in this study were informed about the description of investigations, this was conducted as a medical record-based retrospective analysis, and the included subjects were anonymized. Therefore, the IRB approved the exemption from obtaining written consent.
Study participants
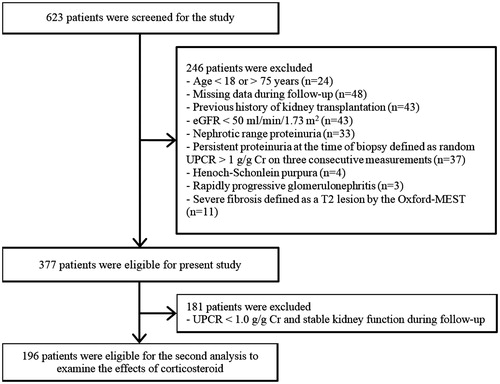
We conducted an observational study in 623 patients with biopsy-proven IgAN between January 2005 and December 2014 from the YUHS and National Health Insurance Service Ilsan Hospital. A flow diagram of depicting selection of the participants is presented in . We excluded 246 patients who met the following criteria: (Citation1) age <18 or >75 years; (Citation2) missing data during follow-up; (Citation3) history of kidney transplantation; 4) eGFR <50 ml/min/1.73 m2; (Citation5) nephrotic-range proteinuria (≥3.5 g/g Cr); (Citation6) persistent proteinuria at biopsy, defined as random urine protein-to-Cr ratio (UPCR) > 1.0 g/g Cr on three consecutive measurements; (Citation7) Henoch–Schönlein purpura; (Citation8) rapidly progressive glomerulonephritis; or (Citation9) severe fibrosis classified as T2 in the Oxford-MEST. If laboratory tests were done within 1 month prior to biopsy, these were considered the first measurement. Twenty-seven (7.2%) patients had a single measurement of UPCR ≥1.0 g/g Cr at or before the time of biopsy and proteinuria decreased to <1.0 g/g Cr on two subsequent tests in these patients. These patients were considered to have transiently elevated proteinuria, and thus were included in the analysis. Therefore, a total of 377 IgAN patients were included for the primary analysis. In the secondary analysis to examine the effects of glucocorticoids, 181 patients with UPCR <1.0 g/g Cr and/or stable kidney function during follow-up were additionally excluded (). These patients were unlikely to require glucocorticoids treatment. We generally followed the glucocorticoid protocol suggested by Pozzi et al. (Citation24,Citation25). Glucocorticoid users were defined as patients who received glucocorticoids for ≥3 months. The use of RASB was defined as more than 90 days’ prescription of RASB during the follow-up period.
Figure 1. Flow diagram of the study. Abbreviation: eGFR: estimated glomerular filtration rate; UPCR: urine protein-to-creatinine ratio.
Clinical, biochemical, and histologic data collection
By using the database from the Glomerulonephritis Registry of the two medical centers, demographic, clinical, and biochemical data at the time of renal biopsy, including age, sex, blood pressure, and body mass index, were retrieved and considered baseline data. Body mass index was calculated as weight/height2 (kg/m2). The following biochemical laboratory data were also collected: blood urea nitrogen, serum Cr, UPCR, serum IgA, hemoglobin, fasting blood glucose, serum albumin, total cholesterol, triglyceride, high-density lipoprotein cholesterol (HDL-C), low-density lipoprotein cholesterol (LDL-C), and high sensitivity C-reactive protein (hs-CRP). The eGFR was calculated by using the chronic kidney disease epidemiology collaboration equation (Citation26). Serum total cholesterol, HDL-C, LDL-C, and triglyceride levels were measured through enzymatic colorimetry with an autoanalyzer (Hitachi 7150; Hitachi Ltd., Tokyo, Japan), and hs-CRP levels were determined through a latex-enhanced immunonephelometric method by using a BNII analyzer (Dade Behring, Newark, DE). All renal biopsy specimens were reassessed by one pathologist blinded to the patients’ clinical data, according to the Oxford classification.
Follow-up and endpoints
Follow-up data were recorded at 3-month intervals. The study endpoints were the development of persistent UPCR ≥1 g/g Cr and the onset of a 30% decline in eGFR during follow-up. These were defined as a sustained increase in UPCR ≥1 g/g Cr and a sustained decrease in eGFR >30% for at least three consecutive measurements. The first of these consecutive measurements was retrospectively designated to be the study endpoint.
Statistical analysis
Continuous variables are presented as means and SD for data with a normal distribution, or median with interquartile range for data with a skewed distribution. Categorical variables were expressed as counts and percentages. The normality of distribution was ascertained with the Kolmogorov–Smirnov test. To compare differences between Oxford classifications, Student’s t-test or the Mann–Whitney U test was used for continuous variables, and the chi-square test or Fisher’s exact test was used for categorical variables. The cumulative renal survival rates were estimated with Kaplan–Meier analysis and a log-rank test. Survival time was defined as the interval between the time of biopsy and the onset of the endpoint or last follow-up. Cox proportional hazard models were constructed to determine the association between the Oxford-MEST and the development of UPCR ≥1 g/g Cr or a 30% decline in eGFR. Because proteinuria, blood pressure, and eGFR were highly variable during follow-up, these variables were modeled as time-varying covariates (Citation27,Citation28) by using data measured at 3-month intervals. We further analyzed whether glucocorticoid treatment could reduce proteinuria and improve kidney function, through propensity score (PS) matching. All results are expressed as the hazard ratio (HR) and 95% confidence interval (CI). To determine the predictability of each component of the Oxford-MEST for the development of persistent proteinuria, C-statistics with Harrell’s C-index of each Cox model was performed. The PS for the steroid nonuser or user has been drawn by using multiple logistic regression analysis without considering outcome. All available covariates were used for present model. Using the Greedy 5–1 digit match algorithm, we constructed PS-matched pairs without replacement (a 1:1 match) (Citation29,Citation30). To be more concrete, each subject in the steroid user group was matched to an individual in the steroid nonuser group who had a PS that was identical to 5 digits. If this could not be done, we then proceeded sequentially to the next highest digit match (a 4-, 3-, 2-, or 1-digit match) on PS to make “next-best” matches. After all PS matches were created, we evaluated the balance of baseline covariates between the two groups by using paired t-test or Mann–Whitney U test for continuous variables, and McNemar test for categorical variables. Statistical analyses were performed with SPSS for Windows version 23.0 (IBM Corp., Armonk, NY) and SAS version 9.2 (SAS Inc., Cary, NC). A p value <.05 was considered significant.
Results
Baseline characteristics
The baseline characteristics of the study subjects are presented in and . Their mean age was 38.5 ± 13.0 years, and 182 (47.9%) were men. Among 377 patients, 74 (19.6%), 85 (22.5%), 231 (61.3%), and 40 (10.6%) were classified as having M1, E1, S1, and T1 pathologic lesions according to the Oxford classification, respectively. The mean eGFR was 106.4 ± 40.4 ml/min/1.73 m2, and the median UPCR was 0.56 (0.33–0.77) g/g Cr. At baseline, eGFR was significantly lower in patients with M1 (97.6 ± 35.7 versus 109.0 ± 41.1 ml/min/1.73 m2, p = .03), S1 (103.4 ± 35.9 versus 112.0 ± 46.2 ml/min/1.73 m2, p = .04), and T1 (87.2 ± 37.6 versus 109.1 ± 40.1 ml/min/1.73 m2, p = .01) than in patients without these components, whereas UPCR was significantly higher across all the Oxford-MEST lesions [M, 0.67 (0.38–0.82) versus 0.54 (0.31–0.75) g/g Cr, p = .01; E, 0.65 (0.48–0.82) versus 0.53 (0.30–0.74) g/g Cr, p = .01; S, 0.62 (0.39–0.81) versus 0.46 (0.18–0.70) g/g Cr, p < .001; T, 0.68 (0.41–0.86) versus 0.55 (0.31–0.76) g/g Cr, p = .01]. Patients with T1 were significantly older and had higher mean arterial pressure (MAP) than those with T0 ( and ).
Table 1. Baseline characteristics according to the Oxford classification (M and E, n = 377).
Table 2. Baseline characteristics according to the Oxford classification (S and T, n = 377).
M1 is an independent predictor for the development of persistent proteinuria in early-stage IgAN
During a median follow-up duration of 43.5 (17.6–68.9) months, persistent proteinuria >1.0 g/g Cr occurred in 48 (12.7%) patients. In these patients, the mean duration until UPCR of ≥1 g/g Cr was 43.6 ± 33.8 months. There were 21 (28.4%, p < .001), 13 (15.3%, p = .42), 33 (14.3%, p = .26), and 12 (30.0%, p = .01) patients with M1, E1, S1, and T1 who developed persistent proteinuria, as compared with 27 (8.9%), 35 (15.3%), 15 (10.3%), and 36 (10.7%) patients with M0, E0, S0, and T0, respectively. Kaplan–Meier plots also showed that the time to the development of persistent proteinuria was significantly shorter in patients with M1 (p < .001), S1 (p = .03), and T1 (p = .01) (). The time course of UPCR at every 6-month follow-up according to each component of the Oxford classification is shown in . To investigate the association between each component of the Oxford-MEST and persistent proteinuria, time-varying Cox models were constructed. The unadjusted HRs (95% CIs) for each MEST were 3.039 (1.69–5.48, p < .001), 1.577 (0.83–3.02, p = .17), 1.995 (1.05–3.79, p = .03), and 2.241 (1.15–4.36, p = .02). In a multivariable Cox model with proteinuria, blood pressure, and eGFR being used as time-varying covariates, M1 was significantly associated with an increased risk of developing persistent proteinuria (HR, 2.643; 95% CI: 2.22–3.15; p < .001) after adjustment for age, sex, MAP, UPCR, and eGFR, whereas E, S, and T lesions failed to predict this endpoint. When all four components were entered into the model, only M1 remained a significant predictor of persistent proteinuria (HR, 2.381; 95% CI: 1.98–2.87; p < .001, ).
Figure 2. Kaplan–Meier plots for the development of persistent proteinuria according to the Oxford-MEST.
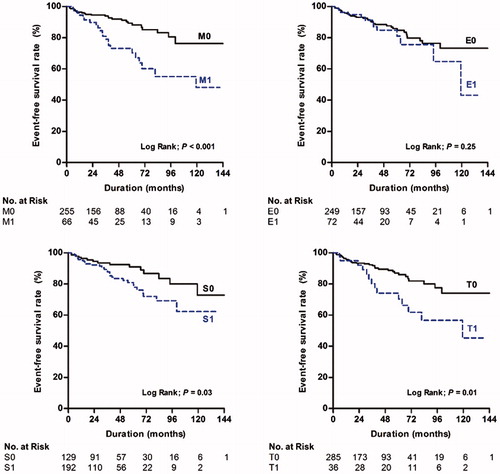
Figure 3. Time course of UPCR according to Oxford classification. Each point was demonstrated as the mean values with standard errors of UPCR on every 6-month follow-up. Abbreviation: UPCR: urine protein-to-creatinine ratio.
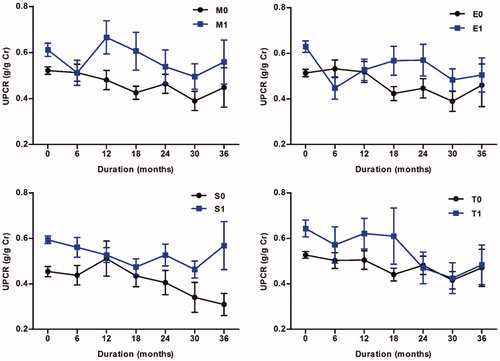
Table 3. Cox regression model with time-dependent covariates for the association of Oxford classification with development of persistent proteinuria (n = 377).
We validated these findings by performing a subgroup analysis excluding patients who had transiently elevated proteinuria of at the time of biopsy. There were 27 (7.2%) patients whose proteinuria of >1.0 g/g Cr at the time of biopsy but declined <1.0 g/g Cr at two subsequent measurements. In the same analysis excluding these patients, M1 was significantly associated with the development of persistent proteinuria of >1.0 g/g Cr [HR 2.596, 95% CI (1.16–5.80), p = .02, Supplementary Table S1].
To assess the predictive power of the Oxford-MEST for persistent proteinuria, Harrell’s C-index for each Cox model () was determined. The C-statistics of a model with M was 0.703 (95% CI: 0.62–0.79) as compared with those of models with E (0.666; 95% CI: 0.57–0.76; p = .02), S (0.663; 95% CI: 0.57–0.75; p = .01), and T (0.665; 95% CI: 0.57–0.75; p = .03). Receiver operating characteristics analysis for the Oxford-MEST revealed that the area under the curve for a model with M was significantly larger than those for E, S, and T lesions (M, 0.749; E, 0.684; S, 0.685; T, 0.650; p = .04; ).
Figure 4. Receiver operating characteristics curve for the development of persistent proteinuria by the Oxford-MEST.
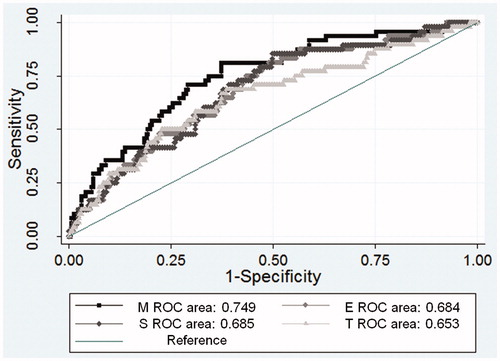
Table 4. C-Statistics for prediction of the development of persistent proteinuria using multivariate Cox’s regression models.
M1 is significantly associated with kidney disease progression
Next, we evaluated whether the Oxford-MEST could predict the progression of kidney disease in the early stages of IgAN. During follow-up, 52 (13.8%) patients reached a 30% decline in eGFR. Because we included patients with early-stage IgAN and preserved kidney function, no patient developed ESRD before reaching a 30% decline in eGFR. Moreover, no cases of death occurred during follow-up. A 30% decline in eGFR was reached more frequently in patients with M1 (18.9%) than in those with M0 (12.5%) (p = .15). In a multivariable analysis adjusted for age, sex, MAP, eGFR, UPCR, RASB, and glucocorticoid treatment, M1 conferred a 3.5-fold increased risk of reaching a 30% decline in eGFR (HR, 3.546; 95% CI: 1.19–10.58; p = .02, ) compared with M0. There was no significant difference in the development of a 30% decline in eGFR between patients with E1, S1, and T1 and those without these components. Furthermore, patients with M1 had a greater eGFR decline than those with M0 (−1.68 ± 0.91 versus −0.73 ± 0.92 ml/min/1.73 m2/year, p < .001; data not shown). We also constructed similar analysis in nonsteroid user group, but the results showed similar findings (M1, p = .03; E1, p = .54; S1, p = .11; T1, p = .9).
Table 5. Cox proportional hazard regression analysis for the association of Oxford classification with a 30% decline in eGFR (n = 377).
Glucocorticoid treatment reduced proteinuria but did not prevent kidney disease progression in IgAN patients with M1
Because the current guideline suggests the use of glucocorticoids in patients with proteinuria >1.0 g/day, and we found that M1 predicted the development of persistent proteinuria better than E1, S1, and T1 lesions, we further analyzed whether glucocorticoids could attenuate the progression of kidney disease in patients with M1. Because this study only included early IgAN subjects, and nephrotic syndrome or severe IgAN such as RPGN or T2 lesion were initially excluded, there were no patients receiving immunosuppressive agent including cyclophosphamide or cyclosporine. A total 67 (17.8%) patients received any steroid therapy in present analysis. Among them, seven patients stopped earlier before 3 months of treatment duration due to non-compliance or side effects. Excluding these patients, there were 21 (28.4%), 24 (28.2%), 50 (21.7%), and 14 (35.0%) patients with M1, E1, S1, and T1, respectively, who were treated with steroid therapy >3 months.
Among 74 (19.6%) patients with M1, 16 (21.6%) patients were excluded from this second analysis because these patients maintained UPCR levels of <1.0 g/g Cr and stable kidney function throughout the study. The remaining 58 (78.4%) M1 patients developed persistent increased UPCR of >1.0 g/g Cr during follow-up. Of these patients, 21 (36.2%) were treated with glucocorticoids. The mean duration from the time point of UPCR of >1.0 g/g Cr to initiation of steroid treatment was 5.7 ± 3.2 months. Because we generally followed the 6-month glucocorticoid treatment protocol of Pozzi et al. (Citation24,Citation25), we compared the difference in proteinuria during the 6-month treatment period. Glucocorticoid administration significantly reduced proteinuria from 1.71 to 0.69 g/g Cr in 21 glucocorticoid users (p < .001; ). Maximal supportive care without glucocorticoid decreased proteinuria, but it did not reach statistical significance (). We also evaluated renal outcome between glucocorticoid users and nonusers in 58 patients with M1 who had persistent proteinuria. There were significant differences in baseline characteristics between the two groups. To minimize biased results caused by these unbalanced baseline characteristics, 1:1 PS matching was applied. PS matching yielded 18 matched pairs of patients. As a result, the baseline characteristics were well balanced between glucocorticoid users and nonusers (). In the unmatched cohort, there was no difference in the development of a 30% decline in eGFR with various Cox models. Similarly, in the matched cohort, glucocorticoid use was not associated with a decreased risk of reaching a 30% decline in eGFR and the rates of decline in eGFR did not differ between two groups (HR, 2.360; 95% CI: 0.63–8.78; p = .20; , )). Although glucocorticoid treatment initially reduced proteinuria, proteinuria level slightly increased after discontinuation of this drug, and the overall proteinuria level became similar between two groups during follow-up period (). We also performed similar analyses for E, S, and T scores to evaluate the effect of glucocorticoid treatment on kidney disease progression, but significant associations were not observed for these scores in all models (Supplementary Table S2). These results were similar in matched models (data not shown).
Figure 5. The changes in UPCR after 6 months with (A) and without (B) glucocorticoids treatment. Abbreviation: UPCR: urine protein-to-creatinine ratio.
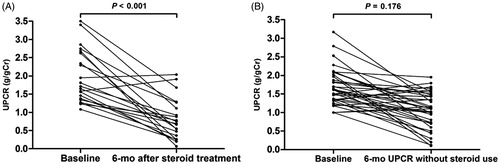
Figure 6. A Kaplan–Meier plot and eGFR decline rate in the matched cohort of glucocorticoid users versus nonusers with M1 (A). The mean with standard errors were used in time course of eGFR (B) and UPCR figures (C). Abbreviation: eGFR: estimated glomerular filtration rate; UPCR: urine protein-to-creatinine ratio.
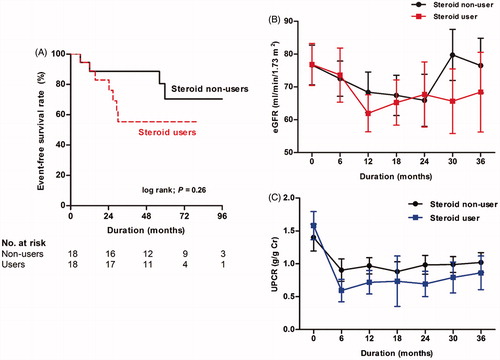
Table 6. Baseline characteristics in the unmatched and matched cohort according to glucocorticoids treatment.
Table 7. Cox proportional hazard analysis for the effect of glucocorticoid treatment on a 30% decline in eGFR with the unmatched and matched M1 cohort.
Discussion
We investigated which components of the Oxford-MEST can predict the development of persistent proteinuria in the early stages of IgAN, and whether pathologic classification can aid in determining the use of glucocorticoids. We showed that the M1 component of the Oxford classification was significantly associated with the development of persistent proteinuria and predicted the progression of kidney disease in patients with IgAN. Furthermore, glucocorticoid administration reduced proteinuria in patients with M1 and UPCR ≥1.0 g/g Cr. However, immunosuppression did not improve kidney function in these patients. Our findings suggest that M1 can be an early biomarker for predicting adverse outcomes and can also help in the decision-making concerning initiating immunosuppression in IgAN.
It has been controversial whether pathologic classification can improve the predictability of kidney disease progression in addition to clinical factors such as proteinuria, kidney function, and blood pressure (Citation31). To overcome this limitation, the Oxford classification was proposed by the Working Group of the International IgA Nephropathy Network and the Renal Pathology Society in 2009 (11) and has been widely used in clinical practice. Many studies have attempted to validate the clinical usefulness of this classification, and found that the Oxford-MEST is useful in determining prognosis independent of well-known clinical risk factors (Citation12–23,Citation32). However, the endpoint of these studies was the progression of kidney disease, such as a 50% decline in eGFR and the development of ESRD. These outcomes occur at the later stages of IgAN, long after proteinuria develops. Proteinuria is a strong predictor of adverse renal outcomes, and substantial proteinuria generally precedes deterioration in kidney function (Citation33). Accordingly, identifying an early biomarker to predict the development of proteinuria would be valuable. Therefore, we sought to establish such a biomarker among four components of the Oxford-MEST. To this end, we included 377 patients with IgAN who had eGFR >50 ml/min/1.73 m2 and initially had persistent proteinuria of <1.0 g/g Cr. Our results showed that M1 was significantly associated with an increased risk of developing persistent proteinuria, suggesting the clinical utility of the M score as an early indicator of progression.
Our findings corroborated those from a recent study by Barbour et al. (Citation21) They performed a post-hoc analysis of patients from the Oxford derivation, North American validation, and VALIGA studies, and found that M score at the time of biopsy was superior to 2-year clinical factors, such as 2-year average of proteinuria and MAP, and baseline eGFR at biopsy, in predicting the development of a 50% decline in eGFR or ESRD. However, Gutierrez et al. (Citation34) evaluated 141 patients with early-stage IgAN and found that segmental lesion was the only factor that predicted the development of a 50% increase in serum Cr level. Moreover, they also showed that the presence of M1 showed a significant association with the absence of clinical remission of disease, suggesting that proteinuria or hematuria was unlikely to disappear in patients with M1. The heterogeneity of the study population can explain these discrepant findings among studies. In fact, Barbour et al. studied patients from three different cohorts, thus involving a wide spectrum of proteinuria and kidney function. In contrast, patients in the latter study had minimal or no proteinuria at presentation, and the median proteinuria in these patients was 0.2 (0.1–0.4) g/24 h. Our study cohort was closer to that of Barbour et al. because we included patients who had preserved kidney function and mild proteinuria at presentation. Of note, proteinuria and eGFR become highly variable as kidney disease progresses; thus, we applied the Cox model with these variables being considered as time-varying covariates. Previous studies used baseline proteinuria or time-averaged proteinuria; however, these may not reflect a true risk that can vary depending on changing covariates by time. We clearly showed that, in this time-varying Cox model, M1 predicted adverse renal outcomes better than the other lesions. It should be noted that the study endpoint was the development of persistent proteinuria >1.0 g/g Cr, which is the time point when glucocorticoid treatment can be initiated as suggested by the current guideline on IgAN (Citation7). Therefore, our robust findings can provide a rationale for the use of the Oxford classification as an indicator in determining immunosuppressive therapy in IgAN patients.
The underlying mechanistic link responsible for the relationship between M1 and persistent proteinuria remains largely speculative. There has been experimental evidence supporting this association. The hallmark of IgAN is the mesangial deposition of IgA1-immune complexes (Citation22,Citation35). Generally, the deposition of IgA1 within the mesangium is the first event that can subsequently damage other glomerular structures before E, S, and T lesions develop (Citation35). In the α1KI model, in which mouse immunoglobulin is replaced by IgA1 with human heavy chains and immune responses, IgA1 deposition within the mesangium preceded hematuria, proteinuria, or increased Cr levels, indicating mesangial deposition is the early lesion before clinical prognostic factors becomes evident during the pathophysiologic process of IgAN (Citation36). Another in vitro study suggested dysregulated mesangial cells as an initiating factor leading to podocytopathy (Citation37). The authors found that humoral factors, including tumor necrosis factor-α and transforming growth factor-β, released from mesangial cells altered the glomerular permeability, thus resulting in proteinuria. This experimental evidence can be extrapolated to clinical human IgAN. In fact, many studies have reported that M1 remained an independent predictor of adverse renal outcomes regardless of clinical factors, whereas E and/or S showed conflicting results (Citation12,Citation15,Citation19,Citation21,Citation22).
Because M1 was found to be an independent predictor of persistent proteinuria in our study, we further analyzed whether immunosuppression could improve renal outcomes in patients with M1. We showed that glucocorticoid administration resulted in proteinuria reduction. However, there was no significant difference in the progression of kidney disease between glucocorticoid users and nonusers. It has long been debated whether immunosuppression can improve renal outcomes in IgAN. The KDIGO guidelines suggest the use of glucocorticoids in patients with persistent proteinuria ≥1 g/day despite optimal supportive care for 3–6 months (Citation7). This suggestion was made largely based on three prior randomized controlled trials (Citation24,Citation38,Citation39). However, these studies have been criticized because RASBs were not fully administered during the study period, and blood pressure was not adequately controlled in their extended observation (Citation25). A recently published randomized controlled trial by the Supportive Versus Immunosuppressive Therapy for the Treatment of Progressive IgA Nephropathy (STOP-IgAN) investigators raised question against the prevailing notion about the protective effects of immunosuppression (Citation8). They failed to prove the superiority of immunosuppression over intensive supportive care in attenuating eGFR decline, although clinical remission defined as a UPCR <0.2 g/g Cr was more often achieved with immunosuppression. Our findings were partly in agreement with those of the STOP-IgAN trial. We further analyzed the effects of glucocorticoids in all 377 patients, and found that immunosuppressive therapy did not improve renal outcomes compared with those without immunosuppression (data not shown). However, our study was not a randomized controlled trial and was observational in nature; thus, the results should be interpreted with caution. It is possible that glucocorticoids were given to patients with more advanced stages of IgAN, as evidenced by an unbalanced baseline proteinuria in the unmatched cohort (). Nevertheless, given the positive effects of immunosuppression on full remission and the relative short follow-up in the STOP-IgAN trial, further investigation on whether immunosuppression can result in improved kidney function is required with a longer follow-up.
Our study has several limitations. First, this is an observational study in which the influences of confounding factors could not be fully excluded. Particularly, in the analysis of the effects of glucocorticoids, several clinically important variables were not balanced between groups. To overcome these limitations, we used PS matching and mitigated differences in baseline characteristics at biopsy. Despite these efforts, unknown confounding factors might still remain. In addition, one may raise a concern regarding potential impact of treatment bias because corticosteroids were more administered in patients having the positive Oxford-MEST score. To clarify this, we analyzed the data excluding corticosteroid users and found that only M1 was a significant predictor of adverse renal outcome. Furthermore, there were no interaction terms between steroid therapy and pathologic lesions (data not shown). The observational nature of our study and a relatively small number of patients limit in-depth analysis on the relationship between pathological lesions and steroid responsiveness. Given the strengths of the Oxford classification that specifically recognize pathological features associated with progression, further well-designed randomized controlled studies are required to delineate the relationships between the Oxford-MEST lesions and treatment responsiveness. Second, the administration of immunosuppression was dependent on the decision of individual physicians. Furthermore, the concept of intensive supportive care was not fully established. Other therapeutic strategies to reduce proteinuria, such as a low protein diet or combination treatment with other medications, were not standardized. Nevertheless, RASBs were used in 283 (75.1%) patients during follow-up, and blood pressure was maintained <130/85 mmHg in approximately 80% of patients. This means that we attempted to provide maximal supportive care, as the guideline suggested. Third, our findings may not be extrapolated to other populations because this study included only Korean subjects. It should be noted that ethnicity may affect clinical outcomes according to the Oxford-MEST score. Interestingly, M1 but not E1 lesion had prognostic implication in Chinese patients with IgAN (Citation16,Citation18,Citation22,Citation40), and pathologic lesions did not influence E lesion appeared to have a lesser impact on renal outcome in Asian patients (Citation41). Studies involving diverse ethnic populations are rare. Even though there was, few Asian subjects were included, thus detailed comparative analysis was not feasible. Finally, in this study, patients with T1 did not confer an increased risk of developing persistent proteinuria. Many studies have universally shown that tubulointerstitial fibrosis is the strongest predictor of adverse outcomes (Citation12–23,Citation34,Citation41,Citation42). Because patients had preserved kidney function and a UPCR of <1.0 g/g Cr, there were only 42 (11.1%) patients who had T1 in our study. Thus, the sample size is too small to identify an independent association with adverse outcome, although T1 was more likely to reach a 30% decline in eGFR in the univariate analysis.
In conclusion, we showed that the Oxford M1 component predicted the development of persistent proteinuria, which was significantly associated with worsening kidney function. This finding suggests that the Oxford classification can aid in determining immunosuppression in the early stages of IgAN. However, steroid treatment was not associated with improving clinical outcomes. Further randomized controlled studies are required to investigate whether earlier steroid administration in patients with M1 would result in better outcomes.
IgAOx_supplementary_tables.docx
Download MS Word (15.4 KB)Acknowledgements
None.
Disclosure statement
The authors have no conflicts of interest to declare and no financial disclosures to make with respect to this work. The results presented in this paper have not been published previously in whole or part, except in abstract format.
References
- Donadio JV, Grande JP. IgA nephropathy. N Engl J Med. 2002;347:738–48.
- Collins AJ, Foley RN, Gilbertson DT, Chen SC. United States Renal Data System public health surveillance of chronic kidney disease and end-stage renal disease. Kidney Int Suppl (2011). 2015;5:2–7.
- Jin DC, Yun SR, Lee SW, Han SW, Kim W, Park J, et al. Lessons from 30 years’ data of Korean end-stage renal disease registry, 1985–2015. Kidney Res Clin Pract. 2015;34:132–9.
- D’Amico G. Natural history of idiopathic IgA nephropathy: role of clinical and histological prognostic factors. Am J Kidney Dis. 2000;36:227–37.
- Peterson JC, Adler S, Burkart JM, Greene T, Hebert LA, Hunsicker LG, et al. Blood pressure control, proteinuria, and the progression of renal disease. The Modification of Diet in Renal Disease Study. Ann Intern Med. 1995;123:754–62.
- Appel GB, Waldman M. The IgA nephropathy treatment dilemma. Kidney Int. 2006;69:1939–44.
- Radhakrishnan J, Cattran DC. The KDIGO practice guideline on glomerulonephritis: reading between the (guide)lines – application to the individual patient. Kidney Int. 2012;82:840–56.
- Rauen T, Eitner F, Fitzner C, Sommerer C, Zeier M, Otte B, et al. Intensive supportive care plus immunosuppression in IgA nephropathy. N Engl J Med. 2015;373:2225–36.
- Shima Y, Nakanishi K, Kamei K, Togawa H, Nozu K, Tanaka R, et al. Disappearance of glomerular IgA deposits in childhood IgA nephropathy showing diffuse mesangial proliferation after 2 years of combination/prednisolone therapy. Nephrol Dial Transplant. 2011;26:163–9.
- Shin JH, Lee JE, Park JH, Lim S, Jang HR, Kwon GY, et al. The effects of cytotoxic therapy in progressive IgA nephropathy. Ann Med. 2016;48:171–81.
- Cattran DC, Coppo R, Cook HT, Feehally J, Roberts IS, Troyanov S, et al. The Oxford classification of IgA nephropathy: rationale, clinicopathological correlations, and classification. Kidney Int. 2009;76:534–45.
- Herzenberg AM, Fogo AB, Reich HN, Troyanov S, Bavbek N, Massat AE, et al. Validation of the Oxford classification of IgA nephropathy. Kidney Int. 2011;80:310–17.
- Coppo R, Troyanov S, Camilla R, Hogg RJ, Cattran DC, Cook HT, et al. The Oxford IgA nephropathy clinicopathological classification is valid for children as well as adults. Kidney Int. 2010;77:921–7.
- Alamartine E, Sauron C, Laurent B, Sury A, Seffert A, Mariat C. The use of the Oxford classification of IgA nephropathy to predict renal survival. Clin J Am Soc Nephrol. 2011;6:2384–8.
- Katafuchi R, Ninomiya T, Nagata M, Mitsuiki K, Hirakata H. Validation study of Oxford classification of IgA nephropathy: the significance of extracapillary proliferation. Clin J Am Soc Nephrol. 2011;6:2806–13.
- Shi SF, Wang SX, Jiang L, Lv JC, Liu LJ, Chen YQ, et al. Pathologic predictors of renal outcome and therapeutic efficacy in IgA nephropathy: validation of the Oxford classification. Clin J Am Soc Nephrol. 2011;6:2175–84.
- Kang SH, Choi SR, Park HS, Lee JY, Sun IO, Hwang HS, et al. The Oxford classification as a predictor of prognosis in patients with IgA nephropathy. Nephrol Dial Transplant. 2012;27:252–8.
- Zeng CH, Le W, Ni Z, Zhang M, Miao L, Luo P, et al. A multicenter application and evaluation of the Oxford classification of IgA nephropathy in adult Chinese patients. Am J Kidney Dis. 2012;60:812–20.
- Coppo R, Troyanov S, Bellur S, Cattran D, Cook HT, Feehally J, et al. Validation of the Oxford classification of IgA nephropathy in cohorts with different presentations and treatments. Kidney Int. 2014;86:828–36.
- Tesar V, Troyanov S, Bellur S, Verhave JC, Cook HT, Feehally J, et al. Corticosteroids in IgA nephropathy: a retrospective analysis from the VALIGA study. J Am Soc Nephrol. 2015;26:2248–58.
- Barbour SJ, Espino-Hernandez G, Reich HN, Coppo R, Roberts IS, Feehally J, et al. The MEST score provides earlier risk prediction in lgA nephropathy. Kidney Int. 2016;89:167–75.
- Lv J, Shi S, Xu D, Zhang H, Troyanov S, Cattran DC, et al. Evaluation of the Oxford classification of IgA nephropathy: a systematic review and meta-analysis. Am J Kidney Dis. 2013;62:891–9.
- Park KS, Han SH, Kie JH, Nam KH, Lee MJ, Lim BJ, et al. Comparison of the Haas and the Oxford classifications for prediction of renal outcome in patients with IgA nephropathy. Hum Pathol. 2014;45:236–43.
- Pozzi C, Bolasco PG, Fogazzi GB, Andrulli S, Altieri P, Ponticelli C, et al. Corticosteroids in IgA nephropathy: a randomised controlled trial. Lancet. 1999;353:883–7.
- Pozzi C, Andrulli S, Del Vecchio L, Melis P, Fogazzi GB, Altieri P, et al. Corticosteroid effectiveness in IgA nephropathy: long-term results of a randomized, controlled trial. J Am Soc Nephrol. 2004;15:157–63.
- Levey AS, Stevens LA, Schmid CH, Zhang YL, Castro AF, 3rd, Feldman HI, et al. A new equation to estimate glomerular filtration rate. Ann Intern Med. 2009;150:604–12.
- Dekker FW, de Mutsert R, van Dijk PC, Zoccali C, Jager KJ. Survival analysis: time-dependent effects and time-varying risk factors. Kidney Int. 2008;74:994–7.
- Thomas L, Reyes EM. Tutorial: survival estimation for Cox regression models with time-varying coefficients using SAS and R. J Stat Softw. 2014;61.
- Gum PA, Thamilarasan M, Watanabe J, Blackstone EH, Lauer MS. Aspirin use and all-cause mortality among patients being evaluated for known or suspected coronary artery disease: a propensity analysis. JAMA. 2001;286:1187–94.
- Han SH, Ahn SV, Yun JY, Tranaeus A, Han DS. Mortality and technique failure in peritoneal dialysis patients using advanced peritoneal dialysis solutions. Am J Kidney Dis. 2009;54:711–20.
- Haas M, Reich HN. Morphologic markers of progressive immunoglobulin A nephropathy. Adv Chronic Kidney Dis. 2012;19:107–13.
- Barbour SJ, Reich HN. Risk stratification of patients with IgA nephropathy. Am J Kidney Dis. 2012;59:865–73.
- Hemmelgarn BR, Manns BJ, Lloyd A, James MT, Klarenbach S, Quinn RR, et al. Relation between kidney function, proteinuria, and adverse outcomes. JAMA. 2010;303:423–9.
- Gutierrez E, Zamora I, Ballarin JA, Arce Y, Jimenez S, Quereda C, et al. Long-term outcomes of IgA nephropathy presenting with minimal or no proteinuria. J Am Soc Nephrol. 2012;23:1753–60.
- Wyatt RJ, Julian BA. IgA nephropathy. N Engl J Med. 2013;368:2402–14.
- Oruc Z, Oblet C, Boumediene A, Druilhe A, Pascal V, Le Rumeur E, et al. IgA structure variations associate with immune stimulations and IgA mesangial deposition. J Am Soc Nephrol. 2016;27:2748–61.
- Lai KN, Leung JC, Chan LY, Saleem MA, Mathieson PW, Tam KY, et al. Podocyte injury induced by mesangial-derived cytokines in IgA nephropathy. Nephrol Dial Transplant. 2009;24:62–72.
- Manno C, Torres DD, Rossini M, Pesce F, Schena FP. Randomized controlled clinical trial of corticosteroids plus ACE-inhibitors with long-term follow-up in proteinuric IgA nephropathy. Nephrol Dial Transplant. 2009;24:3694–701.
- Lv J, Zhang H, Chen Y, Li G, Jiang L, Singh AK, et al. Combination therapy of prednisone and ACE inhibitor versus ACE-inhibitor therapy alone in patients with IgA nephropathy: a randomized controlled trial. Am J Kidney Dis. 2009;53:26–32.
- Le W, Zeng CH, Liu Z, Liu D, Yang Q, Lin RX, et al. Validation of the Oxford classification of IgA nephropathy for pediatric patients from China. BMC Nephrol. 2012;13:158.
- Lee MJ, Kim SJ, Oh HJ, Ko KI, Koo HM, Kim CH, et al. Clinical implication of crescentic lesions in immunoglobulin A nephropathy. Nephrol Dial Transplant. 2014;29:356–64.
- Nam KH, Kie JH, Lee MJ, Chang TI, Kang EW, Kim DW, et al. Optimal proteinuria target for renoprotection in patients with IgA nephropathy. PLoS One. 2014;9:e101935.