
Abstract
Cardiac resynchronization therapy (CRT) is an effective intervention in selected patients with moderate-to-severe heart failure with reduced ejection fraction and abnormal left ventricular activation time. The non-response rate of approximately 30% has remained nearly unchanged since this therapy was introduced 25 years ago. While intracardiac mapping is widely used for diagnosis and guidance of therapy in patients with tachyarrhythmia, its application in characterization of the electrical substrate to elucidate the mechanisms involved in CRT response remain anecdotal. In the present review, we describe the traditional determinants of CRT response before presenting novel non-invasive techniques used for CRT optimization. We discuss efforts to identify the target electrical substrate to guide the deployment of pacing electrodes during the operative procedure. Non-invasive body surface mapping technologies such as ECG imaging or ECG belt enables prediction of acute and chronic CRT response. While electrical dyssynchrony parameters provide high predictive accuracy for CRT response when obtained during intrinsic conduction, their predictive value is less when acquired during CRT or LV-pacing.
Classic predictors of CRT response are female gender, NYHA class ≤ III, left ventricular ejection fraction ≥25%, QRS duration ≥150 ms and estimated glomerular filtration rate ≥60 mL/min.
ECG-imaging is a comprehensive non-invasive mapping system which allows to express the amount of electrical asynchrony of a CRT candidate.
Non-invasive body surface mapping technologies enables excellent prediction of acute and chronic CRT response before implantation.
When performed during CRT or LV-pacing, the added value of these mapping systems remains unclear.
Key messages
Introduction
Cardiac resynchronization therapy (CRT) is an effective intervention in selected patients with moderate to severe heart failure with reduced ejection fraction and abnormal left ventricular activation time. However, clinical studies consistently demonstrate non-response rate of approximately 30%, which has remained nearly unchanged since this therapy was introduced 25 years ago [Citation1]. The international guidelines for CRT implantation recommend the use of the 12-lead ECG when assessing potential CRT candidates, emphasizing the dyssynchrony requirement favouring QRS of at least 120 ms and a left bundle branch block pattern [Citation2]. While intracardiac mapping is widely used for diagnosis and guidance of therapy in patients with tachyarrhythmia, its application in characterization of the electrical substrate to elucidate the mechanisms involved in CRT response remain anecdotal [Citation3–5]. One of the main reasons is that complexity and cost of invasive mapping prohibit the application of these techniques in routine patient selection. Recently, different non-invasive mapping methods have been developed, enabling characterization of the cardiac electrical activity, investigation of the detrimental impact of asynchronous ventricular activation and the potential positive effects of CRT [Citation6–14].
In the present review, we will describe the non-invasive techniques used for CRT optimization and discuss the efforts to identify the target electrical substrate to guide the deployment of pacing electrodes during the operative procedure.
Traditional determinants of CRT response
CRT is a very successful therapy and needs to be considered in every patient with systolic left ventricular dysfunction and marked delay of electrical activation. Since not every heart failure patient seems to benefit from CRT, major efforts have been made to identify predictors for CRT response. Recently, a simple risk score has been derived from a French multi-centre cohort and then validated in four high-volume European centres [Citation15]. CRT response was defined as an improvement of ≥1 NYHA functional class and/or ≥5% left ventricular ejection fraction (LVEF) in the absence of hospitalization for congestive heart failure within the 12 months after implant. Independent predictors of CRT response were: female gender (OR = 2.08), NYHA class ≤ III (OR = 2.71), left ventricular ejection fraction ≥25% (OR =1.75), QRS duration ≥150 ms (OR = 1.70) and estimated glomerular filtration rate ≥60 mL/min (OR = 2.01). When assigning each with 1 point, the ScREEN score (Sex category, Renal function, ECG/QRSwidth, Ejection fraction and NYHA class) was very predictive, with CRT response increasing progressively from 38% in patients with a score of 0 to 92% among those with score of 5 (). In addition, its prognostic information can easily be remembered using the following “25% rule”: score of 0 or 1 corresponds to approximately 25% survival or freedom from heart transplantation at 10 years, in patients with score of 2 or 3, this number rises to 50%, and in patients with higher chances of response, score 4 or 5, survival is almost 75%. Left bundle branch block status was not present in the derivation cohort (only QRS width was available) and LBBB morphology remains to be considered as one of the most predictive biomarkers for CRT response [Citation16]. While ischemic heart disease is considered as a negative predictor in many CRT studies, in this large study it was identified as an independent predictor in the univariate analysis, but not in the multivariate analysis (as was the case for age >72y and atrial fibrillation). LV pacing in the vicinity of infarcted myocardium has been associated with decreased improvement in pump function and increased arrhythmogenicity [Citation17]. The TARGET study showed that mortality was almost five times lower when the LV lead was placed outside scar (as detected by cardiac magnetic resonance imaging with delayed enhancement) [Citation18]. In an attempt to improve response in CRT recipients with ischemic heart disease, scar imaging may be used to guide LV lead placement away from scar tissue. In a recent feasibility study, Nguyen and colleagues combined scar imaging with CT angiography in order to construct roadmaps which allowed the implanting cardiologist to place the LV lead away from scar tissue in 11 of 14 patients[Citation19]. Randomized controlled trials are needed to decide whether scar imaging should be performed in CRT candidates with known ischemic heart disease.
Figure 1. The ScREEN (Sex category, Renal function, ECG/QRSwidth, Ejection fraction and NYHA class) score is strongly associated with CRT response.
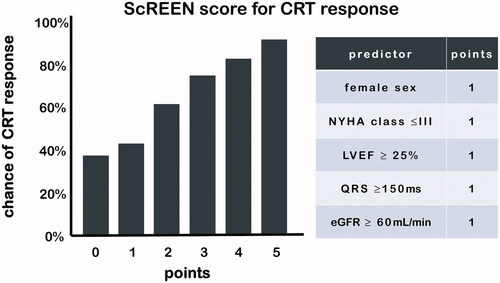
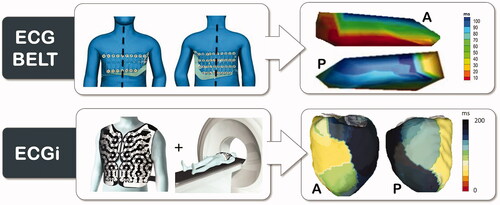
Figure 2. ECG belt and ECGi technologies are shown. The patient wears the ECG belt or ECGi vest and electroanatomical maps can be created for electrical substrate analysis. A: anterior view. P: posterior view.
Current guidelines recommend implantating a CRT device only when QRS is at least 120 ms with LBBB morphology or at least 150 ms without LBBB morphology. The cut-off of 150 ms is based on subgroup analyses of large CRT trials which demonstrated that positive outcome of CRT was predominantly confined to patients with a QRS duration ≥150 ms [Citation20]. While classifying LBBB may seem trivial for cardiologists, considerable intra- and inter-observer variability exists in whether a patient has LBBB or not [Citation21]. There exist multiple criteria for diagnosis of LBBB and the strength of the association of LBBB to outcome in CRT depends on its classification [Citation22]. This is the main reason why major efforts have been undertaken to investigate the added value of non-invasive electrical mapping of cardiac activation before and during CRT.
Non-invasive electrical mapping of cardiac activation
Electrocardiographic imaging (ECGI)
Electrocardiographic Imaging (ECGI), pioneered by Dr. Yoram Rudy's laboratory, provides non-invasive high-resolution electrical mapping of cardiac excitation on the epicardial surface [Citation13]. The system has been validated, both experimentally and in patients, under different physiological and pathological conditions, by comparison with direct epicardial mapping during open-heart surgery and with catheter intracardiac mapping [Citation13]. A recent validation study showed poor overall agreement of ECGi activation mapping and contact mapping [Citation23]. However, the between-map correlation was good for wide QRS patterns such as seen during asynchronous ventricular activation in CRT candidates [Citation23]. Ventricular activation maps are acquired using a noninvasive high-resolution electrocardiographic mapping (ECM) system (CardioInsight Technologies Inc, Cleveland, OH). As previously described in detail, body surface potentials are recorded from ≈250 electrodes around the entire surface of the torso [Citation13]. A thoracic computed tomography (CT) scan is performed to define the heart-torso geometry and the body surface electrodes (). The body surface potentials and computed tomography images are then combined and processed to reconstruct >2500 epicardial unipolar electrograms from which isochrones can be constructed continuously on a beat-by-beat basis. Local ventricular activation times are calculated from the onset of the QRS complex or the pacing artefact to the maximal negative slope of each unipolar electrogram. To map the ventricular activation during the operative procedure, the electrode vest can be opened at the level of the subclavian area, allowing implantation of leads and device [Citation6].
Multiple electrical asynchrony indexes can be derived from acquired activation maps. In the different studies that we have conducted, the total activation time (TAT) is defined as the duration (in milliseconds) from the earliest to the latest site of ventricular activation. The ventricular electrical uncoupling (VEU) is calculated as the difference between the mean LV and RV activation times (in milliseconds); a positive value reflects RV pre-activation, whereas a negative value reflects LV pre-activation. In our most recent study, we introduced the activation delay vector (ADV) which describes the imbalance of ventricular depolarization, or activation delay, in time (by its amplitude) and in space by its direction. ADV was calculated by combining the depolarization times and coordinates (X, Y and Z distances from the centre of the heart in millimetres) of all virtual electrodes.
ECG belt
The ECG belt used for isochronal mapping is comprised of a 53-electrode body surface mapping system (adapted from Heart scape Technologies, Verathon, Seattle, WA) with a multichannel amplifier and customized software to allow data recording. A MATLAB code than transforms the multielectrode ECG data into color-coded isochronal maps presented in 2 views: anterior and posterior. demonstrates a schematic example of ECG belt and ECG imaging technologies. Two metrics of electrical heterogeneity can be calculated: SDAT (standard deviation of activation times) from all electrodes, a global measure of electrical heterogeneity; and LTAT (left thorax activation times), which averages the activation times of electrodes on both the anterior and posterior surfaces of the left thorax (left of sternum on the anterior and left of spine on the posterior surfaces). The ECG belt data are processed off line to generate electrical heterogeneity measures and color-coded isochronal maps. The major advantage of this system compared to ECGi is that a CT scan is not required. This facilitates the workflow and reduces the irradiation for the patient but decreases the resolution and the accuracy since the patient-specific cardiothoracic anatomy is not integrated in the analysis.
Non-invasive mapping to define ventricular activation sequence
A major limitation of the 12-lead ECG is its inability to provide a precise pattern of regional electrical activity. While the ECG belt system delivers additional information, its lack of detailed anatomical information may limit its value in investigating the electrical substrate in detail. Since ECGi reconstructs regional epicardial myocardial activation maps, a potentially useful application of this novel technology may be predicting the response to CRT. We have conducted multiple studies to better define the characteristics of ventricular activation in a large population of heart failure patients with intrinsic electrical activation or during right ventricular apical pacing (RVAP) [Citation6,Citation7,Citation24].
In a first study, we performed electrocardiographic activation mapping in 33 consecutive CRT candidates, including 18 patients with left bundle branch block (LBBB) and 15 patients with nonspecific intraventricular conduction disturbance (NICD). Electrocardiographic maps revealed homogeneous patterns of activation and consistently greater VEU and LV total activation time (LVTAT) in patients with LBBB compared with heterogeneous activation sequences and shorter VEU and LVTAT in NICD patients [Citation7]. In LBBB patients, the ventricular activation sequence was characterized by narrow inter-individual variability, making the map easily recognizable. We observed RV breakthrough with rapid and centrifugal spread of activation across the RV free wall, with the site of latest activation consistently quasi-systematically observed at the base of the lateral wall of the left ventricle [Citation7]. In our follow-up study with a larger group of LBBB patients we confirmed these findings and using a vector approach we further discovered that the direction of activation delay was similarly, highly conserved in these patients [Citation6] conversely, even though NICD patients demonstrated heterogeneous patterns of activation and variable extent of activation delay, the direction of the activation delay vector was consistently directed towards the LV lateral wall. We demonstrated that it was the magnitude of right-to-left delay, expressed by both the ADV amplitude and the VEU, which was highly predictive of CRT response, outperforming classical parameters such as LBBB morphology or QRS width.
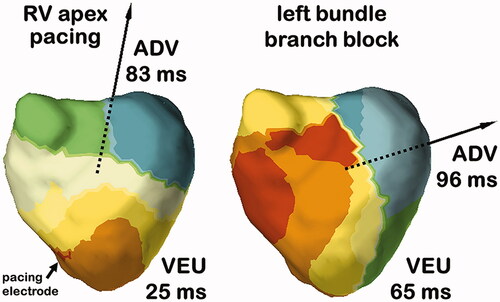
Patients with NYHA class III-IV heart failure, EF < 35% and high burden of RVAP have a class I indication for upgrading to CRT despite inconsistent results of small non-randomized studies. RVAP is expected to result in a very similar ventricular activation than LBBB. We performed a study comparing the ventricular activation pattern in LBBB and during RVAP in 24 patients [Citation14]. Despite obvious similarities in activation (inter-ventricular and intra-left ventricular dyssynchrony), we observed differences in the electrical activation pattern. The RV activation was significantly prolonged during RVAP versus LBBB, the LV activation proceeded from apex-to-base with RVAP compared to circumferential activation during LBBB and importantly, the VEU during RVAP was nearly half as long as during LBBB. depicts typical examples of RVAP and LBBB ECGi activation maps with large differences in VEU (lower during RVAP) and ADV direction (upwards during RVAP). These findings, also reproduced in a separate invasive clinical study [Citation25], may explain why CRT appears to be more effective in patients with LBBB rather than in RV to biventricular upgraded patients (with high percentages of RV pacing). Therefore, there may be a potential role for electrocardiographic mapping as a mean for screening chronically RV paced patients to identify individual patients who have prolonged VEU and who would likely benefit from CRT.
Figure 3. Typical ECGi activation maps during RV apex pacing (left panel) and left bundle branch block (right panel). While total activation time and QRS width were similar, RV apex pacing was associated with much lower VEU and more apex-to-base activation.
Non-invasive mapping during intrinsic conduction to predict CRT response
Patient selection is undoubtedly a major issue for CRT response. Sufficient intrinsic ventricular electrical conduction delay needs to be present for CRT to improve cardiac pump function [Citation1]. The pattern of electrical conduction disturbance is commonly described using surface-ECG parameters such as QRS duration and morphology.
In a prospective study, we sought to define potential interest of body-surface mapping (ECGi) to improve the selection of candidates to CRT [Citation7]. We explored the ability of different ECGi-derived parameters of electrical dyssynchrony to predict long-term clinical response to CRT. We were able to demonstrate that prolongation of the VEU was strongly associated with clinical CRT response and appeared to be a more powerful predictor than 12-lead ECG parameters. The area under the receiver-operating characteristic curve (AUC) indicated that VEU (AUC: 0.88) was significantly superior to QRS duration (AUC: 0.73) for predicting CRT response (p < .05). With a 50-ms cut-off value, VEU identified CRT responders with 90% sensitivity and 82% specificity whether LBBB was present or not. Patients with a VEU above 50 ms had a 42-fold increase in the likelihood of being a responder (p < .001). We confirmed that the presence of LBBB was indeed a strong predictor for CRT. Significant VEU was found in all LBBB patients, which may account for the high rate of response to CRT in this subgroup. These results suggest that it is the magnitude of right-to-left activation delay which separate responders from non-responders to CRT. This finding was later confirmed in a larger study where the ADV, a three-dimensional approach to describing electrical asynchrony, performed equally to the VEU, a right-to-left asynchrony metric. Independently, the diagnostic accuracy of the ECG belt to predict changes in LV end-systolic volume (LVESV) and ejection fraction (LVEF) after 6 months of CRT was tested in 66 CRT candidates [Citation12]. No sensitivity or specificity analysis was reported but patients with SDAT ≥35 ms had greater improvement in EF (13 ± 8 vs. 4 ± 9 units, p <.01) and LVESV (−34 ± 28 vs. −13 ± 29%, p = .005).
As explained above, electrocardiographic maps reveal highly homogeneous patterns of activation in LBBB patients. Therefore, even if non-invasive cardiac mapping provides a more detailed depiction of the electrical substrate and helps in the understanding of the determinants of the CRT response, it would be difficult to demonstrate potential additional benefit from non-invasive mapping in LBBB patients. Conversely, there is evidence that a subset of patients without LBBB may respond to treatment with CRT. Interestingly, significant VEU, a fundamental component of the electrical substrate amenable to treatment with CRT, was also observed in some patients with NICD [Citation7]. Identification of significant VEU in patients who have prolonged QRS duration on surface ECG but do not display typical LBBB morphology may therefore be a promising strategy for the selection of potential non-LBBB patients who may benefit from CRT. Randomized and blinded studies are required to confirm this hypothesis.
Non-invasive mapping during biventricular pacing to predict CRT response
In the discussed ECG-belt study, the diagnostic accuracy of the ECG belt was also tested during biventricular pacing (BVP) [Citation12]. Patients with ≥10% improvement in SDAT had greater increase in EF (11 ± 9 vs. 4 ± 9 units, p = .010) and decrease in LVESV (−33 ± 26 vs. −6 ± 34%, p= .001). Sensitivity and specificity were not reported but these results are very comparable with SDAT ≥ 35 ms during intrinsic conduction. Using ECGi, we also addressed the electrical consequences of biventricular pacing (BVP) combined with invasive hemodynamic measurements before and after BVP in a population of heart failure patients (n = 61) covering a variety of conduction patterns (13 narrow QRS, 22 NICD and 26 LBBB) [Citation24]. We observed that BVP did not eliminate electrical dyssynchrony but rather decreased it similarly, independent of the patient’s underlying electrical substrate. Thus, since BVP results in similar ventricular activation regardless of the baseline conduction characteristics, improvement or worsening in function are mostly determined by the severity of the ventricular conduction impairment during baseline conduction, which also determines the extent to which dyssynchrony is corrected. While ECGi parameters during baseline were highly predictive of acute hemodynamic response (AUC 0.93), ECGi parameters during BVP or its change from baseline were not predictive (AUC 0.53 and 0.66 respectively) [Citation6]. Similarly, ECGi parameters were a better predictor of clinical response at 6 months when assessed in baseline intrinsic conduction rather than in BVP or using the degree of change from baseline (AUC 0.90 versus 0.53 and 0.76, respectively) [Citation6]. Hence, hemodynamic response can be expected as long as the degree of baseline electrical dyssynchrony exceeds the dyssynchrony induced by BVP. Conversely, in patients with insufficient intrinsic electrical dyssynchrony, CRT may result in worsening of dyssynchrony.
Non-invasive mapping to optimize the LV pacing site
The concept of LV pacing site optimization originates from hemodynamic studies showing a large and significant variation in the hemodynamic response to LV pacing not only between patients but also within each individual. While various patient-specific optimization strategies for LV lead placement have been proposed, the lateral wall remains the preferred location given the absence of a validated method to compare the degree of response by alternative pacing sites. Non-invasive mapping appears to be a promising technique for optimization of the pacing site based on electrical resynchronization, as long as it correlates with improving LV hemodynamic function and long-term clinical response.
The potential of body-surface mapping to optimize LV pacing lead placement has been investigated using ECGi and ECG belt systems [Citation6,Citation11]. In the ECG belt study, an average of 4.8 LV sites were tested in 40 CRT candidates [Citation11]. The hemodynamic improvement at the best site determined by the ECG belt was within 5% of the largest ΔLV dP/dtmax in 35 out of 39 patients (89.7%). Dyssynchrony defined by isochronal maps had better accuracy (sensitivity 90%, specificity 80%) for identifying hemodynamically responsive sites (ΔLVdP/dtmax ≥ 10%) compared with RV–LV delay (sensitivity 69%, specificity 85%) or paced QRS reduction (sensitivity 52%, specificity 76%). Limitations of this study were: (1) the extent of improvement with this technique compared to the standard procedure, i.e. targeting the lateral wall, was not assessed; (2) the electrical dyssynchrony parameters were analysed offline, not applicable in the real life for optimization of the pacing sites during implantation; it is possible however that in a near future, real-time analysis will become possible; (3) there was no reporting of long- term outcomes; whether improvement of the electrical resynchronization and hemodynamic improvement would translate into long term clinical benefit requires further investigation.
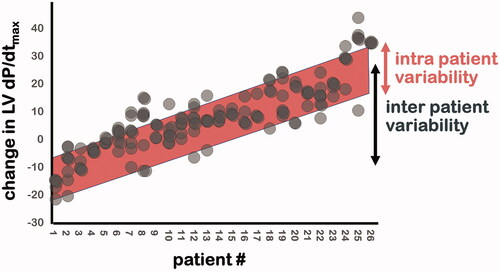
We recently reported the results of our combined ECGi and acute hemodynamic study in 26 patients with a median of 4 tested LV pacing sites. We found that the change in LVdP/dtmax varied more between patients (−16% to +35%) than within patients (average of 11%), indicating the dominant effect of patient selection. depicts that indeed intra-patient variability in acute hemodynamic response is lower than inter patient variability.
Figure 4. Acute hemodynamic response during biventricular pacing at 3–7 LV sites. Intra-patient variability (red band) is lower than inter patient variability (black double arrow).
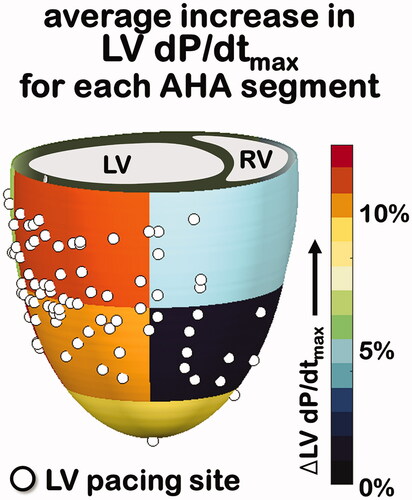
Pacing from the site of maximal LVdP/dt added on average 3 ± 4% mmHg/s (p < .01) to the LVdP/dtmax (p < .01) to the LV pacing site to the lateral base (conventional site). Averaging LVdP/dtmax increases for all 104 LV pacing sites per LV segment (according to American Heart Association) results in a functional map (shown in ) which makes clear that on a population level basal and mid lateral sites perform very well. In only 6 out of 26 patients (23%), one or more alternative LV pacing sites resulted in a LVdP/dtmax increase ≥10% while LV pacing at the lateral base only resulted in a LVdP/dtmax increase of less than 10%.
Figure 5. Percent LV dP/dtmax increase for all 104 LV pacing sites (shown as white dots) were averaged according to AHA segment of the LV. AHA: American Heart Association.
In line with these results, ECGi during LV optimization did not predict the LV pacing site with optimal acute hemodynamic response. For example, the LV pacing site which resulted in the shortest ADV (51 ± 17 ms; most effective electrical resynchronization) did not result in greater increase in LVdP/dtmax when compared to the conventional basolateral LV pacing site (10 ± 13% versus 11 ± 14% respectively, P = NS). Evidently, the available LV pacing optimization studies show discrepancies between the performance of ECGi and the ECG belt technologies, which are possibly explained by differences in methodology. For example, in the ECG belt study, the LV pacing site with greatest reduction in electrical dyssynchrony resulted in the largest increase in LVdP/dtmax, or within 5% of this optimum in 88% of patients. In the ECGi study this endpoint would have translated to 81% of patients (21 of 26 patients). However, the 3 ± 4% increase in LV dP/dtmax achieved by moving the pacing site from the traditional position to the optimized one is modest and reflects the variability in this parameter and its limitation as an endpoint [Citation26].
It is possible that an additional improvement in LV hemodynamics may be achieved through LV pacing site optimization. However, since body surface mapping can adequately identify CRT responders before pacing the heart the extent to which modification of the electrical substrate by LV pacing sites optimization may only play a marginal role. This hypothesis is further supported by a recent computer modelling study conducted by Huntjens et al. [Citation9] which elegantly shows that intrinsic interventricular dyssynchrony (as opposed to intra LV dyssynchrony) is the dominant component of the electrical substrate driving the response to CRT and that dyssynchrony during biventricular pacing plays a minor role in this respect [Citation8].
Perspectives
CRT is an electrical therapy that may be best characterized by its effect on the electrical substrate, which is depicted in only rudimentary fashion by the surface ECG. In contrast, body surface mapping can reveal specificities of LV activation in patients with heart failure and QRS prolongation, potentially providing insight into the mechanisms related to the response to CRT. However, the positioning of this technique in clinical practice is more difficult to define.
Novel body surface mapping parameters such as VEU (ECGi) and SDAT (ECG belt) during intrinsic conduction accurately identify clinical CRT responders. Thus, with substantial advantage over standard 12-lead ECG in identifying clinical responders to CRT, body surface mapping may potentially improve prospective decision-making on candidacy for CRT. We have demonstrated that a high degree of homogeneity is present in the electrical activation pattern of patients with LBBB, possibly explaining the favourable response to CRT. In contrast, patients with NICD were present greater heterogeneity and variability, likely accounting for their suboptimal response to CRT. This could possibly be improved by using individualized mapping and therapy in this subgroup of patients. Since the majority of clinical response is determined before implantation by the intrinsic electrical substrate (high probability in LBBB patients, low probability in the other ECG patterns), the effects of optimization of the pacing site on overall clinical response are expected to be relatively small and therefore difficult to demonstrate, limiting the interest of this technique during the implantation procedure. This could be considered as a blessing in disguise as LV lead placement is a challening process where a balance needs to be found between avoiding phrenic stimulation, ensuring steady ventricular capture and maintaining lead stability. Adding additional criteria defined by noninvasive mapping during implantation increase implantation time and radiation exposure and our results indicate this may not be necessary.
ECG belt technology or ECGi could also be applied to optimize V-V and A-V delays based on the same principle of reduction of electrical heterogeneity during pacing. The applicability of device setting optimization based on non-invasive electrical mapping remains to be demonstrated. Additionally, MRI and high quality three-dimensional echocardiography may be used in the future to replace CT in obtaining chamber geometry.
Conclusion
Using non-invasive body surface mapping technologies such as ECG imaging or ECG belt enables prediction of acute and chronic CRT response. Electrical dyssynchrony parameters provide high predictive accuracy for CRT response when obtained during intrinsic conduction, with lesser predictive value when acquired during CRT or LV-pacing.
Disclosure statement
The authors report no conflicts of interest.
Additional information
Funding
Related Research Data
References
- Vernooy K, van Deursen CJ, Strik M, et al. Strategies to improve cardiac resynchronization therapy. Nat Rev Cardiol. 2014;11:481–493.
- Brignole M, Auricchio A, Baron-Esquivias G, et al. 2013 ESC Guidelines on cardiac pacing and cardiac resynchronization therapy: the Task Force on cardiac pacing and resynchronization therapy of the European Society of Cardiology (ESC). Developed in Collaboration with the European Heart Rhythm Association (EHRA). Eur Heart J. 2013;34:2281–2329.
- Derval N, Duchateau J, Mahida S, et al. Distinctive left ventricular activations associated with ECG pattern in heart failure patients. Circ Arrhythm Electrophysiol. 2017;10:6.
- Strik M, van Deursen CJ, van Middendorp LB, et al. Transseptal conduction as an important determinant for cardiac resynchronization therapy, as revealed by extensive electrical mapping in the dyssynchronous canine heart. Circ Arrhythm Electrophysiol. 2013;6:682–689.
- Strik M, van Middendorp LB, Houthuizen P, et al. Interplay of electrical wavefronts as determinant of the response to cardiac resynchronization therapy in dyssynchronous canine hearts. Circ Arrhythm Electrophysiol. 2013;6:924–931.
- Strik M, Ploux S, Huntjens PR, et al. Response to cardiac resynchronization therapy is determined by intrinsic electrical substrate rather than by its modification. Int J Cardiol. 2018;270:143–148.
- Ploux S, Lumens J, Whinnett Z, et al. Noninvasive electrocardiographic mapping to improve patient selection for cardiac resynchronization therapy: beyond QRS duration and left bundle branch block morphology. J Am Coll Cardiol. 2013;61:2435–2443.
- Lumens J, Ploux S, Strik M, et al. Comparative electromechanical and hemodynamic effects of left ventricular and biventricular pacing in dyssynchronous heart failure: electrical resynchronization versus left-right ventricular interaction. J Am Coll Cardiol. 2013;62:2395–2403.
- Huntjens PR, Ploux S, Strik M, et al. Electrical substrates driving response to cardiac resynchronization therapy: a combined clinical-computational evaluation. Circ Arrhythm Electrophysiol. 2018;11:e005647.
- Bank AJ, Gage RM, Curtin AE, et al. Body surface activation mapping of electrical dyssynchrony in cardiac resynchronization therapy patients: Potential for optimization. J Electrocardiol. 2018;51:534–541.
- Johnson WB, Vatterott PJ, Peterson MA, et al. Body surface mapping using an ECG belt to characterize electrical heterogeneity for different left ventricular pacing sites during cardiac resynchronization: Relationship with acute hemodynamic improvement. Heart Rhythm. 2017;14:385–391.
- Gage RM, Curtin AE, Burns KV, et al. Changes in electrical dyssynchrony by body surface mapping predict left ventricular remodeling in patients with cardiac resynchronization therapy. Heart Rhythm. 2017;14:392–399.
- Jia P, Ramanathan C, Ghanem RN, et al. Electrocardiographic imaging of cardiac resynchronization therapy in heart failure: observation of variable electrophysiologic responses. Heart Rhythm. 2006;3:296–310.
- Eschalier R, Ploux S, Lumens J, et al. Detailed analysis of ventricular activation sequences during right ventricular apical pacing and left bundle branch block and the potential implications for cardiac resynchronization therapy. Heart Rhythm. 2015;12:137–143.
- Providencia R, Marijon E, Barra S, et al. Usefulness of a clinical risk score to predict the response to cardiac resynchronization therapy. Int J Cardiol. 2018;260:82–87.
- Strik M, Ploux S, Vernooy K, et al. Cardiac resynchronization therapy: refocus on the electrical substrate. Circ J. 2011;75:1297–1304.
- Rademakers LM, van Kerckhoven R, van Deursen CJ, et al. Myocardial infarction does not preclude electrical and hemodynamic benefits of cardiac resynchronization therapy in dyssynchronous canine hearts. Circ Arrhythm Electrophysiol. 2010;3:361.
- Khan FZ, Virdee MS, Palmer CR, et al. Targeted left ventricular lead placement to guide cardiac resynchronization therapy: the TARGET study: a randomized, controlled trial. J Am Coll Cardiol. 2012;59:1509–1518.
- Nguyen UC, Cluitmans MJM, Strik M, et al. Integration of cardiac magnetic resonance imaging, electrocardiographic imaging, and coronary venous computed tomography angiography for guidance of left ventricular lead positioning. Europace. 2019;21:626–635.
- Engels EB, Mafi-Rad M, van Stipdonk AM, et al. Why QRS duration should be replaced by better measures of electrical activation to improve patient selection for cardiac resynchronization therapy. J Cardiovasc Trans Res. 2016;9:257–265.
- van Stipdonk AMW, Vanbelle S, Ter Horst IAH, et al. Large variability in clinical judgement and definitions of left bundle branch block to identify candidates for cardiac resynchronisation therapy. Int J Cardiol. 2019;286:61–65.
- Caputo ML, van Stipdonk A, Illner A, et al. The definition of left bundle branch block influences the response to cardiac resynchronization therapy. Int J Cardiol. 2018;269:165–169.
- Duchateau J, Sacher F, Pambrun T, et al. Performance and limitations of noninvasive cardiac activation mapping. Heart Rhythm. 2018;16:435–442.
- Ploux S, Eschalier R, Whinnett ZI, et al. Electrical dyssynchrony induced by biventricular pacing: implications for patient selection and therapy improvement. Heart Rhythm. 2015;12:782–791.
- Mafi Rad M, Blaauw Y, Dinh T, et al. Different regions of latest electrical activation during left bundle-branch block and right ventricular pacing in cardiac resynchronization therapy patients determined by coronary venous electro-anatomic mapping. Eur J Heart Fail. 2014;16:1214–1222.
- Whinnett ZI, Francis DP, Denis A, et al. Comparison of different invasive hemodynamic methods for AV delay optimization in patients with cardiac resynchronization therapy: implications for clinical trial design and clinical practice. Int J Cardiol. 2013;168:2228–2237.