
Abstract
Background
Studies on the association between healthy lifestyle and cancer risk are limited among the old Chinese population.
Methods
The healthy lifestyle score was derived from smoking, drinking, diet, body mass index and physical activity among 23734 retired employees from the Dongfeng-Tongji Cohort. Cox proportional hazards regression was used to calculate the hazard ratios (HRs) and the corresponding 95% confidence intervals (CIs). The rate advancement periods (RAPs) and the population attributable risk percentage (PAR%) were estimated to indicate the benefits of removing risk lifestyle factors.
Results
During a median follow-up of 8.16 years, 2023 cancer cases were identified. Compared with 0–2 points of the healthy lifestyle score, the HRs were 0.87 (95% CI: 0.76, 0.99), 0.83 (95% CI: 0.73, 0.94), and 0.74 (95% CI: 0.64, 0.86) for 3, 4, and 5 points, respectively, with the corresponding RAPs of −4.40 (95% CI: −8.39, −0.41), −5.84 (95% CI: −9.77, −1.90), and −9.14 (95% CI: −14.03, −4.25), respectively. Approximately 15% of incident cancer cases among total population and 22% among men would be prevented by following all 5 healthy lifestyle factors.
Conclusions
The current study suggests that healthy lifestyle could reduce cancer risk in the retired Chinese population, especially in males.
Healthy lifestyle derived by smoking, drinking, diet, body mass index and physical activity presented a strong protective effect on cancer risk among the retired Chinese population, especially in males.
We employed the rate advancement periods and the population attributable risk percentage to indicate the benefits of adopting healthy lifestyle and we found that following all 5 healthy lifestyle factors could delay the risk of developing cancer by 9.14 years and prevent 15% of incident cancer cases.
Key messages
Introduction
Cancer is the second common cause of death worldwide and the global death due to cancer has increased by 7.0% between 2005 and 2015 [Citation1]. In China, with increasing incidence and mortality, cancer has become the leading cause of death since 2010 due to population aging and sociodemographic changes [Citation2]. It was estimated that about 4.3 million new cancer cases and 2.8 million cancer deaths occurred in China in 2015 [Citation3].
Previous epidemiological studies have demonstrated that individual modifiable lifestyle factors such as alcohol consumption [Citation4], smoking [Citation5], obesity [Citation6], diet [Citation7], and physical activity [Citation8] were linked to cancer incidence. Considering that these lifestyle factors coexist in population, investigation of their combined effect is more reasonable and valuable for public health policy-making. Several organisations, including the American Cancer Society (ACS) [Citation9] and the World Cancer Research Fund/American Institute for Cancer Research (WCRF/AICR) [Citation10] have published comprehensive behavioural guidelines for cancer prevention. Previous studies mainly conducted in western population have reported that compliance with these guidelines was associated with lower cancer risk [Citation11–13]. Besides, a recent study conducted in Chinese presented similar results [Citation14]. Moreover, a newly published meta-analysis of prospective cohort studies showed that combined lifestyle factors were associated with substantial risk reduction in cancer morbidity [Citation15]. However, evidence is still limited among Chinese population especially in old population.
In the present study, we explored the association between the combination of healthy lifestyle factors reflected by a healthy lifestyle score and cancer risk among the retired Chinese population in the Dongfeng-Tongji Cohort (DFTJ) Study. In addition, we estimated the population attributable risk percentage (PAR%) and the rate advancement periods (RAPs) to indicate the benefits of adopting the healthy lifestyle.
Materials and methods
Study population
The DFTJ cohort is a dynamic prospective cohort conducted in Shiyan city, Hubei province of China since 2008, which has been previously described [Citation16]. In brief, 27,009 retired employees of the Dongfeng Motor Corporation (DMC) were recruited at baseline between September 2008 and June 2010. All participants completed questionnaires and physical measurements, and provided fasting blood samples for medical examination. The cohort has been followed every five years to update information. After excluding participants diagnosed with cancer at baseline (n = 601), without information on follow-up data (n = 1031) or lifestyle factors (n = 1643), 23,734 participants were enrolled in the final analysis. The study protocol was approved by the Medical Ethics Committee of School of Public Health, Tongji Medical College, Huazhong University of Science and Technology and Dongfeng General Hospital, Dong-Feng Motor Corporation. Written informed consent was obtained from every participant before data collection.
The ascertainment of cancer incidence
The self-reported new cancer cases from the follow-up surveys were confirmed by reviewing electronic medical records of DMC hospitals covering all retired employees [Citation16]. The cancer is classified according to the International Classification of Diseases, 10th Revision (ICD-10) with ICD coding C00-C97.
Assessment of the lifestyle factors and covariates
Standing height and body weight were measured by trained physicians to calculate BMI. Information of smoking, alcohol consumption, dietary intakes and physical activity was collected by face-to-face interviews with a standard questionnaire [Citation16]. Ever smokers were defined as smoking at least one cigarette per day for half a year. Smokers were asked about the age of starting smoking and the number of cigarettes consumed per day. Age of quitting smoking was further asked for ex-smokers. Ever drinkers were defined as drinking alcoholic beverages at least one time per week for more than six months. The drinking type (liquor, wine or beer), average amount once a time, drinking frequency and age at starting and quitting drinking were gathered. The frequency and average amount per serving of 13 food items were collected through the questionnaire interviews. Daily consumptions of cereals (rice, wheat, etc.), coarse grains (oats, potatoes, etc.), fruits, vegetables, and meat were used to calculate the healthy diet score. Physical activity was assessed based on weekly frequency and duration of major exercise types. Participants were asked to select no more than 3 items from 9 major exercise types including walking, biking, tai chi, jogging, swimming, dancing, climbing, playing ball games and doing exercise in gym. The metabolic equivalent (MET) hours per week were calculated by multiplying the exercise time per week (the product of frequency and duration) with the average METs for the selected major exercise types [Citation17].
Covariates were inquired by the baseline standard questionnaire including demographic characteristics, personal and family medical history and women’s reproductive health. Participants also reported previous medical diagnoses of hypertension, diabetes mellitus (DM), hyperlipidaemia, stroke, coronary heart disease (CHD) and myocardial infarction (MI) [Citation18].
Construction of the healthy lifestyle score
Five lifestyle factors including smoking, drinking, diet, physical activity and BMI were selected. Each factor was dichotomised where 1 point meant the healthy behaviour and 0 point meant the unhealthy one.The healthy behaviours were defined as follows: non-smoking (never smoking or quitting smoking ≥20 years) [Citation19], currently not drinking, being physically active (at least 75 min of vigorous-intensity or 150 min of moderate-intensity physical activity weekly [7.5 MET-hours/week]) [Citation20], keeping a healthy weight (BMI ≥18.5 to <25 kg/m2) [Citation14,Citation21] and having a healthy diet (diet score ≥2) [Citation12]. Participants in the lowest 25% of meat intake, the top 75% of coarse grains to the sum of cereals and coarse grains (the sum was called total grains) [Citation12], or taking at least 500 g fresh vegetables and fruits per day [Citation14] scored 1 point on diet and the diet score was the sum of the three. The overall healthy lifestyle score was the sum of the points of 5 lifestyle components and ranged from 0 to 5 where 5 indicated the healthiest. Details of the healthy lifestyle score are described in Table S1.
Statistical analysis
Continuous variables were presented as mean (standard deviation [SD]) or median (P25, P75) and categorical data were presented as frequency (percentage). Differences in groups were compared by Kruskal-Wallis test and the Pearson χ2 test, respectively. Person-years were calculated from the date of enrollment to the date of cancer diagnosis, death, loss to follow-up, or 31 December 2016, whichever came first. Age- and gender- adjusted incidence rates of cancer per 100,000 person-years were calculated based on Poisson regression [Citation22]. Cox proportional hazards regression was used to calculate the hazard ratios (HRs) and their corresponding 95% confidence intervals (CIs) for cancer incidence. The proportional hazards assumption was confirmed by including a cross-product between the score and time in the Cox model and using a Wald test [Citation23]. Missing data of covariates (all less than 3%) were replaced by the average value for continuous variable including age and the closest integers of the averages for enumeration variables including gender, marital status, education level, family history of cancer, self-reported chronic diseases, and menopausal status, hormone replacement therapy, history of contraception use and number of children only for women after multiple imputation using the fully conditional specification (FCS) method (N = 10 imputed datasets) [Citation24]. In multivariate adjusted Cox proportional hazards regression models, stepwise selection procedure was used to screen the covariates of age, gender, marital status, education, family history of cancer, self-reported chronic diseases, and menopausal status, hormone replacement therapy, history of contraception use and number of children only for women. Participants with 0 to 2 points of the healthy lifestyle score were combined as the reference group to achieve stable estimates. To test for the linear trend, the healthy lifestyle score was modelled as an ordinal variable in Cox regression. When estimating the association between a certain lifestyle factor and cancer risk, the other four factors were adjusted in multivariate Cox regression models.Stratified analyses were performed by gender, age group, education level and history of major chronic diseases. Interactions of the healthy lifestyle score with these factors were assessed by including a cross-product in the models.
RAPs quantify the age difference at which exposed subjects reached the same risk as unexposed subjects. RAPs were obtained from the multivariate Cox regression: hazard (t, exposure) = b1 × exposure + b2 × baseline age + b3 × covariates. The point estimate of the RAP is b1/b2 (the ratio of the coefficient of the healthy lifestyle by that of age in the Cox regression model). The corresponding 95% CIs were also provided as previously described [Citation25]. By contrast, PAR% refers to the percentage of cases that could be prevented if a certain risk factor is eliminated from the population. Multivariate adjusted PAR% were calculated by the %PAR macro [Citation26].
Given that non-smoking was the only significant factor in individual lifestyle analysis, the smoking item was excluded from the overall healthy lifestyle score and set as a stratification factor as a sensitivity analysis. Besides, we excluded the drinking item from the composite score and set it as a covariate for sensitivity analysis to address the concern about uncertainty of the adverse effect of drinking. Several other sensitivity analyses were conducted by combining 0–1 points of the healthy lifestyle score as the reference group, using the full model with adjustment for all covariates, and excluding participants with missing covariates , BMI < 18.5 kg/m2 or cancer events occurring within the first 2 years since baseline. In addition, we calculated a weighted healthy lifestyle score by assigning the β coefficients from the stepwise Cox regression model as the weights for individual lifestyle factors and summed the products of each individual healthy lifestyle score multiplied by its weight. The weighted healthy lifestyle score was categorised as quintiles and the highest quintile representing most unhealthy lifestyle scored 0 [Citation27].
All statistical analyses were conducted with SAS software version 9.4 (SAS Institute, Cary, NC, USA) and R (version 3.6.1). Two-sided p values below .05 were considered statistically significant.
Results
A total of 2023 cancer cases were identified (1011 male and 1012 female cases) during a median follow-up of 8.16 years among 23,734 participants (10,632 men and 13,102 women) in the current study (). Most characteristics were comparable between the included and excluded population, including age, gender, marital status, history of main chronic diseases, intake of coarse to total grains, fruits and vegetables, and alcohol consumption, except those excluded participants were more likely to have higher educational level, higher proportion of family history, more meat intake, less cigarette smoking, and less physical activity although the medians of meat consumption and physical activity were the same between two groups (Table S2). Participants aged 60 or above accounted for 70.64%. Participants with higher healthy lifestyle score tended to be female, have higher proportion of higher education level, single marital status and family history of cancer, lower prevalence of hypertension and hyperlipidaemia, and fewer children of women (). Age- and gender-adjusted incidence rates of overall and site-specific cancers varied by increment of the healthy lifestyle score ().
Figure 1. The flowchat of the study.
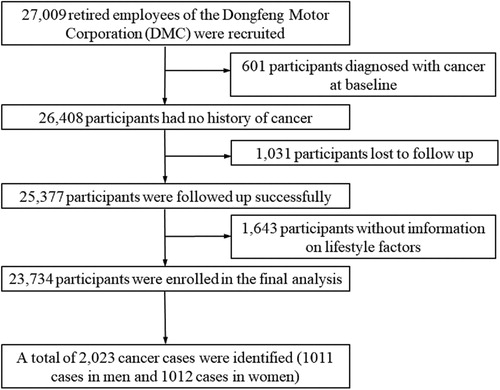
Figure 2. Age- and gender- adjusted incidence rates of overall and site-specific cancers per 100,000 person-years according to the healthy lifestyle score.
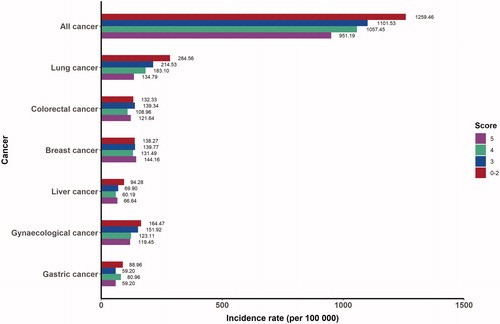
Table 1. Baseline characteristics of 23,734 participants according to the healthy lifestyle score.
The healthy lifestyle score was significantly associated with decreased cancer incidence for the entire cohort while each additional point reduced 8% of cancer risk (HR = 0.92, 95% CI: 0.88, 0.95) and delayed the risk of developing cancer by 2.72 years (95% CI: 1.45, 3.98). Compared with participants with 0–2 points of the healthy lifestyle score, the HRs of participants with 3, 4, and 5 points were 0.87 (95% CI: 0.76, 0.99), 0.83 (95% CI: 0.73, 0.94), and 0.74 (95% CI: 0.64, 0.86), respectively, and the corresponding RAPs were −4.40 (95% CI: −8.39, −0.41), −5.84 (95% CI: −9.77, −1.90), and −9.14 (95% CI: −14.03, −4.25), respectively (). When setting 0–1 healthy lifestyle score as the reference group, the HRs of 2, 3, 4, 5 points were 0.80 (95% CI: 0.64, 1.00), 0.74 (95% CI: 0.60, 0.90), 0.70 (95% CI: 0.58, 0.86) and 0.63 (95% CI: 0.51, 0.78) (Table S3). The protective effect of the healthy lifestyle was more profound in men than in women, although no significant interaction between gender and healthy lifestyle score was found (P for interaction = 0.236). Approximately 15% (95% CI: 4%, 25%) of incident cancer cases among total population and 22% (95% CI: 3%, 39%) among men would be prevented if all 5 healthy lifestyle factors were followed ().
Table 2. HRs, RAPs and PAR% of overall cancer risk by the healthy lifestyle score.
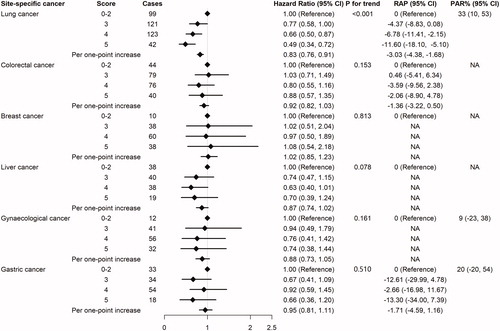
For original analyses of site-specific cancers, significant association was only observed in lung cancer. Compared with participants with 0–2 points of the healthy lifestyle score, participants with 3, 4, and 5 points showed significant lower risk and delayed risk years in lung cancer with HRs of 0.77 (95% CI: 0.58, 1.00), 0.66 (95% CI: 0.50, 0.87), and 0.49 (95% CI: 0.34, 0.72), and RAPs of −4.37 (95% CI: −8.83, 0.08), −6.78 (95% CI: −11.41, −2.15), and −11.60 (95% CI: −18.10, −5.10), respectively. 33% of lung cancer cases (95% CI: 10%, 53%) could be prevented if all 5 healthy lifestyle factors were followed. Furthermore, the suggestive protective effects of healthy lifestyle were observed for colorectal cancer, liver cancer and gynaecological cancer (). We combined liver cancer, gastric cancer, and colorectal cancer to expand the sample size and found per point increase of the healthy lifestyle score was associated with 8% (95% CI: 1%, 16%) lower risk and 3.07 (95% CI: 1.42, 4.71) delayed risk years (Table S4).
Figure 3. HRs, RAPs and PAR% of site-specific cancers associated with the healthy lifestyle score. Cox proportional hazards regression with stepwise selection procedure was used to screen for covariates. Finally, lung cancer was adjusted for age, gender and education. Colorectal cancer was adjusted for age. Breast cancer was adjusted for family history of cancer, diabetes mellitus and myocardial infarction. Liver cancer was adjusted for gender, diabetes mellitus and hyperlipidaemia. Gynaecological cancer was adjusted for age and stroke. Gastric cancer was adjusted for age and gender. NA: not available. If the adjusted HR of the highest healthy lifestyle score wasn’t the smallest, the macro of PAR% would fail. If age wasn’t included as a covariate or the coefficient of the age in the Cox regression was negative, the RAP couldn’t be calculated.
The inverse association between individual lifestyle factor and cancer risk was significant only for non-smoking in the entire cohort. Non-smoker had 25% lower risk (95% CI: 16%, 33%) and 8.92 (95% CI: 5.15, 12.68) years of delayed risk of cancer, and the estimated PAR% was 7% (95% CI: 4%, 10%). For men, non-smoking presented a protective effect and having a healthy diet showed a weak benefit. For Women, keeping a healthy weight was the only beneficial lifestyle factor (Table S5). When using more than two groups for individual factors, smoking was still the only significant risk factor for cancer, and healthy diet was associated with suggestively lower cancer risk (Table S6).
In stratified analyses, we didn’t observe significant difference in the association between the healthy lifestyle score and cancer risk according to age group (P for interaction = 0.673), educational level (P for interaction = 0.872), or history of chronic diseases (P for interaction = 0.746) (Table S7).
Per point increase of the healthy lifestyle score without the smoking item was associated with 10% lower cancer risk (95% CI: 1%, 17%) and 2.27 years of delayed risk (95% CI: 0.38, 4.17) in the current smokers and those who quitting smoking less than 20 years (Table S8). The healthy lifestyle still presented inverse association with cancer risk after removing the drinking item from the original score (Table S9). The association between the healthy lifestyle score and cancer risk didn’t substantially change after setting 0–1 points of the healthy lifestyle score as the reference group (Table S3), conducting full models for overall cancer and gynaecological cancer (Tables S10 and S11), excluding participants with missing data of covariates (Table S12), BMI < 18.5 kg/m2 (Table S13) or cancer events occurring within the first 2 years since baseline (Table S14), or using the weighted healthy lifestyle score (Table S15).
Discussion
In this large prospective study from DFTJ cohort, we found that healthy lifestyle was inversely associated with cancer risk and delayed the risk of developing cancer in retired Chinese population. Adherence to all 5 healthy lifestyle factors of non-smoking, currently not drinking, being physically active, keeping a healthy weight and having a healthy diet in late age would prevent approximately 15% and 22% of incident cancer cases among total population and men.
Reduced cancer risk has been linked to compliance with healthy lifestyle pattern in previous studies. In the European Prospective Investigation into Cancer and Nutrition cohort, the lifestyle score based on the WCRF/AICR guidelines was significantly associated with decreased risk of overall cancer, and the HRs of the highest score category were 0.82 for total population, 0.84 for men and 0.81 for women [Citation13]. The NIH-AARP Diet and Health Study indicated that the highest adherence to ACS guidelines was related to reduced cancer risk with HRs of 0.90 for men and 0.81 for women [Citation11]. In a Chinese cohort from the Prediction for ASCVD Risk in China (China-PAR) project, the HRs of adherence to 6 healthy lifestyle factors were 0.83, 0.78 and 0.82, respectively, for all participants, men and women [Citation14]. The current study showed stronger inverse association between healthy lifestyle and cancer risk especially in males. The discrepancy of HRs among studies might be ascribed to the difference in characteristics of study population and methods of healthy lifestyle construction. Newly published systematic review and meta-analysis showed that adopting the healthy lifestyle was associated with 17% to 58% lower risks of bladder, breast, colon, endometrial, oesophageal, kidney, liver, lung, rectal, and gastric cancer [Citation15]. Further stratified analysis by cancer type revealed a solid protective effect of healthy lifestyle on lung cancer and a protective effect on the combination of liver, gastric and colorectal cancer. The varying degrees of associations among site-specific cancers may be due to limited incident cases and other confounders not including in the analysis, such as aspirin use, calcium and vitamin supplements and screening for colorectal cancer, breastfeeding for breast cancer, and aspirin and statin use for liver cancer [Citation28–30]. Although the association between lifestyle pattern and lung cancer was inconsistent across studies, a recent meta-analysis confirmed the protective effect of healthy lifestyle against lung cancer by providing a pooled HR of 0.76 (95% CI: 0.62, 0.93) and the association tended to be stronger when smoking status was included in the lifestyle score [Citation15].
Our study found smoking was the most significant individual factor inversely associated with total cancer within the entire cohort and for men like another Chinese study [Citation14]. China consumed about 40% of the world's tobacco and 62.4% of male adults have ever smoked. Therefore, smoking, as an unhealthy lifestyle factor, should be avoided in old Chinese [Citation31]. Besides, having a healthy diet showed a marginal anti-cancer effect. In contrast, BMI was the only modifiable lifestyle factor presenting cancer prevention effect in women, which was similar to previous findings [Citation11, Citation13]. From 1989 to 2011, the prevalence of overall obesity for women has jumped from 2.6% to 21.4% among Chinese adults [Citation32]. There was an urgent need to enhance public health awareness of keeping healthy weight for women. Although non-smoking has most powerful effect on reducing cancer risk compared with other factors (HR = 0.75, 95% CI: 0.67, 0.84 for non-smoking vs. smoking), combination of all 5 healthy lifestyle factors presented a stronger protective effect against cancer, with the HR of 0.63 (95% CI: 0.51, 0.78). Supportively, we found that adherence to other four healthy lifestyle factors indeed declined the cancer risk among smokers. Therefore, we advocate adopting a comprehensive healthy lifestyle rather than non-smoking only to reduce the incidence of cancer.
Standard epidemiological measures like risk ratios or hazard ratios present significance in aetiology, while RAPs and PAR% are of great importance in public health by indicating age difference at the same risk and preventable proportion caused by risk factors, which could enhance risk communication and behaviour shifts [Citation33]. To our knowledge, this is the first time to detect the delayed risk of developing cancer by healthy lifestyle in Chinese population. The current study revealed that per point increase of the healthy lifestyle score could delay the risk of developing cancer by 2.72 years. The Nurses’ Health Study and the Health Professionals Follow-up Study showed that 33% and 25% of total cancer incidence were attributed to non-adherence to healthy lifestyle patterns in men and women [Citation20]. Similarly, a Chinese cohort found that 18.4%, 2.3% and 7.6% of cancer cases in men, women and both genders could be ascribed to violating all 6 healthy lifestyle factors [Citation14]. Consistently, the current study indicated that 15% and 22% of cancer cases in the entire cohort and in men were prevented by following all 5 healthy lifestyle factors. For site-specific cancers, compared with preventable cancer cases of 47.4% liver cancer and 31.9% colorectal cancer in China-PAR cohort and 21% colorectal cancer for men in the Shanghai Men’s Health Study, our study found 33% of lung cancer and 16% of the combination of liver cancer, gastric cancer and colorectal cancer could be avoided by adopting all 5 healthy lifestyle factors although the PAR% of the latter wasn’t significant [Citation14,Citation34]. PAR% was decided not only by the relative risk but also by the prevalence of risk factors and
the variation of PAR% among studies might be explained by the differential distribution of lifestyle factors among populations. Anyhow, adherence to healthy lifestyle would bring benefits for cancer prevention, even among retired population.
Participants in the current study had an average age of 63 years (IQR: 58-69 years) and their lifestyle may not represent those of the general population. However, voluntary participation of the retired population without apparent cognitive impairment, standard questionnaires and measurement procedures, and strict training for interviewers and staff of anthropometric measurements guaranteed the validity of the information collected in the cohort. Besides, the association between healthy lifestyle and cancer risk didn’t vary between age groups stratified by 65 years. Thus, the cancer risk related to modifiable lifestyle factors in old population was basically detectable. Self-reported chronic diseases like diabetes mellitus, myocardial infarction, or hyperlipidaemia were also adjusted in stepwise Cox regression probably since they could promote tumour transformation and proliferation by inducing metabolic recombination events [Citation35]. However, our study found the association between healthy lifestyle and cancer risk among retired population was independent of chronic diseases which indicated following healthy lifestyle still added benefit of reducing the cancer risk even in patients with chronic diseases.
The current study has some strengths. First, the current study conducted in a retired Chinese population provides the first line evidence for the cancer prevention effects of healthy lifestyle among old Chinese population. Second, the high response rate of 96.2% among the participants during the follow-up minimises the selection and information bias. Third, the full coverage of health service system enables real-time confirmation of disease diagnoses. Fourth, the application of RAPs and PAR% facilitates the understanding of the benefits from healthy lifestyle in public view.
Some limitations also exist. First, the total frequency per week and average duration per session on no more than 3 major physical activities out of 9 optional exercise items were asked, so that the accurate MET-hours per week couldn’t be assessed. However, dichotomisation of the inaccurate METs might attenuate the bias caused by the measurement error. Second, 24-hour recalls of 3 day for dietary intakes weren’t performed at baseline, therefore, proper validation couldn’t be estimated. Third, the dichotomisation of lifestyle factors might lose statistical power and underestimate the association between lifestyle and cancer risk. However, dichotomisation facilitated the assessment and understanding of the cancer risk attributed to the combined lifestyle patterns. Fourth, the healthy lifestyle score in the current study might omit some lifestyle factors with modest influence on cancer risk, leading to underestimation of the association between lifestyle and cancer. However, this score can represent major aspects of lifestyle, which are more accessible and modifiable in Chinese population. Fifth, the interpretation of the associations between healthy lifestyle and risk of site-specific cancers should be cautious due to limited cases of some cancer types.
In conclusion, healthy lifestyle was inversely associated with cancer incidence among the retired population in China. The current study may contribute to the improvement of awareness of healthy lifestyle pattern for cancer prevention among elderly Chinese population.
Supplemental Material
Download MS Word (74.1 KB)Acknowledgements
We would like to appreciate all the participants and staff in the cohort.
Disclosure statement
The authors report no conflict of interest.
Additional information
Funding
References
- Wang H, Naghavi M, Allen C, et al. Global, regional, and national life expectancy, all-cause mortality, and cause-specific mortality for 249 causes of death, 1980–2015: a systematic analysis for the Global Burden of Disease Study 2015. Lancet. 2016;388(10053):1459–1544.
- Yearbook CS. National Bureau of Statistics of China. China Statistical Yearbook. 2012; Beijing: China Union Medical University Press.
- Chen W, Zheng R, Baade PD, et al. Cancer statistics in China, 2015. CA Cancer J Clin. 2016;66(2):115–132.
- Cao Y, Willett WC, Rimm EB, et al. Light to moderate intake of alcohol, drinking patterns, and risk of cancer: results from two prospective US cohort studies. BMJ. 2015;351:h4238.
- Freedman ND, Abnet CC, Caporaso NE, et al. Impact of changing US cigarette smoking patterns on incident cancer: risks of 20 smoking-related cancers among the women and men of the NIH-AARP cohort. Int J Epidemiol. 2016;45(3):846–856.
- Renehan AG, Tyson M, Egger M, et al. Body-mass index and incidence of cancer: a systematic review and meta-analysis of prospective observational studies. Lancet. 2008;371(9612):569–578.
- Liu L, Nishihara R, Qian ZR, et al. Association between inflammatory diet pattern and risk of colorectal carcinoma subtypes classified by immune responses to tumor. Gastroenterology. 2017;153(6):1517–1530.e14.
- Liu L, Shi Y, Li T, et al. Leisure time physical activity and cancer risk: evaluation of the WHO's recommendation based on 126 high-quality epidemiological studies. Br J Sports Med. 2016;50(6):372–378.
- Kushi LH, Doyle C, McCullough M, American Cancer Society 2010 Nutrition and Physical Activity Guidelines Advisory Committee, et al. American Cancer Society Guidelines on nutrition and physical activity for cancer prevention: reducing the risk of cancer with healthy food choices and physical activity. CA Cancer J Clin. 2012;62(1):30–67.
- Wiseman M. The second World Cancer Research Fund/American Institute for Cancer Research expert report. Food, nutrition, physical activity, and the prevention of cancer: a global perspective. Proc Nutr Soc. 2008;67(3):253–256.
- Kabat GC, Matthews CE, Kamensky V, et al. Adherence to cancer prevention guidelines and cancer incidence, cancer mortality, and total mortality: a prospective cohort study. Am J Clin Nutr. 2015;101(3):558–569.
- Warren Andersen S, Blot WJ, Shu XO, et al. Adherence to cancer prevention guidelines and cancer risk in low-income and African American populations. Cancer Epidemiol Biomarkers Prev. 2016;25(5):846–853.
- Romaguera D, Vergnaud AC, Peeters PH, et al. Is concordance with World Cancer Research Fund/American Institute for Cancer Research guidelines for cancer prevention related to subsequent risk of cancer? Results from the EPIC study. Am J Clin Nutr. 2012;96(1):150–163.
- Wang X, Yang X, Li J, et al. Impact of healthy lifestyles on cancer risk in the Chinese population. Cancer. 2019;125(12):2099–2106.
- Zhang YB, Pan XF, Chen J, et al. Combined lifestyle factors, incident cancer, and cancer mortality: a systematic review and meta-analysis of prospective cohort studies. Br J Cancer. 2020;122(7):1085–1093.
- Wang F, Zhu J, Yao P, et al. Cohort Profile: the Dongfeng-Tongji cohort study of retired workers. Int J Epidemiol. 2013;42(3):731–740.
- Zhou Y, Zhang R, Liu Y, et al. Association of regular physical activity with total and cause-specific mortality among middle-aged and older Chinese: a prospective cohort study. Sci Rep. 2017;7:39939.
- Fang Q, Lai X, Yang L, et al. Hearing loss is associated with increased stroke risk in the Dongfeng-Tongji Cohort. Atherosclerosis. 2019;285:10–16.
- Akesson A, Larsson SC, Discacciati A, et al. Low-risk diet and lifestyle habits in the primary prevention of myocardial infarction in men: a population-based prospective cohort study. J Am Coll Cardiol. 2014;64(13):1299–1306.
- Song M, Giovannucci E. Preventable incidence and mortality of carcinoma associated with lifestyle factors among white adults in the United States. JAMA Oncol. 2016;2(9):1154–1161.
- Nechuta SJ, Shu XO, Li HL, et al. Combined impact of lifestyle-related factors on total and cause-specific mortality among Chinese women: prospective cohort study. PLoS Med. 2010;7(9):e1000339.
- Zhao D. Poisson regression adjustment of event rates and its macro procedure ADJ_POIS. SAS Users Group International Conference Proceedings of the Twenty-Fourth Annual International Conference; April 11–14 1999; Miami Beach, Florida.
- Van Blarigan EL, Fuchs CS, Niedzwiecki D, et al. Association of survival with adherence to the American Cancer Society nutrition and physical activity guidelines for cancer survivors after colon cancer diagnosis: the CALGB 89803/alliance trial. JAMA Oncol. 2018;4(6):783–790.
- van Buuren S. Multiple imputation of discrete and continuous data by fully conditional specification. Stat Methods Med Res. 2007;16(3):219–242.
- Brenner H, Gefeller O, Greenland S. Risk and rate advancement periods as measures of exposure impact on the occurrence of chronic diseases. Epidemiology. 1993;4(3):229–236.
- Spiegelman D, Hertzmark E, Wand HC. Point and interval estimates of partial population attributable risks in cohort studies: examples and software. Cancer Causes Control. 2007;18(5):571–579.
- Agha G, Loucks EB, Tinker LF, et al. Healthy lifestyle and decreasing risk of heart failure in women: the Women's Health Initiative observational study. J Am Coll Cardiol. 2014;64(17):1777–1785.
- Orlich MJ, Singh PN, Sabaté J, et al. Vegetarian dietary patterns and the risk of colorectal cancers. JAMA Intern Med. 2015;175(5):767–776.
- McKenzie F, Ferrari P, Freisling H, et al. Healthy lifestyle and risk of breast cancer among postmenopausal women in the European Prospective Investigation into Cancer and Nutrition cohort study. Int J Cancer. 2015;136(11):2640–2648.
- Lee TY, Hsu YC, Tseng HC, et al. Association of daily aspirin therapy with risk of hepatocellular carcinoma in patients with chronic hepatitis B. JAMA Intern Med. 2019;179(5):633–640.
- Liu S, Zhang M, Yang L, et al. Prevalence and patterns of tobacco smoking among Chinese adult men and women: findings of the 2010 national smoking survey. J Epidemiol Community Health. 2017;71(2):154–161.
- Chen Y, Peng Q, Yang Y, et al. The prevalence and increasing trends of overweight, general obesity, and abdominal obesity among Chinese adults: a repeated cross-sectional study. BMC Public Health. 2019;19(1):1293.
- Gellert C, Schottker B, Holleczek B, et al. Using rate advancement periods for communicating the benefits of quitting smoking to older smokers. Tob Control. 2013;22(4):227–230.
- Zhang QL, Zhao LG, Li HL, et al. The joint effects of major lifestyle factors on colorectal cancer risk among Chinese men: a prospective cohort study. Int J Cancer. 2018;142(6):1093–1101.
- Vander Heiden MG, DeBerardinis RJ. Understanding the Intersections between metabolism and cancer biology. Cell. 2017;168(4):657–669.