
Abstract
Background
The Oxford classification of IgA nephropathy (IgAN) was revised in 2016 which lacked sufficient evidence for prognostic value of subclassification of focal segmental glomerular sclerosis (S lesion), and the proper proportion of S lesion for subclassification remains undetermined.
Aim
This study aimed to explore the predictive value of the new subclassification of S score on renal outcomes of IgAN patients.
Methods
348 patients with IgAN-associated S lesion were enrolled. According to the optimal cut-off of 25% established by receiver operating characteristic (ROC) curves, we divided S1 patients into two groups: S1a group (S lesion < 25%) and S1b group (S lesion ≥ 25%). IgAN patients with mild lesion (M0E0S0T0C0) were set as the control group. The clinical features at renal biopsy, pathological findings, and follow-up parameters (follow-up time ranged from 1 to 5 years) were collected. We used univariate and multivariate analyses to assess whether the subclassification of S score could refine risk prediction and clinical utility.
Results
We demonstrated that S lesion ≥ 25% was associated with a more rapid GFR loss and a lower rate of complete remission of proteinuria even adjusted for multiple clinic pathological variables, compared to S1a group (All p values <.05). And the ratio of glomeruli with T lesion and crescents were higher in patients with S lesion ≥ 25%. Data showed that IgAN patients with S lesion ≥ 25% were at an increased risk of poor renal outcomes even with immunosuppression.
Conclusion
This study might recommend new subclassification of S scores (S0 (no S lesion), S1 (S lesion <25% of glomeruli), and S2 (S lesion ≥ 25% of glomeruli)) for the Oxford classification. This model may also help to evaluate pros and cons of immunosuppressive therapy in IgAN patients with different level of S lesion.
S lesion ≥ 25% is an independent risk factor for poor renal outcome in IgAN patients.
This new subclassification of S scores may help to evaluate pros and cons of immunotherapy in IgAN patients with different level of S lesion.
KEY MESSAGES
Introduction
Recently, Oxford classification of IgA nephropathy (IgAN) has become the most common pathological approach to assess disease severity and predict prognosis. The Oxford classification of IgAN was first established as a predictive evaluation model in 2009, which contained MEST score of mesangial hypercellularity (M), end capillary hypercellularity (E), segmental glomerular sclerosis/adhesions (S), and tubular atrophy/interstitial fibrosis (T) [Citation1,Citation2]. In 2016, the IgAN Classification Working Group recommended that crescents should be added to MEST score [Citation3,Citation4]. Several studies and our previous study have validated the predictive value of MEST-C score in retrospective cohorts [Citation4–9].
In the VALIGA study, a retrospective analysis of 1147 European patients demonstrated S lesion to be an independent predictor of a more rapid GFR loss and a lower renal survival [Citation6]. The Oxford cohort of 265 IgAN patients from eight countries also confirmed that S lesion has shown predictive value on rapid rate of renal function decline [Citation2]. The higher proportion of S lesion generally presents more severe chronic lesion, consequently followed by poor immunotherapeutic response. Based on the result of ROC curve in the Oxford cohort, S lesion is only categorized as S1 and S0, i.e. present or absent. IgAN Classification Working Group in 2016 suggested a refinement of the definition of S lesion. Researchers recommended to determine the subclassification of S score according to histologic features (including podocyte hypertrophy, tip lesions, peripheral sclerosis, and end capillary foam cells) [Citation10]. However, no studies have established the exact cut-off of S lesion ratio to refine further risk prediction of IgAN.
The aims of this study were to establish an optimal cut-off of S lesion and to identify the predictive value of the new subclassification of S score on renal outcomes of IgAN patients.
Materials and methods
Study design
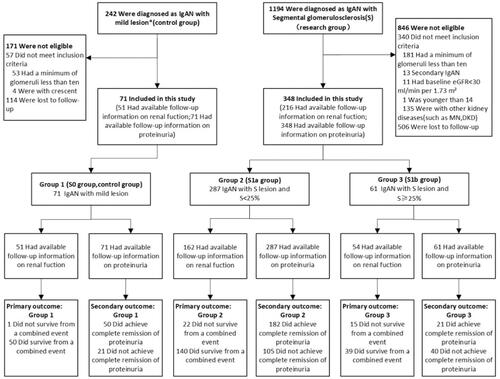
This is a Chinese single-center retrospective study of patients with biopsy-proven IgAN with S lesion. Inclusion required a minimum of 10 glomeruli, age ≥14 years old, baseline estimated glomerular filtration rate (eGFR) ≥ 30 mL/min per 1.73 m2, and a follow-up from 1 to 5 years or a combined event occurred within 1 year. Patients with secondary IgAN (including lupus nephritis, Henoch–Schönlein purpura nephritis, tumour, etc), and IgAN combined with other kidney diseases (including diabetic kidney disease, ANCA–associated necrotizing, crescentic GN, membranous nephropathy, etc) were excluded. We collected baseline and follow-up characteristics of patients: eGFR, proteinuria, the use of renin-angiotensin blockade (RASB) and immunosuppressive therapy received (included glucocorticoids). Eventually, of all the biopsy specimens with S lesion with datasets available for review, 348 had full follow-up information on proteinuria, 216 on renal function. As a comparison group, we selected IgAN patients with mild lesion (M0E0S0T0C0, N = 71) ().
Figure 1. Enrolment and Follow-up. 1,436 patients were assessed for eligibility, of whom 419 were deemed eligible for enrolment and all enrolled in group 1 to 3 (Research group, 348; Control group, 71), including cases that suffered a combined event within 1 year during follow-up. And this study specifies the longest follow-up period is 5 years. *M0E0S0T0C0 according to the Oxford classification of IgAN. S, segmental glomerular sclerosis. S < 25%, the proportion of segmental glomerular sclerosis <25%. S ≥ 25%, the proportion of segmental glomerular sclerosis ≥25%. MN: membranousnephropathy. DKD: diabetic kidney disease.
Definitions
eGFR was calculated from the Chronic kidney disease epidemiology collaboration (CKD-EPI) formula. Immunosuppressive therapy indicated any exposure to immunosuppressive agent regardless of duration or dose, including glucocorticoids. RASB was defined as making use of angiotensin–converting enzyme inhibitor (ACEI) and/or angiotensin receptor blocker (ARB). During follow-up, primary end point was the survival from a combined event defined by either ≥25% reduction in eGFR or eGFR< 30 mL/min per 1.73 m2 [Citation11]. Secondary end point was the complete remission of proteinuria defined by either urine sediment test negative or 24-hour urine protein < 0.3 g/d [Citation12,Citation13].
Pathology review
The renal specimens were processed for immunofluorescence staining, light microscopy, and electron microscopy. All of the renal biopsies were classified and graded according to the Oxford Classification. MEST-C score consists of mesangial hypercellularity (M0, score ≤ 0.5; M1, score >0.5), end capillary hypercellularity (E0, present; E1, absent), segmental sclerosis (S0, present; S1, absent), tubular atrophy/interstitial fibrosis (T0,<25%; T1, 25–50%; T2 > 50%), and crescents (C0, absent; C1, 0–25%; C2, ≥25%). S1 score was defined as the presence of an adhesion or any segment of the tuft involved in sclerosis. For each biopsy, we identified proportions of glomeruli with S lesion, as well as proportion of global glomerular sclerosis. The pathological findings are illustrated in .
Table 1. Baseline and follow-up characteristics of IgAN patients enrolled.
Statistical analyses
For normally distributed variables, data are expressed as mean ± SD and were assessed using the Student t-test or one-way analysis of variance. For nonparametric variables, data are expressed as median (interquartile range) and were analyzed using the Mann-Whitney U test or the Kruskal–Wallis’s test. For categorical variables, data are presented in percentages and were assessed using the Pearson χ2 test or Fisher’s exact test. For ordered variables, data were assessed using the Wilcoxon signed-rank test.
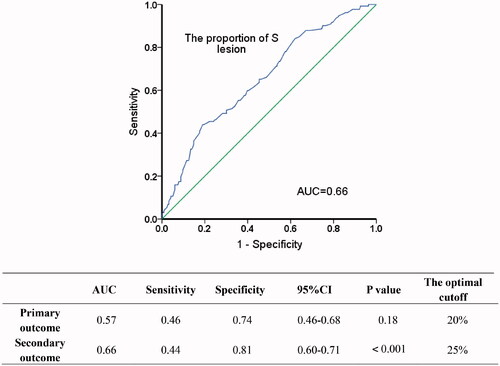
To determine the optimal cut-off of the sub classification of S lesion, we analyzed the relationship between renal outcome and different proportions of glomeruli with S lesion. The ROC curves established an optimal cut-off value of 25% S lesion for predicting renal function decline and proteinuria remission (). Univariate analysis followed by multiple Logistic regression was used to determine independent predictors of S lesion ≥25%. Kaplan–Meier survival curves were used to analyse the relation between endpoint events and the subclassification of S lesion. Survival analysis was performed using Cox regression to analyse the association between each clinicopathologic feature and a combined event to permit a valid multivariate analysis. Finally, we further validated the predictive value of our subclassification by stratifying patients according to their different proportions of global sclerosis of glomeruli and the immunosuppressive therapy. P values were all two-tailed, and p < .05 was considered statistically significant. Confidence interval (CI) included 95% of predicted values. SPSS version 22.0 statistical software was used for all analysis.
Figure 2. ROC curves of the optimal cut-off of proportion of S lesion in IgAN. AUC: area under curve. CI: confidence interval.
Results
Cohort description
The cohort reported data on 348 biopsy-proven primary IgAN patients with S lesion (). The average age was 33 ± 10 years, 135 (39%) cases were male, and 100 (29%) cases had hypertension. At the time of kidney biopsy, the mean eGFR was 98 ± 27 mL/min per 1.73 m2, and initial proteinuria was 0.6 (0.3, 1.5) g/d. S1 patients were followed up for a median of 2.4(1.6, 3.4) years, during which 300 (86%) cases received immunosuppression and 295 (85%) received RASB treatment. About 17% cases experienced a combined event, and 58% achieved complete remission of proteinuria ().
Identification of the optimal sub classification of S lesion
With the aim of identifying the optimal cut-off, we separately carried out ROC curves in terms of primary outcome (216 cases available) and secondary outcome (348 cases available) (). In the cohort of secondary endpoint event, the optimal cut-off value determined by ROC curves was 25.0% (AUC = 0.66, p < .001), whereas it was not statistically significant in primary endpoint event (AUC = 0.57, p = .18). Therefore, the cohort was divided into two groups: S1a group (S lesion < 25%); S1b group (S lesion ≥ 25%). S0 group (IgAN patients with mild lesion, M0E0S0T0C0) was set as a control group.
Clinic pathological features at renal biopsy and during follow-up
Atthe time of renal biopsy, patients in S1b group had lower level of serum albumin (p = .03) and baseline eGFR (p = .001), compared to S1a group; S1b group had higher level of 24 h urine protein (p < .001), and serum uric acid (p = .04). There was no significant difference between the two groups in age, gender, hemoglobin, blood triglyceride, body mass index (BMI), microscopic haematuria, and the incidence of hypertension. Pathological findings showed that the mean proportion of overall S lesion was 15 ± 11%. S1b group was more likely to coexist with T lesion (p = .002) and C lesion (p < .001) than S1a group. Follow-up clinical data proved that patients in S1 group, especially for those with S lesion ≥ 25%, accounted for a higher proportion of receiving immunosuppression (p = .04; including glucocorticoids) and RASB treatment (p = .01) compared with S0 group () (Type of the treatment and complications have shown in Supplement table 1).
Correlations between the optimal sub classification of S lesion and clinic pathological features
We performed univariate Logistic analyses to assess whether a proportion-dependent relationship existed between S lesion ≥25% and clinic pathological features. Results revealed that S lesion ≥ 25% were correlated with lower serum albumin (p = .03), lower initial eGFR at the time of biopsy (p = .001), higher serum uric acid (p = .02), and the presence of T lesion (p = .01) or C lesion (p < .001) (). We performed multivariate analyses in S1a group and S1b group, in which covariates were selected according to findings by univariate analyses and significant clinical variables (including serum albumin, initial eGFR, serum uric acid, T score, and C score at biopsy). Further statistical tests revealed initial eGFR (p = .04), T score (p = .03), and C score (p = .001) were independent variables for patients with S lesion ≥25% (). We considered that the pathological indicator of S lesion ≥ 25% was probably related to lower initial eGFR, the coexisting lesion of tubular atrophy/interstitial fibrosis or crescents.
Table 2. Correlations between S lesion ≥ 25% and clinic pathological features in IgAN patients: univariate and multivariate Logistic regression analysis.
Predictive value of the optimal sub classification of S lesion
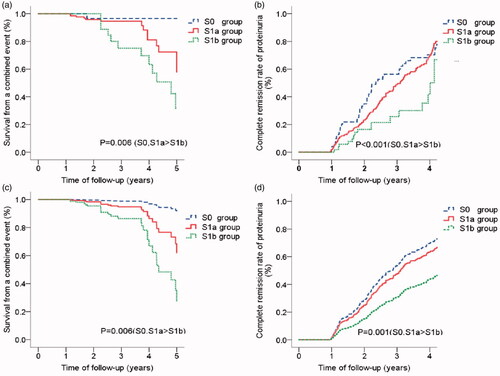
We illustrated whether S lesion ≥ 25% predicted renal outcomes in IgAN patients independently of clinic pathological parameters and Oxford METC scores. Kaplan-Meier analysis showed a lower survival from a combined event () and a lower rate of complete remission of proteinuria in S1b group (). We preformed univariate and multivariate Cox regression analyses. A number of parameters were associated with renal outcomes, including hemoglobin, baseline eGFR, S lesion ≥ 25%, proportions of global sclerosis, and M scores by univariate analysis (data not shown). However, S lesion ≥ 25% remained an independent predictor of a lower survival from a combined event () and a lower rate of complete remission of proteinuria (), even after adjustment for global sclerosis (p = .02) and M score (p = .02).
Figure 3. Associations between the subclassification of S lesion and endpoint events (survival from a combined event and complete remission of proteinuria) in IgAN patients. (1) Kaplan-Meier Curve for the survival of a combined event (a) and complete remission rate of proteinuria (b). a. S0, S1a > S1b: The survival from a combined event for S1b group was significantly lower than S0 group (p = .005) and S1a group (p = .03). b. S0, S1a > S1b: The complete remission rate of proteinuria for S0 group (p < .001) and S1a group (p = .01) were significantly higher than S1b group. (2) Cox regression model for survival of a combined event (c) and complete remission rate of proteinuria (d). c. S0, S1a > S1b: The survival from a combined event for S1b group was significantly lower than S0 group (HR = 0.08, p = .03) and S1a group (HR = 0.37, p = .02) (Adjusted for M scores and the proportions of global sclerosis). d. S0, S1a > S1b: The complete remission rate of proteinuria for S0 group (HR = 2.85, p = .001) and S1a group (HR = 1.94, p = .02) were significantly higher than S1b group (Adjusted for initial eGFR and blood triglyceride).
Correlations between S lesion ≥25% and outcomes in patients with or without immunosuppressive therapy
To further exclude the interference of immunosuppressive therapy on the predictive value of S lesion ≥ 25%, we stratified and analyzed the cohort based on receiving immunosuppressive therapy or not. Stratified analysis showed that S lesion ≥ 25% were correlated with a more rapid GFR loss (OR = 2.59, 95% CI:1.21–5.54, p = .01) and a lower rate of complete remission of proteinuria (OR = 2.71, 95% CI: 1.53–4.79, p = .001) compared to S lesion < 25% ().
Table 3. Differences in renal outcomes between patients with S lesion given immunosuppression or not given immunosuppression.
Correlations between S lesion ≥ 25% and outcomes in patients with varying degrees of Global Glomerular Sclerosis
There was a significant association between proportions of global sclerosis and poor prognosis in the cohort of IgAN with S lesion. To exclude interference of global sclerosis on the predictive value of S lesion ≥ 25%, we also stratified the cohort according to varying degrees of global sclerosis, which contained 5 layers (0–10%, 11–20%, 21–30%, 31–40%, 41–50%). After controlling confounding factors, S lesion ≥25% remained a risk factor for renal function progression (OR = 2.45, 95% CI: 1.16–5.16, p = .02), as well as for complete remission of proteinuria (OR = 2.92, 95% CI: 1.64–5.20, p < .001) ().
Table 4. Differences in renal outcomes between patients with S lesion in varying degrees of global sclerosis.
Discussion
The Oxford Classification of IgA nephropathy was published by the International IgA Nephropathy Network and the Renal Pathology Society in 2009 [Citation1,Citation2]. It is indicated that mesangial hypercellularity (M), segmental glomerulosclerosis (S), and tubular atrophy/interstitial fibrosis (T) could independently predict outcome and provide prognostic information [Citation6,Citation14,Citation15]. Previous researchers have found that S lesion was the only factor that predicted the development of a 50% increase in serum Cr level in patients with early-stage IgAN [Citation16]. Lemley et al. [Citation17] and Asao et al. [Citation18] found that a higher proportion of S lesions were associated with more severe podocyte loss and higher levels of urinary protein excretion. However, few studies were designed to identify the predictive value of proportion of S lesions on renal outcome. In this study, we identified IgAN with S lesion ≥ 25% as a strong determinant of more rapidly declined renal function and lower incidence of complete remission of proteinuria. This new refinement of S score categorized by S lesion ≥ 25% may have a high predictive value for IgAN outcome.
The KDIGO practice guideline on IgAN suggested glucocorticoids and immunosuppressive treatment in patients with persistently elevated urinary protein excretion (>1 g/day) [Citation19]. Some studies have demonstrated that immunosuppressive therapy may improve the prognosis of IgAN patients [Citation20,Citation21]. However, it remains controversial that whether immunosuppressive treatment could improve renal outcomes [Citation22] and whether Oxford-MESTC scores could help to determine the administration of immunosuppressive therapy in IgAN patients, especially in patients with S lesion [Citation1,Citation2]. We found that patients with S lesion ≥ 25% were more likely to receive immunosuppressive therapy, because of their higher level of urine protein. But immunosuppressive therapy in S lesion ≥ 25% patients did not improve renal outcomes eventually. This result may be due to the fact that patients with chronic lesions have a poor response to immunosuppression in comparison to those with active lesions such as crescents [Citation4]. These results indicated that immunosuppressive therapy might be effective for the IgAN patients with S lesion < 25%. By the same token, it might be prudent to apply immunosuppressant to IgAN patients with S lesion ≥ 25%. Therefore, this new subclassification of S lesion could help to evaluate pros and cons of immunosuppressive treatment. In addition to S lesion, other glomerular lesions and clinical characteristics should also be taken into consideration.
Our findings showed that the proportions of T lesion and crescents in glomeruli were higher in patients with S lesion ≥ 25%. Currently, T lesion is considered to be the most reliable indicator for predicting renal progression (including dialysis or renal failure); crescents are also an effective indicator for assessing rapid GFR loss and poor prognosis. We used ROC curves in order to assess the prognostic value of S lesion compared to METC scores (data shown in Supplement figure 1). No significant statistic results were found in primary endpoint event for M(AUC = 0.53), E(AUC = 0.51), T(AUC = 0.55), C(AUC = 0.55), except S(AUC = 0.60, p < .05). AUC value was even higher (AUC = 0.66, p < .001) in the subclassification of S. These results indicated the significant predictability for new subclassification of S. The negative predictive results of METC scores on renal outcome is probably related to the patient selection bias in our study, since the entry criteria demanded all patients had S lesion whereas may not have all kinds of IgAN pathological changes.
We acknowledge some limitations in our study. Firstly, this small single center retrospective study limiting the generalizability of the results. Secondly, considered clinical guidelines usually defined a drop in eGFR ≥25% from baseline representing a significant decrease of renal function and the relatively slow decline of renal function in these IgAN patients, we defined the endpoint of primary outcome as the decline of eGFR ≥ 25% instead of ≥50%, which also helped to increase the number of endpoint events during the trial [Citation11]. Thirdly, AUC values of ROC curves in our study are relatively modest, probably resulted from the attenuation of potential confounding factors that is difficult to avoid in this retrospective study. A future case control experiment design with restricting entry conditions, stratification, and pairing may help to further support our conclusion. Besides, from a clinical point of view, there might be no optimal threshold on the ROC curve for it is a measure of the discriminative ability of a prediction model instead of a measure of utility [Citation23].
Overall, patients with S lesion ≥ 25% manifest as more rapid renal function decline and lower rate of complete remission of proteinuria. Thus, here we recommend a new subclassification of S scores (S0 (no S lesion), S1 (S lesion <25% of glomeruli), and S2 (S lesion ≥25%of glomeruli)) for the Oxford classification, which can provide more accurate evaluation for prognosis and aid to evaluate pros and cons of immunosuppression treatment.
Ethics approval
This study has passed the ethical review of the Second Xiangya Hospital (LYF2020148).
Author contributions
Research idea and study design was contributed by Xuejing Zhu and Shuguang Yuan; statistical analysis/interpretation by Fang Yu. All the authors contributed important intellectual content during manuscript drafting and accepted accountability for the overall work by ensuring that questions pertaining to the accuracy or integrity of this work.
Supplemental Material
Download ()Disclosure statement
All the authors declared no competing interests. The article is not under consideration for publication elsewhere in a similar form in any language.
Data availability statement
The data underlying this article were provided by the Second Xiangya Hospital by permission. Data will be shared on request to the corresponding author with permission of the Second Xiangya Hospital.
Additional information
Funding
References
- Roberts IS, Cook HT, Troyanov S, et al. The Oxford classification of IgA nephropathy: pathology definitions, correlations, and reproducibility. Kidney Int. 2009;76(5):546–556.
- Cattran DC, Coppo R, Cook HT, et al. The Oxford classification of IgA nephropathy: rationale, clinicopathological correlations, and classification. Kidney Int. 2009;76(5):534–545.
- Trimarchi H, Barratt J, Cattran DC, et al. Oxford Classification of IgA nephropathy 2016: an update from the IgA Nephropathy Classification Working Group. Kidney Int. 2017;91(5):1014–1021.
- Haas M, Verhave JC, Liu ZH, et al. A multicenter study of the predictive value of crescents in IgA nephropathy. J Am Soc Nephrol. 2017;28(2):691–701.
- Zhu X, Li H, Liu Y, et al. Tubular atrophy/interstitial fibrosis scores of Oxford classification combined with proteinuria level at biopsy provides earlier risk prediction in lgA nephropathy. Sci Rep. 2017;7(1):1100.
- Coppo R, Troyanov S, Bellur S, et al. Validation of the Oxford classification of IgA nephropathy in cohorts with different presentations and treatments. Kidney Int. 2014;86(4):828–836.
- Zeng CH, Le W, Ni Z, et al. A multicenter application and evaluation of the oxford classification of IgA nephropathy in adult Chinese patients. Am J Kidney Dis. 2012;60(5):812–820.
- Hill GS, Karoui KE, Karras A, et al. Focal segmental glomerulosclerosis plays a major role in the progression of IgA nephropathy. I. Immunohistochemical studies. Kidney Int. 2011;79(6):635–642.
- El Karoui K, Hill GS, Karras A, et al. Focal segmental glomerulosclerosis plays a major role in the progression of IgA nephropathy. II. Light microscopic and clinical studies. Kidney Int. 2011;79(6):643–654.
- Bellur SS, Lepeytre F, Vorobyeva O, et al. Evidence from the Oxford classification cohort supports the clinical value of sub classification of focal segmental glomerulosclerosis in IgA nephropathy. Kidney Int. 2017;91(1):235–243.
- Levin A, Stevens PE, Bilous RW, et al. Kidney disease: improving global outcomes (KDIGO) CKD work group. KDIGO 2012 clinical practice guideline for the evaluation and management of chronic kidney disease. Kidney Int Suppl. 2013;3:1–150.
- Troost JP, Trachtman H, Nachman PH, et al. An outcomes-based definition of proteinuria remission in focal segmental glomerulosclerosis. Clin J Am Soc Nephrol. 2018;13(3):414–421.
- Thompson A, Carroll K, A Inker L, et al. Proteinuria reduction as a surrogate end point in trials of IgA nephropathy. Clin J Am Soc Nephrol. 2019;14(3):469–481.
- Weber CL, Rose CL, Magil AB. Focal segmental glomerulosclerosis in mild IgA nephropathy: a clinical-pathologic study. Nephrol Dial Transplant. 2008;24(2):483–488.
- Tanaka S, Ninomiya T, Katafuchi R, et al. Development and validation of a prediction rule using the Oxford classification in IgA nephropathy. Clin J Am Soc Nephrol. 2013;8(12):2082–2090.
- Gutiérrez E, Zamora I, Ballarín JA, et al. Long-term outcomes of IgA nephropathy presenting with minimal or no proteinuria. J Am Soc Nephrol. 2012;23(10):1753–1760.
- Lemley KV, Lafayette RA, Safai M, et al. Podocytopenia and disease severity in IgA nephropathy. Kidney Int. 2002;61(4):1475–1485.
- Asao R, Asanuma K, Kodama F, et al. Relationships between levels of urinary podocalyxin, number of urinary podocytes, and histologic injury in adult patients with IgA nephropathy. Clin J Am Soc Nephrol. 2012;7(9):1385–1393.
- Radhakrishnan J, Cattran DC. The KDIGO practice guideline on glomerulonephritis: reading between the (guide)lines-application to the individual patient. Kidney Int. 2012;82(8):840–856.
- Shi SF, Wang SX, Jiang L, et al. Pathologic predictors of renal outcome and therapeutic efficacy in IgA nephropathy: validation of the oxford classification. Clin J Am Soc Nephrol. 2011;6(9):2175–2184.
- Fabiano RC, Pinheiro SV, de Almeida Araújo S, et al. Immunoglobulin a nephropathy: pathological markers of renal survival in paediatric patients. Nephrology. 2016;21(12):995–1002.
- Lv J, Zhang H, Wong MG, et al. Effect of oral methylprednisolone on clinical outcomes in patients with IgA nephropathy: the TESTING randomized clinical trial. JAMA. 2017;318(5):432–442.
- Janssens ACJW, Martens FK. Reflection on modern methods: revisiting the area under the ROC Curve. Int J Epidemiol. 2020;49(4):1397–1403.