
Abstract
Introduction
Immunothrombosis has recently been used to describe the responses/mechanisms in thrombosis. Systemic inflammatory markers are prognostic markers for a variety of thrombotic conditions; however, their potential value in predicting portal vein thrombosis (PVT) is unknown. This study aimed to establish an easy-to-use nomogram based on systemic inflammatory markers to predict portal vein thrombosis (PVT) in patients with liver cirrhosis.
Patients and methods
This retrospective study included 478 patients with cirrhosis between January 2013 and January 2021. Reputed systemic inflammatory markers (systemic immune-inflammation index [SII], neutrophil-to-lymphocyte ratio [NLR], monocyte-to-lymphocyte ratio [MLR], and platelet-to-lymphocyte ratio (PLR)) were measured, and the clinical data were recorded. The independent risk factors for PVT were determined using univariate analyses and multivariate logistic regression analyses, and a nomogram to predict the occurrence of PVT was established. The concordance index, receiver operating characteristic curves, and calibration plots were used to evaluate the performance of the model.
Results
A total of 239 patients with PVT and 239 patients without PVT were selected. In the univariate analysis, high SII, NLR, PLR, and MLR were significantly associated with PVT. NLR and PLR were independent risk factors for PVT (P < 0.05) by multivariate analysis. The nomogram had good predictive efficiency for PVT in patients with cirrhosis, with an area under the receiver operating characteristic (AUROC) curves of 0.891 (95% CI 0.862–0.919) and the calibration curves fit as well, indicating that the nomogram had good clinical application value.
Conclusions
PVT in patients with cirrhosis is associated with increased levels of systemic inflammatory markers. We successfully developed a practical nomogram based on NLR and PLR to accurately predict PVT, which is a practical method helping clinicians rapidly and conveniently diagnose and guide the treatment of PVT in patients with cirrhosis.
The present study is the first report on a nomogram based on systemic inflammatory markers in patients with portal vein thrombosis (PVT).
The nomogram had good predictive efficiency and a good clinical application value for predicting PVT in patients with cirrhosis.
Key Messages
Introduction
Portal vein thrombosis (PVT) is defined as thrombosis within the portal vein trunk and intrahepatic portal branches, with or without the involvement of the mesenteric and splenic veins [Citation1]. PVT is a frequent and serious complication in patients with liver cirrhosis (LC). The prevalence of PVT in patients with LC ranges from 0.6% to 26% [Citation2], and the 2-year survival of patients with PVT is reduced by 55% owing to hepatic dysfunction [Citation3]. Remarkably, most patients are asymptomatic at the time of PVT diagnosis [Citation4]. Therefore, there is an urgent requirement for more rapid and easy-to-use diagnostic techniques for the detection of PVT.
In recent years, words like “thromboinflammation,” “immunothrombosis,” and “immunohemostasis” have been used to describe the responses/mechanisms that are involved in both thrombosis and inflammation [Citation5]. The systemic immune-inflammation index (SII), neutrophil-to-lymphocyte ratio (NLR), monocyte-to-lymphocyte ratio (MLR), and platelet-to-lymphocyte ratio (PLR) are reported predictors of venous thrombosis, such as deep vein thrombosis [Citation6,Citation7], cerebral venous thrombosis [Citation8], and thrombosis associated with cancers [Citation9,Citation10]. However, the impact of systemic inflammatory markers on the progression of PVT remains unclear. Our study aimed to establish a practical nomogram based on systemic inflammatory markers to predict PVT, which can help clinicians rapidly and quickly diagnose and guide the treatment of patients with liver cirrhosis.
Materials and methods
Patient selection
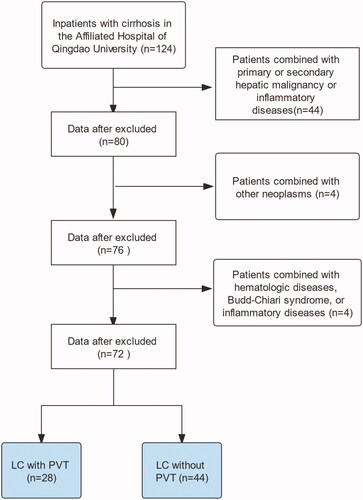
This retrospective study was conducted on patients with LC admitted to the Affiliated Hospital of Qingdao University from January 2013 to January 2021. The diagnosis of LC was based on clinical, laboratory, and radiological analyses, and/or liver biopsies. PVT was diagnosed according to the consensus for the management of PVT in LC (2020, Shanghai) [Citation1]. The inclusion criteria were as follows: (I) age ≥18 years, (II) Doppler ultrasound was the first-choice imaging modality; however, enhanced computed tomography or magnetic resonance imaging could also be used for confirmation at the time of admission to our hospital, and (III) patients with PVT on imaging examination but with insufficient evidence for the diagnosis of cirrhosis, hepatic vein pressure gradient measurement, and liver biopsy. Patients with primary or secondary hepatic malignant tumours, other malignant tumours, haematologic diseases, Budd-Chiari syndrome, non-cirrhotic PVT, inflammatory diseases, and other severe diseases were excluded. All data were collected in our hospital, and all serum indicators were obtained at the time of the first diagnosis of PVT. A study flow chart is illustrated in .
Figure 1. Flow chart of this study.
Data collection
Data included the demographic status, aetiology of the liver disease, clinical laboratory tests, and imaging characteristics. Clinical laboratory tests included D-dimer, activated partial thromboplastin time (APTT), prothrombin time (PT), antithrombin III, international normalised ratio (INR), thrombin time (TT), albumin (Alb), serum creatinine, haemoglobin, platelet count, white blood cell count, neutrophil count, lymphocyte count, monocyte count, a model for end-stage liver disease (MELD) score, and Child-Pugh score. Imaging characteristics included splenic vein diameter, splenic vein velocity, portal vein diameter, and portal vein velocity. Data were collected at the time of diagnosis of LC with PVT from the hospital medical records. The systemic inflammatory markers were calculated as follows: The SII was calculated as the platelet count × neutrophil count/lymphocyte count (109/L). The NLR was calculated as the neutrophil count/lymphocyte count. The MLR was calculated by dividing the monocyte count by the lymphocyte count. The PLR was calculated by dividing the platelet count by the lymphocyte count. The Institutional Review Board of the Affiliated Hospital of Qingdao University (QYFYW2LL26362) approved the use of medical record data for this study.
Statistical analysis
Categorical variables are expressed as frequency and percentage, and the significance was determined using χ2 or Fisher’s exact test. Quantitative variables are expressed as mean ± standard deviation, and the significance was determined using the Student’s t-test. Non-normally distributed variables are expressed as a median and interquartile range, and the significance was determined using the Mann-Whitney U test. The quantitative variables were converted to categorical variables based on the cut-off values. Multivariate logistic regression analyses were performed to identify the independent risk of PVT. The discrimination of the nomogram was measured by calculating the area under the receiver operating characteristic (AUROC) and the concordance index. The model calibration was determined using the Hosmer-Lemeshow technique and calibration curve. Internal validation was performed using bootstrap resampling. We fit the model repeatedly in 1000 bootstrap samples and evaluated its performance on the original samples. Differences were considered significant at P <0 .05. Analyses were performed with the SPSS 24.0 statistical package and R version 3.6.1. The risk of bias and reporting quality for this study were assessed against Transparent Reporting of a Multivariable Prediction Model for Individual Prognosis or Diagnosis and the Prediction model Risk of Bias Assessment Tool.
Results
Characteristics of patients
After screening by the inclusion and exclusion criteria, 239 patients of LC with PVT and 239 patients of LC without PVT were included in the two cohorts. The baseline characteristics of the patients are shown in . There were no significant differences in the age, sex, or history of smoking and alcohol consumption between the patients with or without PVT. The study participants had a mean age of 55.4 ± 9.85 years in the PVT cohort and 54.4 ± 9.13 years in the non-PVT cohort. Cirrhosis caused by hepatitis or alcohol abuse was not significantly different between the two cohorts. However, there were more patients (40/239; 17%) in the non-PVT cohort than in the PVT cohort (9/239; 4%) wherein LC was caused by autoimmune disease. Diabetes mellitus (P= 0.02) was more common in patients with PVT. Child-Pugh levels were significantly different between the patients with and without PVT; however, the MELD scores were not significantly different between the two cohorts. Endoscopic ligation therapy, endoscopic sclerotherapy, and splenectomy were more commonly performed in patients with PVT (allP< 0.001).
Table 1. Baseline demographics and clinical characteristics of the patients.
Cut-off value of the systemic inflammatory markers
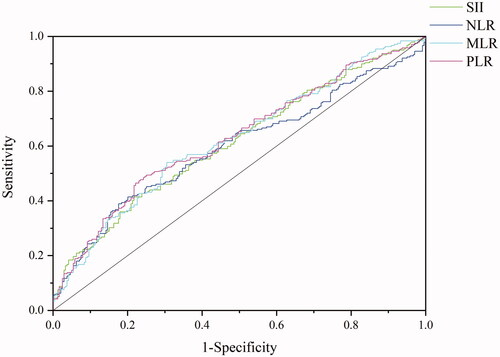
The best cut-off values for SII, NLR, MLR, and PLR were 268.9 (area under the curve, 0.612; P< 0.001), 3.14 (area under the curve, 0.596; P< 0.001), 0.37 (area under the curve, 0.662; P< 0.001), and 103.4 (area under the curve, 0.628; P < 0.001), respectively ().
Figure 2. Receiver operating characteristic curve of a systemic immune-inflammation index (SII), neutrophil-to-lymphocyte ratio (NLR), monocyte-to-lymphocyte ratio (MLR), and platelet-to-lymphocyte ratio (PLR). The cut-off values for SII, NLR, MLR, and PLR were 268.9 (area under the curve, 0.612; p < .001), 3.14 (area under the curve, 0.596; p < .001), 0.37 (area under the curve, 0.662; p < .001), and 103.4 (area under the curve, 0.628; p < .001), respectively.
Univariate and multivariate analyses
As shown in , the systemic inflammatory markers (SII, NLR, MLR, and PLR) were higher in the PVT group than in the non-PVT group (all P< 0.001) and thus were predictive factors for PVT. In addition, APTT (χ2 = 5.741, P=0.019), TT (χ2 = 9.622, P= 0.002), D-dimer (χ2 = 163.664, P< 0.001), splenic vein diameter (χ2 = 27.547,P< 0.001), and splenic vein velocity (χ2 = 14.75, P< 0.001) were significantly different between PVT group and non-PVT group. The significant factors in the univariate analysis in , Citation2 were included in the multivariate logistic regression analysis (). NLR ≥ 3.14, PLR ≥ 103.35, endoscopic ligation, D-dimer, splenectomy, splenic vein diameter, and absence of autoimmune liver disease were independently associated with PVT.
Table 2. Results of univariate analysis.
Table 3. Results of the multivariate logistic regression analysis.
Nomogram to predict the probability of PVT
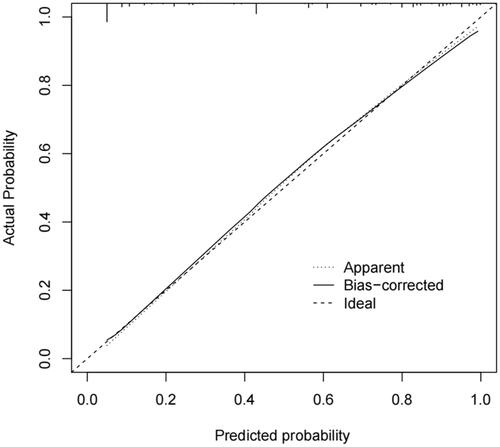
A nomogram was established based on the NLR ≥ 3.14, PLR ≥ 103.35, endoscopic ligation, D-dimer, splenectomy, splenic vein diameter, and absence of autoimmune liver disease, which were used to predict the probability of PVT by adding the score corresponding to each factor and projecting the total score to the bottom scale (). The AUROC curve of the model was 0.891 (95% CI: 0.862–0.919) (). The Hosmer-Lemeshow test revealed that the χ2 was 2.491 (P= 0.928). The concordance index was 0.891. The calibration plots for bootstrap resampling validation showed good consistency ().
Figure 3. Nomogram to predict the probability of portal vein thrombosis (PVT). To use this nomogram, the specific value for each patient should be located on each variable axis, and a line plotted upward to determine the points for each variable value. The sum of the points can be found on the “Total Points axis,” and a perpendicular line drawn downwards determines the risk of PVT.
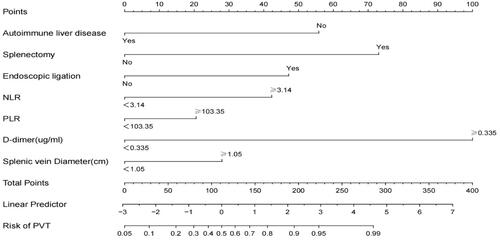
Figure 4. Receiver operating characteristic (ROC) curve of the model. The area under the ROC curve was 0.891 (95% confidence intervals 0.862–0.919).
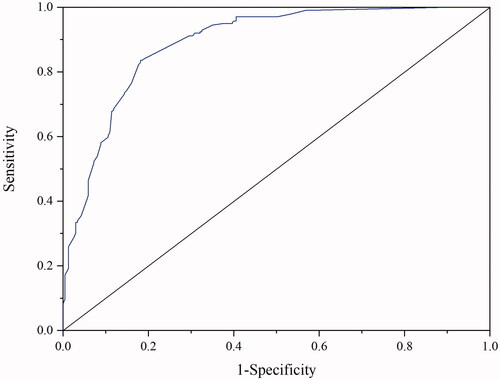
Figure 5. Calibration plots of the nomogram.
Discussion
In recent years, words like “thromboinflammation,” “immunothrombosis,” and “immunohemostasis” have been used to describe responses/mechanisms that are involved in both thrombosis and inflammation [Citation5]. Some studies have proposed a hypothesis based on the systemic activation of the coagulation system in response to the dysregulation of the inflammatory markers [Citation11]. This study found that the NLR and PLR were independently associated with PVT. If NLR is ≥3.14 or PLR ≥103, the risk of PVT will be 2.89 times or 2.23 times in patients without PVT, respectively. Compared to other prognostic nomograms of PVT [Citation12,Citation13], the model of this study cites inflammation indexes as predictors, while NLR and PLR can be easily obtained from routine blood indicators. This nomogram based on systemic inflammatory markers is practical, quantitative, and intuitive, and thus is convenient for use by clinicians.
It has been reported that patients with cirrhosis have a hypercoagulable state resulting from the increased levels of factor VIII and decreased levels of protein C, which may result in the development of PVT [Citation14]. In this study, the patients with PVT had a significantly higher serum level of D-dimer than patients without PVT, which further provided evidence of hypercoagulation, as reported by others [Citation15,Citation16]. The role of diabetes in venous thrombosis remains controversial. Patients with diabetes mellitus have a hypercoagulable state that may increase their risk for thromboembolism, such as microvascular occlusive disease. However, some studies showed no association between diabetes mellitus and the incidence of venous thrombosis [Citation17,Citation18]. This was not an independent risk factor for PVT in this study.
The reported incidence of PVT in patients with cirrhosis following splenectomy was 24–29% [Citation19]; however, the mechanism of the PVT is still under investigation, which may be related to a hypercoagulable state, platelet activation, modification in endothelial cells, or hemodynamic changes [Citation20,Citation21]. Studies have reported that splenectomy may predispose patients with or without cirrhosis to PVT [Citation22]. Splenic vein diameter has been reported as a risk factor for post-splenectomy PVT in several reports [Citation23–25]. The high hemodynamic status of the spleen affects the peripheral platelet count. In general, the larger thediameter and flow of the splenic vein, the lower the white blood cell count [Citation26]. We also found that an increased splenic vein diameter was a risk factor for PVT in LC. A decrease in the blood flow in the portal vein could be associated with the development of PVT following splenectomy, although no significant difference in the reduction of the portal flow was found between patients with and without PVT in the current study.
One meta-analysis demonstrated that endoscopic variceal ligation for primary prophylaxis of oesophageal varices in adults with cirrhosis reduced the incidence of variceal haemorrhage and mortality compared with no therapy [Citation27]. Exposure to surgery or invasive procedures potentially increases the risk of developing bacterial infections in patients with LC, which may affect the markers of inflammation. Lin et al. demonstrated that there is a significant risk of asymptomatic bacteraemia and bacterial peritonitis following elective variceal ligation [Citation28]. However, Maimone et al. suggested that endoscopic ligation is not a risk factor for bacterial infection in patients with LC [Citation29]. Endoscopic ligation was found to be an independent risk factor for PVT. Endoscopic sclerotherapy has also been reported as a risk factor for PVT [Citation15]; however, it was not a statistically significant factor in this study. Particular attention should be paid to PVT following endoscopic treatment.
Inflammation is one of the most typical features of chronic autoimmune liver disease [Citation30]. Patients without LC with autoimmune diseases, such as antiphospholipid disease, have an increased risk for PVT [Citation31]; however, there is no correlation between autoimmune liver disease and PVT in patients with LC. The results of this study suggest that patients with cirrhosis, but no evidence of autoimmune liver disease, still have an increased tendency for the development of PVT. Our study had several strengths and limitations: This was a monocentric and retrospective study design. Therefore, large-scale multicenter studies are required for more representative samples with higher statistical power.
Conclusion
PVT in patients with LC is associated with increased levels of systemic inflammatory markers. We successfully developed a practical nomogram based on NLR and PLR to accurately predict PVT, which may help clinicians rapidly and easily diagnose and further guide the treatment of PVT in patients with LC.
Author contributions
Yueyi Xing made the major contribution to performing the experiments and drafted the manuscript. Zibin Tian obtained institutional review board approval. Yueping Jiang contributed to the data acquisition. Ge Guan, Qinghui Niu, Xueguo Sun and Rongshuang Han assisted in statistical analysis. Xue Jing is the guarantor of the study and made the major contribution to the conception and design of the study, revised the manuscript. All authors read and approved the final manuscript prior to the submission.
| Abbreviations | ||
| PVT | = | Portal vein thrombosis |
| SII | = | Systemic immune-inflammation index |
| NLR | = | Neutrophil to lymphocyte ratio |
| PLR | = | Platelet to lymphocyte ratio |
| MLR | = | Monocyte to lymphocyte ratio |
| MELD | = | Model for End-Stage Liver Disease |
| INR | = | International normalised ratio |
| OR | = | Odds ratio |
| CI | = | Confidence interval |
| AUROC | = | Area under the receiver operating characteristic. |
Disclosure statement
We declare that there are no conflicts of interest regarding the publication of this paper.
Data availability statement
The data that support the findings of this study are available from the author, upon reasonable request.
Additional information
Funding
References
- Consensus for management of portal vein thrombosis in liver cirrhosis (2020, shanghai). J Dig Dis. 2021;22(4):176–186.
- Gîrleanu I, Trifan A, Stanciu C, et al. Portal vein thrombosis in cirrhotic patients – it is always the small pieces that make the big picture. World J Gastroenterol. 2018;24(39):4419–4427.
- Samant H, Asafo-Agyei KO, Garfield K. Portal vein thrombosis. Treasure Island (FL): StatPearls Publishing; 2021.
- Senzolo M, Garcia-Tsao G, García-Pagán J. Current knowledge and management of portal vein thrombosis in cirrhosis. J Hepatol. 2021;75(2):442–459.
- Guo L, Rondina MJFii. The era of thromboinflammation: platelets are dynamic sensors and effector cells during infectious diseases. Front Immunol. 2019;10:2204.
- Kuplay H, Erdoğan SB, Bastopcu M, et al. The neutrophil-lymphocyte ratio and the platelet-lymphocyte ratio correlate with thrombus burden in deep venous thrombosis. J Vasc Surg Venous Lymphat Disord. 2020;8(3):360–364.
- Farah R, Nseir W, Kagansky D, et al. The role of neutrophil-lymphocyte ratio, and mean platelet volume in detecting patients with acute venous thromboembolism. J Clin Lab Anal. 2020;34(1):e23010.
- Tekesin A, Tunç A. Inflammatory markers are beneficial in the early stages of cerebral venous thrombosis. Arq Neuro-Psiquiatr. 2019;77(2):101–105.
- Liu D, Zhu Y, Chen W, et al. Relationship between the inflammation/immune indexes and deep venous thrombosis (DVT) incidence rate following tibial plateau fractures. J Orthop Surg Res. 2020;15(1):241.
- Carr BI, Guerra V, Donghia R. Portal vein thrombosis and markers of inflammation in hepatocellular carcinoma. J Gastrointest Cancer. 2020;51(4):1141–1147.
- Di Minno M, Calcaterra I, Lupoli R, et al. Hemostatic changes in patients with COVID-19: a meta-analysis with meta-regressions. J Clin Med.2020;9(7):2244.
- Xu W, Cheng Y, Tu B. [Construction and validation of a nomogram for predicting the risk of portal vein thrombosis after splenectomy in patients with hepatitis B cirrhosis]. J South Med Univ. 2020;40(9):1265–1272.
- Yuan HL, Wang M, Chu WW, et al. Nomogram model for prediction of portal vein thrombosis in patients with liver cirrhosis after splenectomy: a retrospective analysis of 2 independent cohorts. Med Sci Monit. 2021;27:e929844
- von Köckritz L, De Gottardi A, Trebicka J, et al. Portal vein thrombosis in patients with cirrhosis. Gastroenterol Rep. 2017;5(2):148–156.
- Zhang Y, Xu B, Wang X, et al. Prevalence and clinical significance of portal vein thrombosis in patients with cirrhosis and acute decompensation. Clin Gastroenterol Hepatol. 2020;18(11):2564–2572.e1.
- Malaguarnera M, Latteri S, Bertino G, et al. D-dimer plasmatic levels as a marker for diagnosis and prognosis of hepatocellular carcinoma patients with portal vein thrombosis. CEG. 2018;11:373–380.
- Li-Gao R, Morelli VM, Lijfering WM, et al. Glucose levels and diabetes are not associated with the risk of venous thrombosis: results from the MEGA case-control study. Br J Haematol. 2019;184(3):431–435.
- Gariani K, Mavrakanas T, Combescure C, et al. Is diabetes mellitus a risk factor for venous thromboembolism? A systematic review and meta-analysis of case-control and cohort studies. Eur J Intern Med. 2016;28:52–58.
- Jiang GQ, Bai DS, Chen P, et al. Predictors of portal vein system thrombosis after laparoscopic splenectomy and azygoportal disconnection: a retrospective cohort study of 75 consecutive patients with 3-months follow-up. Int J Surg. 2016;30:143–149.
- Naymagon L, Tremblay D, Mascarenhas J, et al. Characteristics, anticoagulation, and outcomes of portal vein thrombosis after intra-abdominal surgery. Surgery. 2021;169(5):1175–1181.
- Lu S, Hu G, Chen S, et al. Risk factors of portal vein thrombosis after devascularization treatment in patients with liver cirrhosis: a nested case-control study. Biomed Res Int. 2020; 2020:9583706.
- Intagliata NM, Caldwell SH, Tripodi A. Diagnosis, development, and treatment of portal vein thrombosis in patients with and without cirrhosis. Gastroenterology. 2019;156(6):1582–1599.e1.
- Ogawa S, Yamamoto A, Jogo A, et al. Splenic vein diameter is a risk factor for the portal venous system thrombosis after partial splenic artery embolization. Cardiovasc Intervent Radiol. 2021;44(6):921–930.
- Kuroki T, Kitasato A, Tokunaga T, et al. Predictors of portal and splenic vein thrombosis after laparoscopic splenectomy: a retrospective analysis of a single-center experience. Surg Today. 2018;48(8):804–809.
- de’Angelis N, Abdalla S, Lizzi V, et al. Incidence and predictors of portal and splenic vein thrombosis after pure laparoscopic splenectomy. Surgery. 2017;162(6):1219–1230.
- Luo N, Wang Y, Geng Z, et al. Analysis of feasibility, safety and effectiveness of ultrasound-guided percutaneous microwave ablation of splenic neoplasm. Oncol Lett. 2018;16(4):4807–4812.
- Vadera S, Yong CWK, Gluud LL, et al. Band ligation versus no intervention for primary prevention of upper gastrointestinal bleeding in adults with cirrhosis and oesophageal varices. Cochrane Database Syst Rev. 2019;6(6):Cd012673.
- Lin OS, Wu SS, Chen YY, et al. Bacterial peritonitis after elective endoscopic variceal ligation: a prospective study. Am J Gastroenterol. 2000;95(1):214–217.
- Maimone S, Saffioti F, Filomia R, et al. Elective endoscopic variceal ligation is not a risk factor for bacterial infection in patients with liver cirrhosis. Dig Liver Dis. 2018;50(4):366–369.
- Tao Y, Tian K, Chen J, et al. Network pharmacology-based prediction of the active compounds, potential targets, and signaling pathways involved in danshiliuhao granule for treatment of liver fibrosis. Evid Based Complement Alternat Med. 2019; 2019:2630357.
- EASL clinical practice guidelines: vascular diseases of the liver. J Hepatol. 2016;64(1):179–202.