
Abstract
Background
Thyroid hormones are key regulators of several physiological processes, including differentiation, embryonic development, proliferation, and metabolism. Several prospective studies have shown a relationship between hyperthyroidism and cancer incidence; however, since the association between thyroid hormone levels and lung cancer remains controversial, this study aimed to determine the correlation between the same.
Methods
We retrospectively analyzed 289 patients, who were diagnosed with lung cancer at the Huzhou Central Hospital between January 2016 and January 2021, and 238 healthy subjects. The baseline clinical data of two groups were collected. The concentrations of thyroid hormones, tumor CEA, CYF, SCC, and NSE in both the lung cancer patient and healthy volunteer groups were analyzed. Student’s t-test or Mann–Whitney test was used to compare continuous variables. A chi-square test was adopted to estimate the relationship between serum thyroid hormones level and clinical characteristics of lung cancer cases. ROC curve analyses were used to determine the characteristics of thyroid hormones for recognizing lung cancer.
Results
The results showed that serum thyroid stimulating hormone (TSH), total thyroxine, total triiodothyronine, and free triiodothyronine (FT3) levels were significantly decreased, while free thyroxine (FT4) levels were increased in patients with lung cancer. In addition, FT3 was identified as a potential diagnostic biomarker of stage I–IV lung cancer with the area under the curve values of 0.807. What’s more, FT3 and FT4 were used in combination with CEA and were identified as potential diagnostic biomarkers of stage 0 lung cancer (Tis) with the area under the curve values of 0.774.
Conclusions
Our study highlights the possibility of using thyroid hormones as innovative diagnostic markers for lung cancer.
KEY MESSAGES
Serum TSH, TT4, TT3, and FT3 levels were significantly decreased in patients with lung cancer.
low TT3 concentration was positively associated with age (p < 0.05), sex (p < 0.05), tumor size (p < 0.05) and lymph node metastasis (p < 0.05). Moreover, the concentration of FT3 was dependent on age (p < 0.05) and tumor size (p < 0.05). The serum FT4 concentration was discernible with obviously higher concentration in stage IV patients compared with stage I–III patients (p < 0.05).
When FT3 was used in combination with CEA and CYF, the sensitivity and specificity in the screening for stage I–IV lung cancer were markedly increased to 85.9% and 97.5%, respectively. When we included FT3, FT4, and CEA in the diagnosis, the AUC was 0.774. The sensitivity and specificity of screening for stage 0 lung cancer were increased to 70.2% and 75.2%, respectively.
Introduction
Lung cancer remains the second most common cancer in the United States and continues to rise globally [Citation1]. Despite improvements in drug therapy, including chemotherapy targeted therapy and immunotherapy, lung cancer is the leading cause of cancer-related death in men and women [Citation2]; one of the reasons stated in the literature for high mortality is that a large proportion of patients are diagnosed at an advanced stage [Citation3]. Based on the Tumor Node Metastasis (TNM) staging system, 5-year survival estimates in non-small cell lung cancer ranges from 73% in stage IA to 13% in stage IV disease [Citation4]. Hence, the detection of lung cancer at an early stage is of great importance for increasing the disease-free survival (DFS) and overall survival (OS) of patients [Citation5]. Although early screening of lung cancer by low-dose computed tomography resulted in a 20% mortality reduction, body fluid-based biomarker analysis is still more convenient [Citation6]. Carcinoma embryonic antigen (CEA), CYFRA21-1 (CYF), squamous cell carcinoma (SCC) antigen, and neuron specific enolase (NSE) are extensively used tumor biomarkers of lung cancer and play an important role in surveillance during disease treatment. However, their sensitivity and specificity are unsatisfactory due to benign lung diseases, such as pulmonary fibrosis [Citation7]. Thus, new noninvasive biomarkers for the detection of lung cancer are urgently required.
Thyroid hormones are iodinated endogenous compounds necessary for the regulation of multiple cellular activities, such as cell differentiation, growth, and metabolism [Citation8]. Recent epidemiologic studies have shown a relationship between thyroid hormone concentrations and cancer risk [Citation9]. These studies yielded conflicting results. Hyperthyroidism is associated with a higher risk of pancreatic cancer [Citation10], lung cancer [Citation11], breast cancer [Citation12] and prostate cancer [Citation13]. In contrast, Schmidinger M et al. found that progress was observed in renal cell carcinoma patients with hypothyroidism due to tyrosine kinase inhibitors [Citation14]. Furthermore, data regarding abnormal thyroid function and cancer risk do not provide the diagnostic value of thyroid hormones in lung cancer. Hence, in the current study, we not only assessed the association between thyroid function and lung cancer, but also investigated the diagnostic value of thyroid hormones in lung cancer.
Materials and methods
Study population
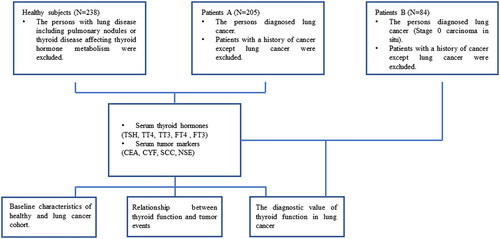
We included 289 patients who were diagnosed with lung cancer at Huzhou Central Hospital, Affiliated Central Hospital Huzhou University, between January 2016 and January 2021 for the retrospective analysis. The patients had not received any local or systemic anticancer treatment before diagnosed. Of the lung cancer patients group A who were diagnosed with stage I–IV, 159 were male and 46 were female. TNM staging was unified based on the eighth edition of IASLC (the International Association for the Study of Lung Cancer system) for lung cancer. The median age of the subjects was 66 years (range: 30–91 years). While, in lung cancer patients group B, 41 males and 43 females (stage 0) were included in the study. Malignancy was confirmed independently based on pathologic specimens reviewed by two pathologists. Meanwhile, 238 health examinees in Huzhou Central Hospital, Affiliated Central Hospital Huzhou University during January 2018 and January 2021 were taken as the control group. Health examinees with lung disease, including pulmonary nodules or thyroid disease affecting thyroid hormone metabolism, were excluded. We also excluded patients with a history of cancer, except for lung cancer. These patients were age- and sex-matched to the control group. The information of the patients and healthy individuals is recorded and summarized in . The study protocol was approved by the Institutional Review Board of Huzhou Central Hospital, Affiliated Central Hospital Huzhou University, and all patients signed an informed consent form when they entered the hospital for examination.
Table 1. Clinicopathological data of all patients and healthy subjects included in the study.
Laboratory measurements
Thyroid function markers, thyroid stimulating hormone (TSH), total thyroxine (TT4), total triiodothyronine (TT3), free thyroxine (FT4), and free triiodothyronine (FT3) were assessed in the leftover blood samples collected from the patients. The assessment of tumor CEA, CYF, SCC, and NSE were routine diagnoses in the patients. The thyroid function markers and tumor CEA, CYF, SCC, and NSE were routine physical examinations in health examinees. The normal range of markers is as follows: TSH, 0.35–4.94 µIU/mL; TT4, 3.37–11.72 µg/dL; TT3, 0.58–1.59 ng/mL; FT4, 0.70–1.48 ng/dL; FT3, 1.58–3.91 pg/mL; CEA, 0–5.00 ng/mL; CYF, <3.30 ng/mL; SCC, 0–1.50 ng/mL; NSE, <15.20 ng/mL. All laboratory measurements were performed once the patients were diagnosed with lung cancer and before any local or systemic anticancer treatment.
Statistical analysis
Continuous data were summarized as mean ± SD. Statistical analyses were performed using SPSS (Statistical Package for the Social Sciences) software (version 19.0; IBM, Chicago, IL, USA), and a p value of 0.05 was considered statistically significant. The Kolmogorov-Smirnov test evaluated the distribution characteristics of continuous data. Student’s t-test or Mann–Whitney test was conducted to assess the differences between the control and lung cancer groups. Pearson’s χ2 associations between thyroid function markers and patient clinicopathological parameters were assessed.
Furthermore, to evaluate the diagnostic value of thyroid function markers, the receiver operating characteristic (ROC) curve was plotted using Medcalc 19.2 (MedCalc bvba, Ostend, Belgium), and relevant results were estimated using the area under the curve (AUC). The corresponding sensitivity and specificity were calculated at different markers cut-offs when the Youden Index is equal to 1.
Results
Baseline characteristics of healthy and lung cancer cohorts
According to the inclusion and exclusion criteria, a total of 238 healthy subjects and 289 patients were included in our study (). In lung cancer patients A group, the mean age of the patients was 66.819 ± 0.655 years (matched to the control group). According to pathological examinations, 154 and 51 patients were diagnosed with non-small cell lung cancer and small cell lung cancer, respectively. Additionally, 179 patients were positive for lymph node metastasis, and 81 patients were classified into stages I + II + III based on the TNM staging system. In lung cancer patients B group, the mean age of the patients was 65.77 ± 0.181 years (matched to the control group). All patients were classified into stages 0 carcinoma in situ. Of the 238 healthy subjects, 55 were female and 183 were male, with a mean age of 65.09 ± 0.700 years. The clinical characteristics of the patients and healthy individuals are summarized in .
Figure 1. Flow diagram showing the study process.
Relationship between thyroid function and tumor events
Thyroid function markers including TSH, TT4, TT3, FT4, and FT3 were detected. As shown in , the concentrations of TSH (p = 0.016), TT3 (p < 0.001), TT4 (p < 0.001), and FT3 (p < 0.001) were significantly lower in the lung cancer A group than in the healthy physical examination group. Nevertheless, FT4 levels were increased in patients with lung cancer (p < 0.001). To determine the correlation of thyroid function markers with clinical characteristics, lung cancer patients were further subdivided into low-and high-concentration groups according to their median value of thyroid function markers. As indicated in , low TT3 concentrations were positively associated with age (p = 0.010), sex (p = 0.010), tumor size (p = 0.036), and lymph node metastasis (p = 0.022). Moreover, the concentration of FT3 was dependent on age (p = 0.002) and tumor size (p = 0.003). Serum FT4 concentration was clearly higher in stage IV patients than in stage I–III patients (p = 0.001).
Figure 2. Serum thyroid hormones concentrations in lung cancer patients and their clinical significance. (A) Serum concentration of thyroid stimulating hormone (TSH) in lung cancer patients (n = 205) and healthy subjects (n = 238). (B) Serum concentration of total thyroxine (TT4) in lung cancer patients (n = 205) and healthy subjects (n = 238). (C) Serum concentration of total triiodothyronine (TT3) in lung cancer patients (n = 205) and healthy subjects (n = 238). (D) Serum concentration of free thyroxine (FT4) in lung cancer patients (n = 205) and healthy subjects (n = 238). (E) Serum concentration of free triiodothyronine (FT3) in lung cancer patients (n = 205) and healthy subjects (n = 238). Data are shown as the mean ± SD.
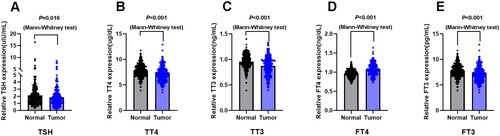
Table 2. Association of serum thyroid hormones levels with clinicopathological parameters of patients A group with lung cancer.
The diagnostic value of thyroid function in lung cancer
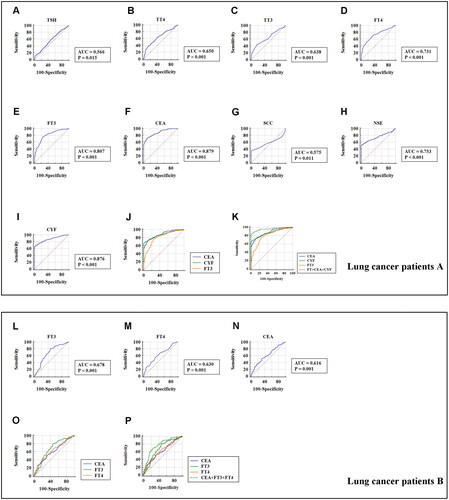
To validate the potential diagnostic utility of thyroid function markers, we firstly performed receiver operating curve (ROC) analysis in stage I–IV lung cancer patients (). The area under the curve values (AUCs) of the five thyroid function markers were as follows: 0.566 for TSH (≤1.76 µIU/mL); 0.650 for TT4 (≤6.65 µg/dL); 0.638 for TT3 (≤0.83 ng/mL); 0.731 for FT4 (>1.01 ng/dL); and 0.807 for FT3 (≤2.77 pg/mL). In addition, the AUCs of the four traditional lung cancer markers were 0.879 for CEA (>3.08 ng/mL), 0.575 for SCC (>1.4 ng/mL), 0.753 for NSE (>15.05 ng/mL), and 0.876 for CYF (>3.16 ng/mL). When we included FT3, CEA, and CYF in the diagnosis, the AUC was 0.962 (). Particularly, in the lung cancer A group with “normal” CEA levels (0–5.00 ng/mL), 76% (73/96) had low FT3 level (≤2.77 pg/mL). While, in the lung cancer A group with “negative” CEA levels (≤3.08 ng/mL), 76% (41/54) had low FT3 level (≤2.77 pg/mL). Hence, FT3 level could partially improve the detection rate of lung cancer in the patients with “normal” CEA levels or “negative” CEA levels.
Figure 3. The receiver operating curve (ROC) for the prediction of stage 0 and I–IV lung cancer based on the serum concentration of thyroid hormones and traditional lung cancer markers, using paired healthy subjects as control. (A) ROC curve showing the diagnostic significance of serum thyroid stimulating hormone (TSH) concentration in the lung cancer patients A group. (B) ROC curve showing the diagnostic significance of serum total thyroxine (TT4) concentration in the lung cancer patients A group. (C) ROC curve showing the diagnostic significance of serum total triiodothyronine (TT3) concentration in the lung cancer patients A group. (D) ROC curve showing the diagnostic significance of serum free thyroxine (FT4) level in the lung cancer patients A group. (E) ROC curve showing the diagnostic significance of serum free triiodothyronine (FT3) level in the lung cancer patients A group. (F) ROC curve showed the diagnostic significance of serum carcinoma embryonic antigen (CEA) concentration in the lung cancer patients A group. (G) ROC curve showing the diagnostic significance of serum squamous cell carcinoma (SCC) concentration in the lung cancer patients A group. (H) ROC curve showing the diagnostic significance of serum neuron specific enolase (NSE) concentration in the lung cancer patients A group. (I) ROC curve showing the diagnostic significance of serum CYFRA21-1 (CYF) concentration in the lung cancer patients A group. (J) Comparison of ROC curve showing the diagnostic significance of serum CEA, CYFRA21-1 (CYF) and FT3 concentration in the lung cancer patients A group. (K) Comparison of ROC curve showing the diagnostic significance of serum CEA, CYFRA21-1 (CYF), FT3 and FT3 + CEA + CYF concentration in the lung cancer patients A group. (L) ROC curve showing the diagnostic significance of serum free triiodothyronine (FT3) level in the lung cancer patients B group. (M) ROC curve showing the diagnostic significance of serum free thyroxine (FT4) level in the lung cancer patients B group. (N) ROC curve showed the diagnostic significance of serum carcinoma embryonic antigen (CEA) concentration in the lung cancer patients B group. (O) Comparison of ROC curve showing the diagnostic significance of serum CEA, FT3 and FT4 concentration in the lung cancer patients B group. (P) Comparison of ROC curve showing the diagnostic significance of serum CEA, FT3, FT4 and FT3 + FT4 + CEA concentration in the lung cancer patients B group.
Moreover, the sensitivity and specificity of the thyroid function markers were also estimated when they were applied separately or synergistically in the diagnosis of lung cancer. As displayed in and , the sensitivities of five thyroid function markers (TSH, TT3, TT4, FT3, and FT4) were 59%, 43.41%, 39%, 75.6%, and 66.83%, respectively, and the sensitivities of the four traditional lung cancer markers (CEA, NSE, SCC, and CYF) were 73%, 52.2%, 34.6%, and 66.2%, respectively. Furthermore, the specificities of the five thyroid function markers (TSH, TT3, TT4, FT3, and FT4) were 52.1%, 83.61%, 85.3%, 76.1%, and 69.33%, respectively, and the specificities of the four traditional lung cancer markers (CEA, NSE, SCC, and CYF) were 88.6%, 98.3%, 100%, and 99.2%, respectively. When FT3 were used in combination with CEA and CYF, the sensitivity and specificity of screening for lung cancer were markedly increased to 85.9% and 97.5%, respectively. These results showed that FT3 might distinguish stage I–IV lung cancer cases from healthy controls, especially in patients with “normal” CEA levels.
Figure 4. The sensitivity and specificity of markers to differentiate lung cancer patients with different TNM stage from healthy subjects. (A) The sensitivity, specificity and cut-off value of TSH concentration in the lung cancer patients A group. (B) The sensitivity, specificity and cut-off value of TT4 concentration in the lung cancer patients A group. (C) The sensitivity, specificity and cut-off value of TT3 concentration in the lung cancer patients A group. (D) The sensitivity, specificity and cut-off value of FT4 concentration in the lung cancer patients A group. (E) The sensitivity, specificity and cut-off value of FT3 concentration in the lung cancer patients A group. (F) The sensitivity, specificity and cut-off value of CEA concentration in the lung cancer patients A group. (G) The sensitivity, specificity and cut-off value of SCC concentration in the lung cancer patients A group. (H) The sensitivity, specificity and cut-off value of NSE concentration in the lung cancer patients A group. (I) The sensitivity, specificity and cut-off value of CYF concentration in the lung cancer patients A group. (J) The sensitivity, specificity and cut-off value of FT3 concentration in the lung cancer patients B group. (K) The sensitivity, specificity and cut-off value of FT4 concentration in the lung cancer patients B group. (L) The sensitivity, specificity and cut-off value of CEA concentration in the lung cancer patients B group.
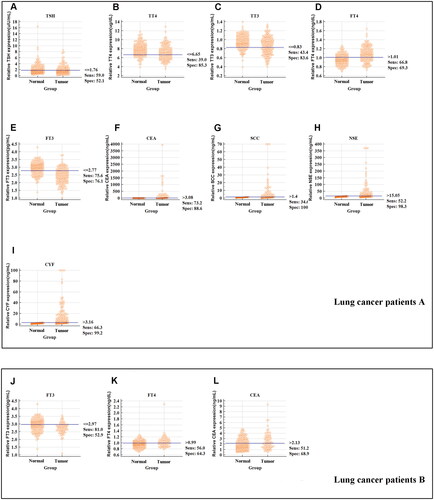
Table 3. The assessment of a biomarker role of the thyroid hormones and traditional lung cancer markers in lung cancer.
Furthermore, additional analysis evaluated the diagnostic utility of thyroid function markers in stage 0 lung cancer patients B group. As presented in and , ROC curve showed that FT3 (≤2.97 pg/mL) and FT4 (> 0.99 ng/dL) level might distinguish stage 0 lung cancer patients from healthy controls with a sensitivity and specificity of 81%, 52.9% and 56%, 64.30%, respectively. When we included FT3, FT4, and CEA in the diagnosis, the AUC was 0.774. The sensitivity and specificity of screening for stage 0 lung cancer were increased to 70.2% and 75.2%, respectively.
Discussion
The effects of thyroid hormones on human solid tumors are complex, especially for TSH. Several prospective studies have evaluated the association between thyroid hormones and cancer risk. Alf Inge Hellevik et al. found that low thyrotropin concentrations (<0.50 mU/L) were associated with a 1.34-fold increased risk of cancer [Citation15]. However, Samer R. Khan et al. demonstrated that there was a negative correlation between cancer incidence and TSH, but the correlation was not significant [Citation16]. A more recent study conducted by Mariana F. Gayyed showed that a high thyroid hormone receptor α1 expression level was associated with shorter OS of lung squamous cell carcinoma [Citation17]. In this retrospective study, we assessed the relationship between thyroid function and lung cancer. Our results showed that the concentration of FT4 in lung cancer was higher than that in healthy controls, while there was a negative association between other thyroid hormone (including TSH, TT3, TT4, and FT3) concentrations and lung cancer.
In addition, the role of thyroid hormones in lung cancer development has not yet been clearly elucidated. In vitro, T4 at physiologic free hormone concentrations and T3 at supraphysiologic concentrations stimulated cell proliferation and increased PCNA abundance in lung cancer cells [Citation18]. This phenomenon can be responsible for an integrin αvβ3-dependent mechanism and be abrogated by the αvβ3 inhibitor Tetrac. Further mechanistic research showed that T4 and T3 bind αvβ3, leading to the activation of the MAPK/ERK1/2 or PI3K-AKT pathway, followed by the upregulation of p21, HIF-1a, Ndrg2, and so on [Citation19]. Recent in vivo research has confirmed that treatment with only T4, but not T3, promoted lung cancer growth in an orthotopic mouse model [Citation20]. We extended the existing evidence regarding the important role of thyroid hormones in lung cancer by analyzing the association between thyroid hormones and clinicopathologic characteristics of lung cancer. It was shown that the enhancement of FT4 tended to be greater in the more advanced cancer stage, while low T4 concentration might occur in elderly and more cancer mass patients. Although we enrolled two groups that were matched by age and sex, the limitations of our study are its retrospective nature. Further prospective studies are needed to confirm the association between thyroid hormone levels and the clinicopathological features of lung cancer patients.
Early screening is still an effective approach for decreasing the mortality of lung cancer. To date, the search for a reliable and non-invasive biomarker of lung cancer has been unsuccessful. In the present study, we evaluated the diagnostic value of thyroid hormone levels in lung cancer. Remarkably, in stage I–IV lung cancer patients, the ROC analysis indicated that FT3 had potential diagnostic efficiency for lung cancer with a high AUC of 0.807, respectively. Furthermore, the combination of thyroid function markers (FT3) and traditional lung cancer markers (CEA and CYF) might be useful for the efficient diagnosis of lung cancer, with an AUC of 0.962. While, in stage 0 lung cancer patients, the combination of these markers (FT3, FT4 and CEA) showed a higher detection capacity, suggesting that their application as a panel might allow for the early detection of lung cancer.
In conclusion, compared with healthy people, the concentrations of TSH, TT3, TT4, FT3, and FT4 were significantly abnormal in patients with lung cancer. The concentrations of TT3 and FT3 were associated with age and tumor size. Meanwhile, serum FT4 concentration is related to the TNM stage. More importantly, FT3 might act as biomarkers for the diagnosis of lung cancer. Nonetheless, there are some limitations that should be acknowledged. First, this study was retrospective and had a limited sample size. Second, the underlying molecular mechanisms of THs and TRs in lung cancer remain uncertain, and future in vitro studies must be done.
Author contributions
MZC, ZMJ and QGQ collected clinical samples; SPT, JDX and WB analyzed the data; LZC designed this study. All authors have read and approved the final manuscript.
Acknowledgements
We would like to thank Xiaoyan Wang for partial laboratory measurements and the patients for providing samples for this study.
Data availability statement
Original data will be provided upon request after removal of personal identifiers.
Disclosure statement
No potential conflict of interest was reported by the author(s).
Additional information
Funding
References
- Bade BC, Dela Cruz CS. Lung cancer 2020: epidemiology, etiology, and prevention. Clin Chest Med. 2020;41:1–10.
- Mazzone P, Mekhail T. Current and emerging medical treatments for non-small cell lung cancer: a primer for pulmonologists. Respir Med. 2012;106(4):473–492.
- Del Rivero J, Enewold L, Thomas A. Metastatic lung cancer in the age of targeted therapy: improving long-term survival. Transl Lung Cancer Res. 2016;5(6):727–730.
- Woodard GA, Jones KD, Jablons DM. Lung cancer staging and prognosis. Cancer Treat Res. 2016;170:47–75.
- Strope SA, Andriole GL. Prostate cancer screening: current status and future perspectives. Nat Rev Urol. 2010;7(9):487–493.
- Clausen MM, Langer SW. Improving the prognosis for lung cancer patients. Acta Oncol. 2019;58(8):1077–1078.
- Fahim A, Crooks MG, Wilmot R, et al. Serum carcinoembryonic antigen correlates with severity of idiopathic pulmonary fibrosis. Respirology. 2012;17(8):1247–1252.
- Lin HY, Chin YT, Yang YC, et al. Thyroid hormone, cancer, and apoptosis. Compr Physiol. 2016;6:1221–1237.
- Krashin E, Piekielko-Witkowska A, Ellis M, et al. Thyroid hormones and cancer: a comprehensive review of preclinical and clinical studies. Front Endocrinol. 2019;10:59.
- Ko AH, Wang F, Holly EA. Pancreatic cancer and medical history in a population-based case-control study in the San Francisco Bay area, California. Cancer Causes Control. 2007;18(8):809–819.
- Mazzoccoli G, Pazienza V, Piepoli A, et al. Alteration of hypothalamic-pituitary-thyroid axis function in non-small-cell lung cancer patients. Integr Cancer Ther. 2012;11(4):327–336.
- Chen YK, Lin CL, Chang YJ, et al. Cancer risk in patients with graves’ disease: a nationwide cohort study. Thyroid. 2013;23:879–884.
- Lehrer S, Diamond EJ, Bajwa AM, et al. Association between serum triiodothyronine (t3) level and risk of disease recurrence in men with localized prostate cancer. Prostate Cancer Prostatic Dis. 2001;4(4):232–234.
- Schmidinger M, Vogl UM, Bojic M, et al. Hypothyroidism in patients with renal cell carcinoma: blessing or curse? Cancer. 2011;117(3):534–544.
- Hellevik AI, Asvold BO, Bjoro T, et al. Thyroid function and cancer risk: a prospective population study. Cancer Epidemiol Biomarkers Prev. 2009;18:570–574.
- Khan SR, Chaker L, Ruiter R, et al. Thyroid function and cancer risk: the Rotterdam study. J Clin Endocrinol Metab. 2016;101:5030–5036.
- Mohamed F, Abdelaziz AO, Kasem AH, et al. Thyroid hormone receptor alpha1 acts as a new squamous cell lung cancer diagnostic marker and poor prognosis predictor. Sci Rep. 2021;11(1):7944.
- Meng R, Tang HY, Westfall J, et al. Crosstalk between integrin alphavbeta3 and estrogen receptor-alpha is involved in thyroid hormone-induced proliferation in human lung carcinoma cells. PLoS One. 2011;6:e27547.
- Liu YC, Yeh CT, Lin KH. Molecular functions of thyroid hormone signaling in regulation of cancer progression and anti-apoptosis. Int J Mol Sci. 2019;20:4986.
- Latteyer S, Christoph S, Theurer S, et al. Thyroxine promotes lung cancer growth in an orthotopic mouse model. Endocr Relat Cancer. 2019;26:565–574.