
Abstract
Introduction
The therapeutic options for thrombocytopenia in non-severe aplastic anaemia (NSAA) are limited. Avatrombopag (AVA) is prescribed for thrombocytopenic diseases but not for NSAA.
Methods
Herein, we conducted a phase 2, non-randomized, single-arm trial to explore the efficacy and safety of AVA in refractory/relapsed/intolerant NSAA. AVA dose was initiated at 20 mg/d and titrated to a maximum of 60 mg/d. The primary endpoint was the haematological response at 3 months.
Results
Twenty-five patients were analyzed. The overall response rate (ORR) at 3 months was 56% (14/25), with 12% (3/25) achieving a complete response (CR). At a median follow-up of 7 (3–10) months, the OR and CR rates were 52% and 20%, respectively. Responders had a shorter duration of diagnosis of AVA administration than non-responders (10 (6–80) vs 37 (6–480) months, p = 0.027) and belonged to the relapsed/intolerant NSAA type (71% vs 27%, p = 0.047); 44% (8/18) patients previously treated with eltrombopag before enrollment responded at 3 months, with an average prior eltrombopag dose of median 72.5 (50–100) mg/d and an average AVA dose for a response of median 43.5 (20–60) mg/d. 3-month ORR had no significant correlation with eltrombopag exposure (p = 0.09), prior eltrombopag length (R2=0.11), or cumulative eltrombopag dose (R2=0.30). Only one patient relapsed after stopping AVA for 1 month. No serious AVA-related side effects or clone evolution were detected.
Conclusion
AVA is effective and well-tolerated in NSAA patients who are refractory, relapsed, or intolerant to CsA/tacrolimus ± eltrombopag. Earlier treatment and relapsed/intolerant AA may show a better short-term response rate. More studies are needed to define the optimal dose and the long-term efficacy (NCT04728789).
Introduction
Aplastic anaemia (AA) is a disease that occurs as a result of insufficient hemopoiesis. This condition is characterized by low cellularity of bone marrow (BM) and peripheral cytopenia of three cell lineages [Citation1]. As the severity of AA varies among patients, different management approaches are required for different patients. Non-severe aplastic anemia (NSAA) is not uncommon [Citation2–4], and has a substantial prevalence in China [Citation5]. Immunosuppressive therapies (IST), anti-thymocyte globulin (ATG) plus cyclosporine A (CsA), are the front-line therapies for transfusion-dependent NSAA (TD-NSAA) with a response rate of 74% [Citation6,Citation7]. However, in China, most NSAA patients receive only CsA, either due to the high costs of ATG or the difficulties associated with hospital admission [Citation5]. Eltrombopag (EPAG) has been proven to be effective against severe AA or very severe AA and is now recommended as a front-line therapy combined with standard IST [Citation8]. With the widespread use of EPAG as the second-line therapy for AA, the overall response rates (ORRs) are between 40 to 80% in real-world settings [Citation9–11]. A recent clinical trial for EPAG showed improved cell lineages in 50% of the patients with moderate AA or hypo-productive uni-lineage cytopenia [Citation12]. However, for patients for whom EPAG treatment failed, the options for the management of thrombocytopenia, an early symptom of NSAA, are limited.
At the time of this study, only two thrombopoietin receptor agonists (TPO-RAs), i.e. EPAG and avatrombopag (AVA) were launched in China. AVA was first approved in May 2018 by the Food and Drug Administration for the treatment of thrombocytopenia with chronic liver disease (CLD) [Citation13]. Importantly, AVA has a function similar to that of thrombopoietin (TPO) but does not compete with TPO to activate the development of megakaryocytes [Citation14]. AVA synergizes with TPO to stimulate platelet (PLT) production [Citation15–17]. This novel TPO-RA effectively increases PLT in a dose-dependent manner and is more efficient than other TPO-RAs owing to the fact that it is associated with a lower risk of hepatotoxicity, fewer side effects, easy oral formulations, and no relevant interactions with food [Citation18–21]. Unlike the well-described use of EPAG for AA, little is known about the use of AVA for AA, although it has similar effects as EPAG on thrombocytopenia. Several clinical trials have shown the advantage of AVA as compared to other TPO-RAs for some thrombocytopenic diseases like primary immune thrombocytopenia (ITP), not only in terms of quick response but also good tolerance [Citation22,Citation23]. As a TPO-RA with a distinct molecular structure, AVA may show similar effects to EPAG or possibly benefit EPAG refractory patients, like in ITP cases as reported previously [Citation24]. However, there has been no report on AA so far. The efficacy of other TPO-RAs like AVA in the context of EPAG-treated NSAA remains unclear. Therefore, we aimed to explore the efficacy of AVA after the failure of EPAG or IST. Herein, we initiated a clinical trial to treat refractory/relapsed/intolerant AA patients with AVA and reported the efficacy and safety in the short term.
Methods
This trial was a phase 2, non-randomized, single-arm study in patients with NSAA, with refractory or relapsed severe thrombocytopenia, at Peking Union Medical College Hospital from January 2021 to November 2021. This prospective study was approved by the ethics committee of Peking Union Medical College Hospital (PUMCH, approval number: SKX-NSAA-001) and registered at clinicaltrial.gov (NCT04728789) on 28 January 2021. All the eligible patients were fully informed of the study design and signed written informed consents for their participation. Patients could request and withdraw at any time during the trial.
Patients
Eligible patients were 18–75-year-old adults diagnosed with NSAA according to the previously described criteria [Citation6], with refractory/relapsed/intolerant to the standard dose of CsA (3-5 mg/kg to reach the target plasma concentration of 100–200 ng/mL) or tacrolimus (FK506, started at 1 mg twice a day and maintained the plasma concentration of 4–10 ng/mL) with/without EPAG (started at 50 mg once a day, increased at 25 mg/d every bi-week if not responded to a maximum of 150 mg/d). NSAA patients were those with confirmed AA but who did not meet the criteria of severe AA or very-severe AA according to the guidelines [Citation6]. Refractory/relapsed patients were defined as those who did not respond or relapse after at least six months of previous treatment. Intolerant patients were defined as those who could not tolerate CsA or EPAG and were administered second-line therapies due to significant side effects. FK506 was used to substitute CsA in a few cases due to its association with severe gastrointestinal effects or gingival hyperplasia. A complete workup in patients was performed to confirm the diagnosis of AA, especially to exclude inherited BM failure syndromes among young patients and myelodysplastic syndromes (MDS) among the elderly before enrollment. All patients showed at least persistent or relapsed thrombocytopenia, defined as PLT ≤ 30 × 109/L. The main exclusion criteria were (1) congenital AA such as Fanconi anaemia; (2) presence of abnormal chromosome before AVA, e.g. −7/del(7q), complex cytogenetics, +8, del (13q); (3) evidence of other haematological BM disorders, for example, acute myeloid leukaemia (AML) or MDS; (4) paroxysmal nocturnal hemoglobinuria (PNH) clone ≥50%; (5) expected survival time <6 months; (6) pregnant or lactating females; (7) presence of active infections and hepatitis; (8) baseline creatine levels greater than twice the normal age-dependent maximum; (9) history of haematological stem cell transplantation; (10) prior attendance in other clinical trials within the last 6 months; (11) history of thromboembolic events, like acute coronary syndrome or stroke, and (12) use of ATG within 6 months before enrollment. Considering the inaccessibility and unaffordability of ATG in China, we also included patients who never used ATG if they fulfilled the above criteria. EPAG was stopped if there was no response for ≥3 months with at least 100 mg once a day. It had to be stopped at least 6 months before enrollment. Patients with significantly high baseline ferritin were carefully excluded for hemophagocytic lymphohistiocytosis (HLH) according to HLH-2004(25) and HScore [Citation25,Citation26] before enrollment.
Intervention
AVA was initiated at 20 mg/d and increased by 20 mg/d during the bi-weekly follow-up if PLT was not 20 × 109/L higher than baseline. AVA dose was gradually reduced if PLT ≥150 × 109/L. The maximum dose was 60 mg/d, while the minimum was 20 mg/week. No other TPO-RAs were allowed during the experimental time. During the experimental period, CsA or FK506 was continued at a stable dose during the AVA treatment, else, they were stopped for at least 6 months before AVA administration. Iron chelation therapy with deferasirox was allowed if Fer was higher than 1000 ng/mL. Transfusions were allowed for supportive care accordingly [Citation6].
Endpoints
The primary endpoint was the haematological response at 3 months, which presented as the overall response rate (ORR), including complete response (CR) and partial response (PR). CR was defined as PLT >100 × 109/L, haemoglobin (HGB) >w120 g/L for males (110 g/L for females), and neutrophils (NEU) > 1.5 × 10⁹/L [Citation6]. PR was any response observed in PLT, HGB, NEU, or defined as any of the following: double the baseline count, back to the normal count of one or two cell lines, and an increase in 20 × 109/L in PLT if baseline ≤20 × 109/L, or 30 g/L in HGB if initially, it was ≤60 g/L, or 0.5 × 10⁹/L in NEU if initially, it was <0.5 × 10⁹/L [Citation6,Citation8]. For transfusion-dependent patients, transfusion independence for consecutive 8 weeks was also regarded as PR [Citation6,Citation8]. Effectiveness was evaluated among patients at 3 months. Responders continued AVA for an additional three months to stabilize the response if PLT <150 × 109/L and then reduced by 20 mg/d every month. Non-responders at 3 months were re-evaluated; patients who progressed into severe or very severe AA and/or were experiencing life-risk events were not recommended to continue AVA. Otherwise stable NSAA (not progressed) patients continued AVA and were re-assessed at 6 months. Adverse events were graded according to the fifth version of the Common Terminology Criteria for Adverse Events (CTCAE 5.0) [Citation27]. Secondary endpoints were ORRs at 1, 2, and 6 months and cumulative AVA dose at 1, 2, 3, and 6 months. The trial outcomes followed primary goals without change.
Statistical analysis
We followed the two-stage “minimax” design method described previously [Citation28]. Thus, the null and alternative hypotheses were a response probability of ≤10% and ≥30%, respectively. The sample size was determined at 25 patients to test the null versus alternative hypothesis when the significance level and power were set at 0.05 and 80%, respectively. The null hypothesis could not be rejected if the number of responders at 3 months was 5 or less. Descriptive or continuous variables were presented as percentages or medians with range, respectively. The dose of AVA was referred to as the cumulative AVA dose defined as the sum of the daily doses times the respective days. ORR was the sum total of CR and PR. Responders and non-responders were compared by Fisher’s exact test or Kruskal–Wallis test. A significant difference was considered at p < 0.05. All statistical analyses were performed using R version ×64 3.6.3 for Windows.
Results
Baseline characteristics
From January 2021 to November 2021, 30 patients were assessed and 1 was excluded because of developing secondary MDS from AA at enrollment. Twenty nine eligible patients were enrolled and treated with AVA, whose baseline characteristics are presented in and detailed in Table S1. Four patients were treated with AVA for less than two months, either due to loss during follow-up (n = 3) or withdrawal of consent (n = 1) (). A total of 25 patients who were treated with AVA for at least 3 months were included in the final analysis. also summarizes the individual baseline characteristics of these 25 patients. Collectively, there were 13 males and 12 females with a median age of 51 (20–75) years. The median duration from diagnosis to AVA treatment was 19 (6–480) months. At the baseline before AVA treatment, the median PLT was 16 (1–30) ×109/L; HGB was 94 (41–166) g/L; WBC was 2.95 (1.41–8.01) ×109/L; NEU was 1.48 (0.39–4.86) ×109/L, and reticulocyte (RET) was 43.5 (18.9–71.3) ×109/L. Twelve patients had pancytopenia; 9 had bi-lineage cytopenia, and the remaining 4 had thrombocytopenia. The median alanine aminotransferase (ALT) was 11 (4–447) U/L; the median total bilirubin (TBil) was 11.6 (5.0–30.6) µmol/L; the median creatine (Cr) was 80 (41–135) µmol/L, and the median ferritin was 547 (23–37,149) ng/mL. Patients were carefully excluded from HLH. Only 3 patients had ≥1% PNH clone (1–4%). The median BM cellularity was 28 (8–39) %. No abnormal karyotype at baseline was detected. No MDS-related gene mutations were found among the tested patients. 13 patients relapsed (n = 8) or were intolerant (n = 5) and another 12 were refractory to prior therapies. Previous treatments included CsA/FK506 (n = 25) for a median duration of 6 (4–129) months and EPAG (n = 18) for a median of 8 (1–36) months at 72.5 (25–100) mg/d. Sixteen had previous CsA for less than 12 months and 9 for at least 12 months. None of them were treated with ATG before enrollment.
Figure 1. The CONSORT flow diagram. 30 patients were assessed and 1 was excluded because of developing secondary MDS from AA. Twenty-nine eligible patients were enrolled and allocated to receive AVA, as the intention-to-treat group. Four patients were treated with AVA for less than two months, either due to loss of follow-up (n = 3) or withdrawal of consent (n = 1). Twenty-five patients were included in the efficacy analysis.
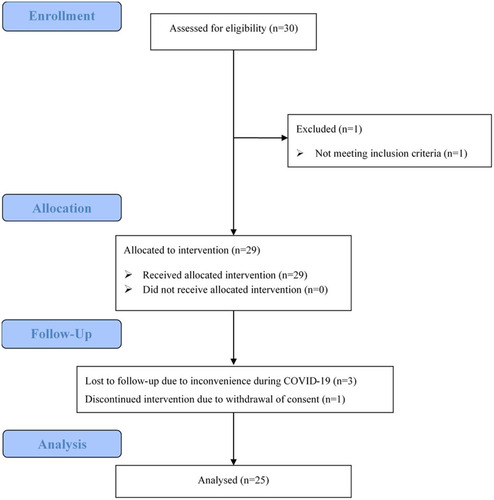
Table 1. Baseline characteristics of the intent-to-treat (n = 29) and the evaluable patients (n = 25).
Adverse events
13 adverse events (AE) were recorded in 11 patients among all the enrolled 29 cases (38%), including 2 with grade 2 and 11 of grade 1 AEs. The grade 2 events were liver dysfunctions that occurred in 2 patients concomitantly treated with CsA/FK506 and returned to normal range after reducing CsA/FK506 dosage. Ten AEs occurred in 9 patients concomitantly treated with CsA/FK506, including grade 1 elevated transaminase or bilirubin in 8 patients and grade 1 increased creatine in 2 patients, which were alleviated by dose regulation or observation alone. Among those treated with AVA alone (n = 3), 33% (1/3) of patients reported grade 1 nausea which was relieved after reducing the dose. There was no treatment-related death, drug-related withdrawal, or clone evolution at the end of follow-up.
Four patients had increased ALT at baseline, one with a slight (46 U/L) and 3 with an overt increase (118–447 U/L). Normal ALT levels were restored within 1 or 2 months after AVA. Three patients showed increased baseline TBil (25.4-30.6 µmol/L). In 1 patient, the levels returned to normal after one month of AVA, while in the other 2, the same level as the baseline was maintained.
Responses
Twenty-five patients who were treated with AVA for at least 3 months were analyzed for responses (not including four patients treated for less than two months). A total of 23 patients were treated with CsA/FK506 + AVA, while only 2 underwent AVA monotherapy. The median time of AVA exposure was 5 (3-10) months and the median dose of AVA was 5400 (2400–14,400) mg. At 1, 2, and 3 months, the ORR was 24% (6/25), 48% (12/25), and 56% (14/25), with 4% (1/25), 4% (1/25), and 12% (3/25) CRRs, respectively. At 3 months, 44% (11/25) patients showed PLT response, 37% (7/19) showed HGB response, and 54% (7/13) showed NEU response (). Seven patients showed improvement in one lineage, 3 in two lineages, and 4 in three lineages (). The ORR was 33% (4/12) in refractory patients and 77% (10/13) in relapsed/intolerant patients (p = 0.047).
Figure 2. Venn diagrams presenting the number of patients with the response for one or more lineages at 3 months (left) and last follow-up (right) at 3 months, 7 patients showed improvement in one lineage, 3 in two lineages, and 4 in three lineages. At a median of 7 (3–10) months follow-up, 11 patients showed a platelet response; 9 showed a haemoglobin response, and 7 showed a neutrophil response.
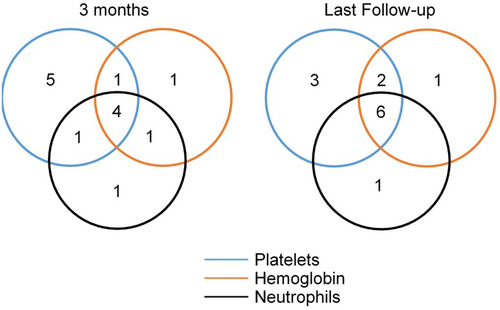
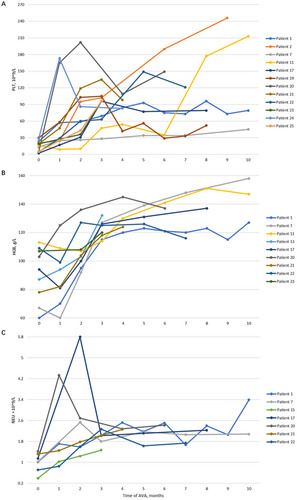
Figure 3. The longitudinal measurement of platelet (PLT, A), haemoglobin (HGB, B), and neutrophil (NEU, C) in responders. At 3 months, 44% (11/25) patients showed platelet response, 37% (7/19) showed haemoglobin response, and 54% (7/13) showed neutrophil response. At 6 months, 58% (7/12) patients showed platelet response, 55% (6/11) showed haemoglobin response, and 83% (5/6) showed neutrophil response. At the last follow-up, 44% (11/25) of patients showed platelet response. 47% (9/19) of patients showed haemoglobin response. 54% (7/13) of patients showed a neutrophil response. One patient who achieved PR after 2-months of AVA treatment and maintenance for 1 month (, patient no. 19) relapsed after 1 month of stopping AVA.
The median follow-up time was 7 (3-10) months. At 4 and 5 months, the ORR was 58% (11/19) and 53% (8/15), respectively. 12 (48%) patients were treated with AVA for at least 6 months. Among them, 11 were treated with CsA/FK506 + AVA, and the remaining one underwent AVA monotherapy. The ORR at 6 months was 58% (7/12), with 25% (3/12) CR. 1 of the 4 refractory (25%) and 6 of the 8 relapsed/intolerant (75%) patients responded to AVA (p = 0.22). 58% (7/12) patients showed PLT response, 55% (6/11) showed HGB response and 83% (5/6) showed NEU response. One patient showed improvement in one lineage, 1 in two lineages, and 5 in three lineages. The mean change in BM cellularity among these 10 patients was −0.1% (95%CI −1.5 to 1.3, p = 0.88) after 6 months of treatment.
Collectively, the final ORR was 52% and CRR was 20%. The median time to haematological responses was 2 (1–3) months, at a median average dose of 40 (20-60) mg/d and a median cumulative dose of 1800 (1200–4200) mg. As for response according to the AVA doses, the ORR was 8% (2/25) at an average daily dose ≤20 mg, 33% (7/21) at 20-40 mg (>20, ≤40), and 56% (5/9) at 40-60 mg (>40, ≤60). 44% (11/25) patients had PLT response, 47% (9/19) patients had HGB response and 54% (7/13) patients had NEU response. The Venn diagrams and longitudinal measurements of PLT, HGB, and NEU in responders for each lineage are presented in and .
No relapse was observed during the follow-up if AVA was taken continuously. However, one patient who achieved PR after 2 months of AVA and 1 month of maintenance (, patient No. 19) relapsed after stopping AVA. No genetic mutations and chromosome evolution were detected at the time of 3- or 6-months follow-up.
Patient characteristics were compared between those with or without a response at 3 months. With similar exposure times and average dosages of AVA (p = 0.26 and 0.56, respectively), there were no differences in sex, age, lineages of cytopenia, complete blood counts (CBC) before AVA, or concomitant use of CsA/FK506 between the two groups (). However, responders experienced a shorter duration (10 (6–80) months) from diagnosis to the administration of AVA as compared to the non-responders (37 (7–480) months, p = 0.027); they also showed a higher percentage of relapsed/intolerant patients (71%, 10/14) than non-responders (27%, 3/11, p = 0.047). The baseline creatine of responders was lower than that of non-responders (72 (41–107) versus 89 (54–135) µmol/L, p = 0.037).
Table 2. Comparisons of baseline characteristics between responders and non-responders.
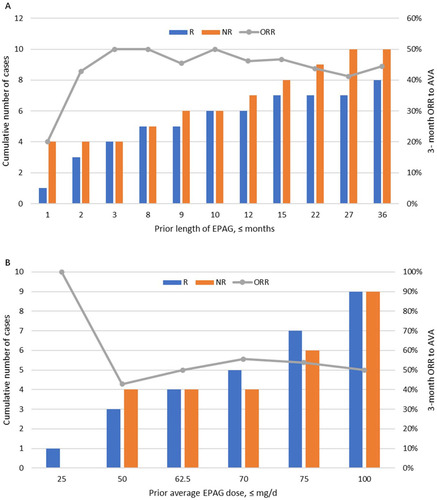
A total of 18 (72%) of the 25 patients were previously treated with EPAG for 8 (1–36) months at an average dose of median 72.5 (25–100) mg/d. Half of them (n = 9) were refractory, whereas the other half were of relapsed or intolerant type. 44% (8/18) of patients previously treated with EPAG before enrollment responded at 3 months, with an average prior EPAG dose of median 72.5 (50–100) mg/d and an average AVA dose for the response of median 43.5 (20–60) mg/d. There were no significant differences in the percentage of response towards AVA between those treated or not treated with EPAG (p = 0.09). Prior length of EPAG use showed no significant linear relationship with the 3-month ORR for AVA (, R2=0.11). Similarly, no significant correlation was found between the previous cumulative EPAG dose and the 3-month ORR for AVA (, R2=0.30).
Figure 4. Relationship between prior eltrombopag (EPAG) and 3-month overall response rate (ORR) to avatrombopag (AVA). 18 (72%) of the 25 patients were previously treated with EPAG for 8 (1–36) months at 72.5 (25–100) mg/d dosage; 44% (8/18) responded to AVA at 3 months. (A) Prior length of using EPAG showed no significant linear relationship with the 3-month ORR of AVA (R2=0.11). (B) There is no significant correlation between the previous cumulative EPAG dose and the 3-month ORR for AVA (R2=0.30).
Ten responders had previous CsA for less than 12 months and four responders for at least 12 months. The response rate was not significant between CsA < 12 months and ≥12 months (p = 0.43). Eight out of the twenty-five patients (32%) received iron chelation therapies, of these, two were responders and six were non-responders. Among those who were only treated for 1 (n = 1) or 2 months (n = 3), none showed any improvements in PLT, HGB, or NEU, at a median average daily dose of 25 (20–30) mg. Therefore, in the intent-to-treat group (n = 29), the ORR was 21% (6/29) and 43% (12/28) at 1 and 2 months, respectively; the ORR according to average daily dose was 7% (2/29), 30% (7/23) and 56% (5/9), at average daily doses of ≤20 mg, 20-40 mg (>20, ≤40), and 40-60 mg (>40, ≤60), respectively.
Discussion
AVA was launched in China with its first approved indication for treating thrombocytopenia in CLD adults [Citation29]. However, patients with thrombocytopenia have various origins, not limited to those due to insufficient liver function [Citation30–32], and may benefit from AVA.; for example, those having a suboptimal response to other TPO-RAs, e.g. EPAG. There are subtle mechanistic differences among TPO-RAs that enhance PLT production despite similar activation of TPO receptors on hematopoietic stem cells [Citation33]. Romiplostim, unlike AVA and EPAG, competes with endogenous TPO because of the same binding site [Citation34]. This may explain why switching between TPO-RAs is clinically efficacious [Citation35,Citation36]. Therefore, current TPO-RAs are available to treat ITP if responses were inadequate in prior treatment (AVA, EPAG, and romiplostim) [Citation37–40].
AVA exerts similar biological functions as TPO in vitro and in vivo. It stimulates the proliferation of c-Mpl–Ba/F3 cells and the differentiation of CD34+ cells, thus producing more megakaryocytes and elevating PLT counts [Citation15,Citation41]. With notable advantages such as easy oral administration, little interaction with food, lower risk of hepatotoxicity, and rare immunogenic risks [Citation23,Citation42], AVA can serve as an alternative for patients with thrombocytopenia refractory or intolerant to other TPO-RAs. EPAG and hetrombopag, are the only TPO-RAs approved for AA treatment [Citation11,Citation43]. However, long-term use of EPAG depletes iron [Citation44]. Substitutes for AA treatment with other TPO-RAs are rare. This is the first study that reports the usage of AVA for patients with refractory/relapsed NSAA; in particular, most of the patients in our cohort were previously treated with EPAG.
In our cohort, all refractory/relapsed patients were treated for at least 6 months with a full dose of CsA/FK506. Even among intolerant patients, the least exposure for CsA/FK506 was 4 months. The ORRs were 24%, 48%, and 56% at 1, 2, and 3 months after AVA, with 4%, 4%, and 12% of CR, respectively. Similar to other TPO-RAs, responders showed improvements in one, two, or three lineages. Most of the patients showed stable responses till the end of follow-up, except for one, who relapsed after stopping AVA for 1 month. Twelve patients were treated for at least 6 months, whereby 4 achieved PR, and 3 showed CR. In total, the final ORR in our cohort was 52% and the CRR was 20%. No significant improvement was observed in BM cellularity after 6 months as reported in a previous study [Citation8]. This was probably because of the fact that our cohort was not treatment-naïve and all patients received CsA/FK506 for more than 4 months, making it difficult to normalize their hematopoiesis.
The delayed response to IST might not play a significant role in the efficacy we obtained. The possible delayed response to IST, if any, occurred between 6 to 12 months after IST [Citation45]. There were 16 patients who had been treated with CsA/FK506 continuously for 6–12 months and could have possibly delayed responses towards CsA/FK506. Their response rate was 60%, which was not significantly different from those who had no possible delayed effects of IST. On the other hand, the period of prior IST was not significantly different between responders and non-responders. However, due to the small number of patients, we cannot fully exclude the delayed response of IST in responders.
We did not observe clonal evolution in this small patient population. The impact of AVA on clonal hemopoiesis was only partially investigated during a relatively short follow-up time and in selected patients with normal karyotypes. A previous study on EPAG reports that two patients developed non-chromosome seven BM cytogenetic abnormalities without dysplasia or increased BM blasts [Citation12]. EPAG treatment has been reported to not increase the rates of relapse and clonal evolution in the IST + EPAG group in the long term, but both events occur earlier when compared historically [Citation46]. The possible acceleration of MDS/AML progression induced by AVA should be carefully followed-up for a longer duration.
Most of our patients were TD-NSAA. We only enrolled patients who had a platelet count less than 30 × 109/L and most of the patients had a platelet count PLT ≤ 20 × 109/L. According to the criteria from the German Aplastic Anemia Study Group [Citation47], TD-NSAA referred to patients who fulfilled the criteria of NSAA and at least one of the following cytopenia, PLT < 20 × 109/L, HGB < 80g/L or ANC < 0.5 × 10⁹/L. Only 4 patients did not meet these criteria but had long courses of AA. So, we mainly focused on TD-NSAA. Moreover, 32% of the patients (n = 8) received iron chelation therapies, which benefitted some patients, as evidenced by improved hematopoiesis [Citation48]. However, iron chelation therapy might not contribute to the observed ORRs. Only 2 patients were responders and the remaining 6 patients showed refractory NSAA and had previously received iron chelation therapies.
Although the sample size was limiting, we tried to identify the prediction factors that favoured the responses. Sex, age, and baseline blood cell count showed no significant influence. However, a shorter duration from diagnosis to the initiation of AVA treatment indicated a better response to AVA, which was not observed in the phase 2 trial for EPAG [Citation12,Citation28]. It is reasonable that long-term BM failure can exhaust the left hematopoiesis, thus making restoration more difficult. However, further experiments on a larger patient population are required. A recent study indicates that baseline blood counts can predict the response in SAA, whereby the greater the reticulocyte count, the higher the NEU, and the lower the levels of thrombopoietin, regardless of EPAG [Citation49]. However, the study focused on newly diagnosed SAA. In our study, among patients with NSAA, responders showed more severe CBCs than non-responders but the results were not significant (all p-values ≥ 0.30). Moreover, relapsed/intolerant patients may have a higher response rate from the continuation or restart of similar treatments than refractory cases. We also found that baseline creatine was lower in responders. TPO is mainly produced by the liver and kidney [Citation50]. AVA, as a TPO-RA, has a confirmed benefit for CLDs [Citation20,Citation29,Citation31], but not yet for patients with kidney dysfunction. Our study showed that the kidney might play a role in the pathway of AVA, which is worth further investigation.
72% of the patients were switched from EPAG as the salvage treatment before AVA administration. Surprisingly, no relationship between prior exposure dose and duration of EPAG and the ORR for AVA was found. 18/25 patients switched from EPAG and achieved 44% of ORR at 3 months, similar to previous results for the first salvage treatment with EPAG [Citation28]. In an in vitro experiment, AVA could combine with TPO, and improve megakaryocytopoiesis both in the early and late stages [Citation15]. It has a different binding site relative to EPAG, although both are non-competitive TPO-RAs [Citation14]. AVA exhibits higher laboratory efficacy than EPAG in vitro and in vivo [Citation51]. Previous reports show that AVA and romiplostim show higher response rates in ITP patients as compared to EPAG, and were clinically efficacious even after patients’ exposure to EPAG [Citation52]. H. Al-Samkari et al. report that patients resistant to EPAG can respond to romiplostim, both in ITP and AA [Citation52]. Similar findings for AVA and EPAG, as reported herein, further demonstrate the potential switch between TPO-RAs having different mechanisms. It is very unlikely that the response was from the late effects of EPAG since the length and cumulative dose of previous EPAG did not affect patients’ responses. However, the time to response and average dose for AVA was different between AA and those reported previously for ITP [Citation52], as evidenced by the dose differences in EPAG as well [Citation12,Citation53], which can probably be explained by the residual hematopoiesis and pathogenesis variation between the two diseases.
However, none of the patients were treated with ATG before, although we only excluded those using ATG within 6 months before enrollment. The high cost of ATG and the difficulty of hospital admission hinder its use in clinical practice in China [Citation5,Citation54]. Reportedly, only 9% of AA patients received standard IST as their primary treatment, whereas 77% used CsA alone or with an androgen [Citation5]. This was similar to the findings of this clinical trial. Combining ATG with CsA has been shown to be more effective than CsA alone [Citation7]. Such inaccessibility to ATG may overestimate the efficacy obtained in refractory, relapsed, and intolerant NSAA patients. However, this scenario is more clinically-practical in China and may underlie implications for further investigations on AVA effects in patients after standard IST.
AVA is usually well-tolerated, while occasional headache, fatigue, and epistaxis may be observed [Citation23]. We did not find any new side effects in our cohort, and most AEs were due to combined IST [Citation8]. In addition, mild liver dysfunction improved in some patients after AVA administration. This may be an advantage over other TPO-RAs, especially for patients with baseline liver damage or those treated in combination with hepatotoxic drugs [Citation55].
Some patients showed elevated Tbil but this was less than twice the upper limit of the normal range. Active hepatitis was excluded before enrollment. Responders and non-responders did not show significant differences in Tbil. Therefore, the impact of liver diseases on the efficacy of AVA was not found in this trial but could not be excluded. More studies are needed to investigate the association between liver function and the performance of AVA.
Most responders showed their responses at an average dose ≤40 mg. The good tolerability of AVA allowed 40 mg to be the starting daily dose of further phase 3 trials, in order to obtain a response in more patients or within a shorter time. However, most participants were previously treated with EPAG. This might be the reason why AVA was well-tolerated. Thus, in subsequent phase 3 trials, 40 mg was recommended to be the starting dose for EPAG-treated patients, whereas 20 mg was still recommended to establish tolerability.
This was a pilot study with a few limitations that warrant further investigations. A small number of patients, limited follow-up duration, and diversity of previous treatments may obscure the conclusion herein. Nonetheless, our findings provide a clue for alternative treatment using AVA for refractory/relapsed/intolerant AA, especially those with liver dysfunctions. Besides, it raises interest in the possibility of switching among different TPO-RAs, which requires further investigations.
Conclusion
In conclusion, 56% of NSAA patients achieved either CR or PR within 3 months after AVA administration. 44% of the patients with prior exposure to EPAG benefitted after switching to AVA. Therefore, AVA was effective and well-tolerated by NSAA patients who were refractory, relapsed, or intolerant to CsA/FK506 ± EPAG. Earlier treatment and relapsed/intolerant AA may show better short-term response rates.
Author contributions
Z.W. performed the patient enrollment, data collection, response evaluation, statistical analyses, and wrote the manuscript. M.C. participated in patient enrollment and revised the draft. B.H. designed this study and revised the draft. All authors approved the final submitted version.
Ethical approval
This prospective study was approved by the ethics committee of Peking Union Medical College Hospital (PUMCH, approval number: SKX-NSAA-001) and registered at clinicaltrial.gov (NCT04728789).
Consent form
All eligible patients were fully informed of the study design and signed written informed consents for their participation.
Supplemental Material
Download MS Excel (17 KB)Disclosure statement
No potential conflict of interest was reported by the author(s).
Data availability statement
Data are included in Supplementary files. The full study protocol can be obtained upon a reasonable request to the corresponding author.
Additional information
Funding
References
- Young NS. Aplastic anemia. N Engl J Med. 2018;379(17):1–13. doi: 10.1056/NEJMra1413485.
- Li SS, Hsu YT, Chang C, et al. Incidence and treatment outcome of aplastic anemia in Taiwan-real-world data from single-institute experience and a nationwide population-based database. Ann Hematol. 2019;98(1):29–39. doi: 10.1007/s00277-018-3486-3.
- Vaht K, Göransson M, Carlson K, et al. Incidence and outcome of acquired aplastic anemia: real-world data from patients diagnosed in Sweden from 2000–2011. Haematologica. 2017;102(10):1683–1690. doi: 10.3324/haematol.2017.169862.
- Norasetthada L, Wongkhantee S, Chaipokam J, et al. Adult aplastic anemia in Thailand: incidence and treatment outcome from a prospective nationwide population-based study. Ann Hematol. 2021;100(10):2443–2452. doi: 10.1007/s00277-021-04566-0.
- Zhang XT, Wang X, Cao J, et al. Treatment outcome of 301 aplastic anemia patients in China: a 10-year follow-up and real-world data from single institute experience. Hematology. 2021;26(1):1025–1030. doi: 10.1080/16078454.2021.2009646.
- Killick SB, Bown N, Cavenagh J, et al. Guidelines for the diagnosis and management of adult aplastic anaemia. Br J Haematol. 2016;172(2):187–207. doi: 10.1111/bjh.13853.
- Marsh J, Schrezenmeier H, Marin P, et al. Prospective randomized multicenter study comparing cyclosporin alone versus the combination of antithymocyte globulin and cyclosporin for treatment of patients with nonsevere aplastic anemia: a report from the European Blood and Marrow Transplant (EBMT) severe aplastic anaemia working party. Blood. 1999;93(7):2191–2195. doi: 10.1182/blood.V93.7.2191.
- Townsley DM, Scheinberg P, Winkler T, et al. Eltrombopag added to standard immunosuppression for aplastic anemia. N Engl J Med. 2017;376(16):1540–1550. doi: 10.1056/NEJMoa1613878.
- Ecsedi M, Lengline É, Knol-Bout C, et al. Use of eltrombopag in aplastic anemia in Europe. Ann Hematol. 2019;98(6):1341–1350. doi: 10.1007/s00277-019-03652-8.
- Scheinberg P. Activity of eltrombopag in severe aplastic anemia. Blood Adv. 2018;2(21):3054–3062. doi: 10.1182/bloodadvances.2018020248.
- Fattizzo B, Levati G, Cassin R, et al. Eltrombopag in immune thrombocytopenia, aplastic anemia, and myelodysplastic syndrome: from megakaryopoiesis to immunomodulation. Drugs. 2019;79(12):1305–1319. doi: 10.1007/s40265-019-01159-0.
- Fan X, Desmond R, Winkler T, et al. Eltrombopag for patients with moderate aplastic anemia or uni-lineage cytopenias. Blood Adv. 2020;4(8):1700–1710. doi: 10.1182/bloodadvances.2020001657.
- Shirley M. Avatrombopag: first global approval. Drugs. 2018;78(11):1163–1168. doi: 10.1007/s40265-018-0949-8.
- Kuter DJ. The structure, function, and clinical use of the thrombopoietin receptor agonist avatrombopag. Blood Reviews. 2022;53:100909. doi: 10.1016/j.blre.2021.100909.
- Fukushima-Shintani M, Suzuki K, Iwatsuki Y, et al. AKR-501 (YM477) in combination with thrombopoietin enhances human megakaryocytopoiesis. Exp Hematol. 2008;36(10):1337–1342. doi: 10.1016/j.exphem.2008.04.020.
- Kuter DJ. New thrombopoietic growth factors. Blood. 2007;109(11):4607–4616. doi: 10.1182/blood-2006-10-019315.
- Michelson AD, Smolensky Koganov E, Forde EE, et al. Avatrombopag increases platelet count but not platelet activation in patients with thrombocytopenia resulting from liver disease. J Thromb Haemost. 2018;16(12):2515–2519. doi: 10.1111/jth.14295.
- Wojciechowski P, Wilson K, Nazir J, et al. Efficacy and safety of avatrombopag in patients with chronic immune thrombocytopenia: a systematic literature review and network meta-analysis. Adv Ther. 2021;38(6):3113–3128. doi: 10.1007/s12325-021-01752-4.
- Virk ZM, Kuter DJ, Al-Samkari H. An evaluation of avatrombopag for the treatment of thrombocytopenia. Expert Opin Pharmacother. 2021;22(3):273–280. doi: 10.1080/14656566.2020.1841748.
- Cheloff AZ, Al-Samkari H. Avatrombopag for the treatment of immune thrombocytopenia and thrombocytopenia of chronic liver disease. J Blood Med. 2019;10:313–321. doi: 10.2147/JBM.S191790.
- Al-Samkari H, Kuter DJ. Optimal use of thrombopoietin receptor agonists in immune thrombocytopenia. Ther Adv Hematol. 2019;10:2040620719841735. doi: 10.1177/2040620719841735.
- Jurczak W, Chojnowski K, Mayer J, et al. Phase 3 randomised study of avatrombopag, a novel thrombopoietin receptor agonist for the treatment of chronic immune thrombocytopenia. Br J Haematol. 2018;183(3):479–490. doi: 10.1111/bjh.15573.
- Bussel JB, Kuter DJ, Aledort LM, et al. A randomized trial of avatrombopag, an investigational thrombopoietin-receptor agonist, in persistent and chronic immune thrombocytopenia. Blood. 2014;123(25):3887–3894. doi: 10.1182/blood-2013-07-514398.
- Długosz-Danecka M, Zdziarska J, Jurczak W. Avatrombopag for the treatment of immune thrombocytopenia. Expert Rev Clin Immunol. 2019;15(4):327–339. doi: 10.1080/1744666X.2019.1587294.
- Henter JI, Horne A, Aricó M, et al. HLH-2004: diagnostic and therapeutic guidelines for hemophagocytic lymphohistiocytosis. Pediatr Blood Cancer. 2007;48(2):124–131. doi: 10.1002/pbc.21039.
- Fardet L, Galicier L, Lambotte O, et al. Development and validation of the HScore, a score for the diagnosis of reactive hemophagocytic syndrome. Arthritis Rheumatol. 2014;66(9):2613–2620. doi: 10.1002/art.38690.
- Health UDo, Services H. Common terminology criteria for adverse events. Version 5.0. Published 2017 Nov 27. 2020.
- Olnes MJ, Scheinberg P, Calvo KR, et al. Eltrombopag and improved hematopoiesis in refractory aplastic anemia. N Engl J Med. 2012;367(1):11–19. doi: 10.1056/NEJMoa1200931.
- Xu H, Cai R. Avatrombopag for the treatment of thrombocytopenia in patients with chronic liver disease. Expert Rev Clin Pharmacol. 2019;12(9):859–865. doi: 10.1080/17512433.2019.1649137.
- Scharf RE. Thrombocytopenia and hemostatic changes in acute and chronic liver disease: pathophysiology, clinical and laboratory features, and management. JCM. 2021;10(7):1530. doi: 10.3390/jcm10071530.
- Terrault N, Chen YC, Izumi N, et al. Avatrombopag before procedures reduces need for platelet transfusion in patients with chronic liver disease and thrombocytopenia. Gastroenterology. 2018;155(3):705–718. doi: 10.1053/j.gastro.2018.05.025.
- Nilles KM, Flamm SL. Thrombocytopenia in chronic liver disease: new management strategies. Clin Liver Dis. 2020;24(3):437–451. doi: 10.1016/j.cld.2020.04.009.
- Gilreath J, Lo M, Bubalo J. Thrombopoietin receptor agonists (TPO-RAs): drug class considerations for pharmacists. Drugs. 2021;81(11):1285–1305. doi: 10.1007/s40265-021-01553-7.
- Ghanima W, Cooper N, Rodeghiero F, et al. Thrombopoietin receptor agonists: ten years later. Haematologica. 2019;104(6):1112–1123. doi: 10.3324/haematol.2018.212845.
- Khellaf M, Viallard JF, Hamidou M, et al. A retrospective pilot evaluation of switching thrombopoietic receptor-agonists in immune thrombocytopenia. Haematologica. 2013;98(6):881–887. doi: 10.3324/haematol.2012.074633.
- González-Porras JR, Godeau B, Carpenedo M. Switching thrombopoietin receptor agonist treatments in patients with primary immune thrombocytopenia. Ther Adv Hematol. 2019;10:2040620719837906. doi: 10.1177/2040620719837906.
- Kuter DJ, Tarantino MD, Lawrence T. Clinical overview and practical considerations for optimizing romiplostim therapy in patients with immune thrombocytopenia. Blood Reviews. 2021;49:100811. doi: 10.1016/j.blre.2021.100811.
- Birocchi S, Podda GM, Manzoni M, et al. Thrombopoietin receptor agonists for the treatment of primary immune thrombocytopenia: a meta-analysis and systematic review. Platelets. 2021;32(2):216–226. doi: 10.1080/09537104.2020.1745168.
- Al-Samkari H, Nagalla S. Efficacy and safety evaluation of avatrombopag in immune thrombocytopenia: analyses of a phase III study and long-term extension. Platelets. 2022;33(2):257–264. doi: 10.1080/09537104.2021.1881952.
- Agarwal N, Mangla A. Thrombopoietin receptor agonist for treatment of immune thrombocytopenia in pregnancy: a narrative review. Ther Adv Hematol. 2021;12:20406207211001139. doi: 10.1177/20406207211001139.
- Fukushima-Shintani M, Suzuki K, Iwatsuki Y, et al. AKR-501 (YM477) a novel orally-active thrombopoietin receptor agonist. Eur J Haematol. 2009;82(4):247–254. doi: 10.1111/j.1600-0609.2008.01198.x.
- Markham A. Avatrombopag: a review in thrombocytopenia. Drugs. 2021;81(16):1905–1913. doi: 10.1007/s40265-021-01613-y.
- Syed YY. Hetrombopag: first approval. Drugs. 2021;81(13):1581–1585. doi: 10.1007/s40265-021-01575-1.
- Young DJ, Fan X, Groarke EM, et al. Long-term eltrombopag for bone marrow failure depletes iron. American J Hematol. 2022;97(6):791–801. doi: 10.1002/ajh.26543.
- Yang Y, Yang WR, Wu ZJ, et al. Delayed hematologic response to immunosuppressive therapy in severe aplastic anemia. Zhonghua Xue Ye Xue Za Zhi. 2016;37(12):1038–1043.
- Patel BA, Groarke EM, Lotter J, et al. Long-term outcomes in patients with severe aplastic anemia treated with immunosuppression and eltrombopag: a phase 2 study. Blood. 2022;139(1):34–43. doi: 10.1182/blood.2021012130.
- Frickhofen N, Kaltwasser JP, Schrezenmeier H, et al. Treatment of aplastic anemia with antilymphocyte globulin and methylprednisolone with or without cyclosporine. The german aplastic anemia study group. N Engl J Med. 1991;324(19):1297–1304. doi: 10.1056/NEJM199105093241901.
- Lee SE, Yahng SA, Cho BS, et al. Improvement in hematopoiesis after iron chelation therapy with deferasirox in patients with aplastic anemia. Acta Haematol. 2013;129(2):72–77. doi: 10.1159/000342772.
- Zaimoku Y, Patel BA, Shalhoub R, et al. Predicting response of severe aplastic anemia to immunosuppression combined with eltrombopag. haematol. 2021;107(1):126–133. doi: 10.3324/haematol.2021.278413.
- Hitchcock IS, Kaushansky K. Thrombopoietin from beginning to end. Br J Haematol. 2014;165(2):259–268. doi: 10.1111/bjh.12772.
- Abe M, Suzuki K, Sakata C, et al. Pharmacological profile of AS1670542, a novel orally-active human thrombopoietin receptor agonist. Eur J Pharmacol. 2011;650(1):58–63. doi: 10.1016/j.ejphar.2010.09.072.
- EHA 2021. Virtual congress abstract book. HemaSphere. 2021;5(S2):548.
- Bussel JB, Cheng G, Saleh MN, et al. Eltrombopag for the treatment of chronic idiopathic thrombocytopenic purpura. N Engl J Med. 2007;357(22):2237–2247. doi: 10.1056/NEJMoa073275.
- Mishra K, Jandial A, Lad D, et al. Cost and complications are limitations in resource-constrained settings for equine anti-thymocyte globulin. Eur J Haematol. 2018;101(3):421. doi: 10.1111/ejh.13125.
- Saab S, Brown RS.Jr. Management of thrombocytopenia in patients with chronic liver disease. Dig Dis Sci. 2019;64(10):2757–2768. doi: 10.1007/s10620-019-05615-5.