
Abstract
Background
Pancreatic ductal adenocarcinoma (PDAC) is one of the most lethal malignant solid tumours, and abnormal metabolic reprogramming in the tumour microenvironment is regarded as an important contributor to its pathogenesis.
Objectives
As there is an urgency to identify new targets based on the metabolic features that are highly refractory to PDAC treatment, this study aimed to identify suitable therapeutic targets for PDAC.
Methods
In this study, gene set enrichment and Kyoto Encyclopedia of Genes and Genomes analyses were performed on 163 PDAC tissue samples and 165 normal pancreatic tissue samples from The Cancer Genome Atlas and Genotype-Tissue Expression databases to identify alterations in critical metabolites that may contribute to PDAC pathogenesis. Furthermore, ultra-performance liquid chromatography–tandem mass spectrometry was performed to identify significant metabolic pathways between 24 pairs of tumour and adjacent non-tumour tissues and between serum samples from PDAC patients and healthy donors.
Results
Fifty-one tissue metabolites and 26 serum metabolites were altered in PDAC. Among them, those in the γ-glutamyl cycle were the most substantially changed, and 5-oxoproline was the biomarker of PDAC with the most significantly decreased levels.
Conclusions
The γ-glutamyl cycle and 5-oxoproline might be potential biomarkers and therapeutic targets to improve the diagnosis, therapy, and prognosis of PDAC.
Introduction
Pancreatic ductal adenocarcinoma (PDAC), the predominant pathological subtype comprising 90% of pancreatic adenocarcinoma [Citation1], is predicted to become the second leading cause of death in cancer patients by 2030 [Citation2]. Early diagnosis and therapy of PDAC would help decrease mortality. However, because of the lack of suitable biomarkers [Citation3], PDAC is usually diagnosed at a late stage. Despite clinical efforts such as chemotherapy, radiotherapy, and targeted therapy, the prognosis of PDAC remains extremely poor, with a dismal 5-year survival rate. Thus, there is an urgent need to identify specific biomarkers for the early diagnosis and novel targets for the therapy of PDAC [Citation4–6].
In this context, abnormalities, in the metabolic circuitry have been increasingly recognized as a hallmark of cancer and an emerging source of potential drug targets [Citation7,Citation8]. To adapt to severe metabolic constraints in the tumour microenvironment (TME), PDAC cells rely largely on metabolic reprogramming to meet energy and biomass synthesis demands [Citation9]. Accumulating evidence indicates that the abnormal reprogramming of metabolism contributes to PDAC development and progression. Glycolysis facilitates tumour progression, immune escape, and chemoresistance. The expression of glycolytic genes is correlated with the prognosis of PDAC [Citation10]. Additionally, lipid metabolism differs in PDAC, thus providing potential diagnostic markers [Citation11]. Upregulation of the expression of cholesterol pathway genes and the accelerated uptake and endogenous biosynthesis of cholesterol are features of PDAC [Citation12]. For example, branched-chain amino acid (BCAA) metabolism plays an important role in PDAC by regulating lipogenesis [Citation13]. Many studies have specifically focused on derangements in glutamine (Gln) metabolism, because Gln is a critical metabolite in PDAC. Gln contributes the most to TCA cycle metabolites relative to other nutrients in PDAC. Gln deficiency can induce epithelial–mesenchymal transition and promote PDAC cells’ migration and invasion [Citation14,Citation15]. PDAC relies on the Gln-derived pathway to increase the NADPH/NADP+ ratio, which maintains cellular redox homeostasis [Citation16]. Therefore, metabolic reprogramming plays an important role in the pathogenesis of PDAC. Exploration of the molecular mechanisms underlying metabolic reprogramming in PDAC may reveal potential hallmarks and novel strategies for effective therapy [Citation8,Citation17]. However, sensitive and powerful biomarkers of PDAC remain undiscovered. Thus, we aimed to identify the important metabolic pathways and potential biomarkers of PDAC.
In this study, we identified four key metabolic pathways via integrated transcriptomic and metabolomic interactome analyses of gene expression profiles from The Cancer Genome Atlas (TCGA) and The Genotype-Tissue Expression (GTEx) datasets on PDAC. We also performed a metabolomic analysis using high-resolution LC − MS/MS of paired tumour and para-carcinoma tissues of PDAC patients and serum samples from PDAC patients and healthy donors. Our results demonstrated, for the first time, that γ-glutamyl cycle was closely related to the development and progression of PDAC, and 5-oxoproline (5-OP) could become a diagnosis biomarker. These findings will help us better understand the roles of potential biomarkers in PDAC diagnosis and therapy, also highlighting the potential effects of metabolic remodelling on the TME of PDAC.
Materials and methods
Collection and processing of pancreatic cancer gene data
Differential gene analysis from public gene expression datasets
The gene expression profiles of PDAC patients from TCGA and healthy donors from GTEx were downloaded from the UCSC database (https://xenabrowser.net/). In total, 163 PDAC tissue samples from TCGA and 165 normal pancreatic tissue samples from the GTEx dataset were used in this study. Transcriptome data were log2 transformed and standardized across patients using a quantile-normalized method. All corresponding characteristics of the enrolled patients and their clinical outcomes were publicly available. The demographic and clinical information of the enrolled patients from TCGA database is presented in Table S1.
Pathway enrichment analysis
Pathway enrichment analysis, including Kyoto Encyclopedia of Genes and Genomes (KEGG) analysis and gene set enrichment analysis (GSEA), was conducted to explore the potential molecular mechanisms of PDAC using the R (version 3.9.0) software clusterProfiler package [Citation18] and ggplot2 package [Citation19].
Metabolomics assays
Patient selection and sample collection
Patients with PDAC were recruited at Peking University Cancer Hospital (Beijing, China) from 1 January 2018, to 31 December 2018. The diagnosis was confirmed by histopathological examination. None of the patients had received any special treatment or had any immune system disease. Healthy donors had no history of malignancies within the last five years and had received no solid organ or bone marrow transplants. Tissue samples collected during surgery were immediately frozen at −80 °C until the experiment. Blood samples were collected from the same 24 PDAC patients in non-anticoagulant vasculature and from 24 healthy donors in blood collection tubes. The blood samples were immediately centrifuged at 300 g for 5 min at 4 °C, and the supernatant was stored at −80 °C immediately. Twenty-four PDAC tumour tissue samples (T), adjacent tissue samples (N), PDAC serum samples (ST), and healthy donor serum samples (SN) were analyzed. The overall survival was calculated based on the post-operative follow-up time. This study was approved by the Institutional Review Board of Peking University Cancer Hospital (protocol no. 2016KT41) and conducted in accordance with the Declaration of Helsinki (1964). The demographic and clinical information of the patients is summarized in .
Table 1. Clinicopathological characteristics of the PDAC patients.
Preparation of frozen tissue samples
A two-step extraction protocol was used to extract polar and nonpolar components from PDAC tumours and adjacent normal pancreatic tissues. First, 50 mg of each sample was homogenized in 1.5 mL of ultrapure water (containing 50% methanol) on ice. After centrifugation at 13,000 g for 15 min at 4 °C, the pellet was collected, re-suspended in 1.5 mL of a dichloromethane-methanol solution (3:1, v/v), and vortexed for 2 min. The two-step extracted supernatant was mixed, dried in a vacuum concentrator, and dissolved in 100 μL of methanol containing 13 isotope-labeled internal standards to prepare an injection solution. The internal standards were selected according to previous studies [Citation20]. Quality control (QC) samples (n = 8) were prepared by mixing 10 μL of each tissue sample.
Preparation of frozen serum samples
The serum samples were thawed on ice, and 400 μL of pre-cooled methanol was added to each. The mixture was vortexed for 2 min and then placed on ice for 1 h. The mixture was then centrifuged at 13,000 g for 15 min at 4 °C. Thereafter, the supernatant was collected, dried in a vacuum concentrator, and dissolved in 100 μL of methanol containing 13 isotope-labeled internal standards to prepare for injection [Citation21]. QC samples (n = 5) were prepared by mixing 10 μL of each serum sample.
Ultra-high-pressure liquid chromatography–mass spectrometry (UPLC-MS)
To obtain the metabolic profiles of tissue and serum samples from patients with PDAC or healthy donors, UPLC-MS/MS-based metabolomics was performed. The UPLC conditions were set as described previously [Citation20]. The UPLC-MS/MS platform utilized a Thermo Scientific Dionex Ultimate 3,000 UHPLC system and a Thermo Scientific Q Exactive MS. The detector was equipped with an electrospray ionization (ESI) source and operated in both positive and negative (ESI+ and ESI-) resolution modes. UPLC-MS acquired full MS data for quantification, and UPLC- MS/dd-MS2 (i.e. data-dependent scan mode) obtained product ion spectra for identification. In these two resolution modes, ion source temperature was set to 320 °C, and spray voltage was adjusted at 3.5 and 2.8 kV, respectively. The flow rates of the sheath gas passage were 35 and 40 arb, and the auxiliary airflow rates were 5 and 10 arb, respectively. The scan modes included full MS (resolution of 70,000) and full MS/dd-MS2 (resolution of 17,500) in the range of 60–900 m/z.
The UPLC conditions were in accordance with those described in a previous study [Citation21]. Waters ACQUITY UPLC® BEH C8 (2.1 mm × 100 mm, 1.7 μm) and ACQUITY UPLC® HSS T3 (2.1 mm × 100 mm, 1.8 μm) were used as the stationary phase. The mobile phase comprised solvents A (0.1% formic acid in water), B (0.1% formic acid in acetonitrile), C (5 mM ammonium acetate in water), and D (5 mM ammonium acetate − 90% methanol in water). The column temperature was 50 °C, the flow rate was 0.35 mL/min, and the injection volume was 5 μL. C8 and T3 columns were used to analyze serum and tissue samples. For the C8 column (positive-ion mode), mobile phases A and B were used. The gradient program was optimized as follows: 0–1 min, equilibration with 5% B; 1–24 min, 5% B to 100% B; 24–28 min, equilibration with 100% B; 28–28.1 min, 100% B to 5% B; and 28.1–30 min, equilibration with 5% B. For the T3 column (negative ion mode), mobile phases included C and D. The gradient program was optimized as follows: 0–1 min, equilibration with 2% D; 1–18 min, 2% D to 100% D; 18–22 min, equilibration with 100% D; 22–22.1 min, 100% D to 5% D; and 22.1–25 min, equilibration with 5% D.
Compound identification and metabolic pathways
A metabolomic small-molecule compound rapid identification and analysis by OSI-SMMS software (Dalian Institute of Chemical Physics, Chinese Academy of Sciences and Dalian ChemData Solution Information Technology Co., Ltd, PR China) was used to obtain primary and secondary mass spectral data from the raw mass spectral data. An isotope-labeled internal standard was used to correct the peak alignment and normalization. The MS2 (M/Z and ionic strength) was used for the qualitative analysis of the compounds by comparison with a standard database [Citation20]. Orthogonal partial least squares discriminant analysis (OPLS-DA) was performed to compare T vs. N and ST vs. SN. Potential outliers were assessed using SIMCA-14.0 software [Citation22]. R2, Q2, and permutation tests were used to validate the different models. Variable importance in projection (VIP) was used to characterize the potential contributions of various metabolites to the models. Metabolites with a VIP > 1 and p < .05 were considered to be important.
Pathway and process enrichment analysis of difference metabolites
Finally, the differential compounds were imported from T, N, ST, and SN to the MetaboAnalyst website (https://www.metaboanalyst.ca) for metabolic pathway analyses.
Statistical analysis
Values were expressed as mean ± SD. Comparisons between two groups were performed using t-tests. A p < .05 indicated a statistically significant difference. All statistical analyses were performed using GraphPad Software.
Results
Relationships between metabolic phenotype and PDAC
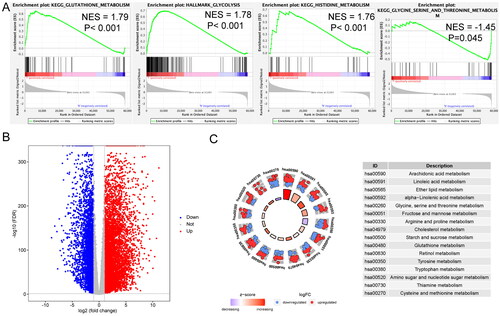
To examine the distinct features of biological processes in PDAC, gene expression profiles were compared between 163 PDAC and 165 normal pancreatic samples from TCGA and GTEx, respectively, using GSEA. Based on GSEA, PDAC showed strong correlation with the positive regulation of several metabolic pathways, including the glutathione metabolism pathway (NES = 1.79, p < .001), glycolysis pathway (NES = 1.78, p < .001), histidine metabolism pathway (NES = 1.76, p < .001), and glycine, serine, and threonine metabolism pathway (NES = −1.45, p < .001) (). Differentially expressed genes (DEGs) between PDAC and normal pancreas are shown in . The metabolism-related pathways associated with these significant genes were identified using KEGG enrichment analysis. These genes were involved in the metabolism of arachidonic acid, linoleic acid, ether lipid, alpha-linolenic acid, glycine, serine, threonine, fructose, mannose, arginine, proline, cholesterol, starch, sucrose, glutathione, retinol, tyrosine, tryptophan, amino sugars, nucleotide sugars, thiamine, cysteine, and methionine ().
Figure 1. Metabolic difference between pancreatic ductal adenocarcinoma (PDAC) and normal pancreas samples. (A) Significant enrichment of metabolic pathways in PDAC samples compared with that in normal pancreas samples. NES: normalized enrichment score. (B) Volcano plot of genes differentially expressed in PDAC vs. normal pancreas samples. (C) Functional analysis of genes for metabolic pathways.
UPLC-MS/MS analysis and metabolic profiling of tissue and serum samples
To validate a potential relationship of metabolic phenotype with PDAC, untargeted metabolomic analysis using high-resolution LC − MS/MS was conducted. With two columns, C8 and T3, approximately 5705 molecular features were generated from representative total ion chromatograms (TICs) of all tissue samples, whereas 6232 were generated from serum samples, based on exact high-resolution mass values (Figure S2, supplementary material). Following alignment and normalization, mass-based differential analysis was performed to determine the relationships among different groups.
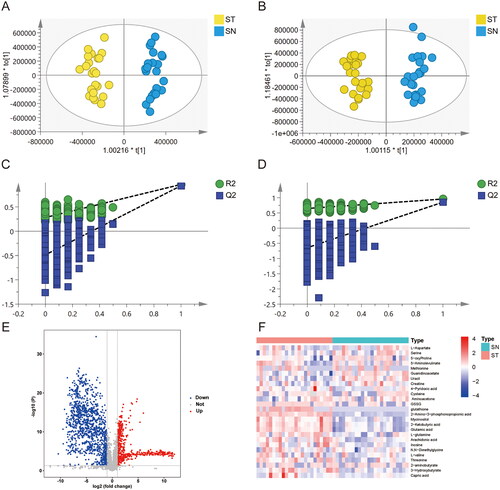
To determine metabolic changes and characterize the metabolite profiles of T vs. N and ST vs. SN, OPLS-DA models were used. The R2X(cum) and R2Y(cum) values in the four models were larger than 0.7 and 0.95, respectively (). The Q2(cum) values for predictive ability were larger than 0.95 (). Clusters of the T samples were clearly separated from those of N samples. Similarly, the clusters of the ST samples were clearly separated from those of the SN samples. To avoid the contingency of the classification obtained from the supervised learning method, the models were subjected to permutation tests. The intercept values of the R2 and Q2 regression lines and the y-axis were used to measure overfitting. Q2 was −0.52 () and −0.536 () in the positive and negative ion modes, respectively. In the serum samples, Q2 was −0.468 and −0.465 in the positive and negative ion modes, respectively (). Thus, neither the tissue nor serum sample models were overfitted. Fifty-one differential metabolites in tissue samples and 26 differential metabolites in serum samples were identified by a fold change > 2 or <0.5, VIP > 1, and p < .05, respectively ().
Figure 2. Metabolic biomarker analysis in pancreatic cancer tissue (T) and adjacent non-tumour tissue (N). (A, B) Orthogonal PartialLeast Squares-DiscriminantAnalysis (OPLS-DA) analysis between the T and N group in positive ionization modes (ESI+) and negative ionization modes (ESI-) i. (C, D) Permutations plot analysis. The intersection of the Q2 regression line and the y-axis is less than 0, indicating that the model is valid. (E) Volcano plot of metabolites between the T and N groups; (F) Heatmap of 51 differential metabolites (VIP > 1 and p < .05).
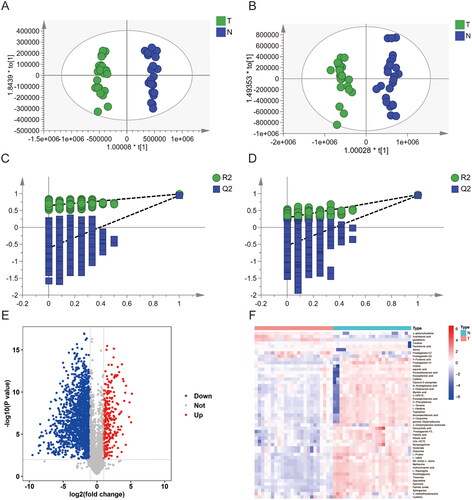
Figure 3. Metabolic biomarker analysis in pancreatic cancer serum (ST) and healthy donor serum (SN). (A, B) OPLS-DA analysis between the ST and SN group in positive (ESI+) and negative (ESI-) ionization modes. (C, D) Permutation plot analysis. The intersection of the Q2 regression line and the y-axis is less than 0, indicating that the model is valid. (E) Volcano plot of metabolites between T and N group; (F) Heatmap of 26 differential metabolites (VIP > 1 and p < .05).
Metabolic pathway analysis of tissue samples
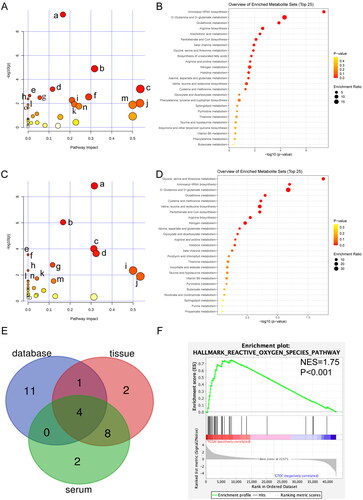
As shown in , the expressions of six metabolites, such as creatine and glutathione, were significantly upregulated in the T group compared with those in the N group, whereas the expressions of 45 metabolites, such as aspartic acid and serine, were downregulated in the T group compared with those in the N group. Fifteen metabolic pathways were changed in PDAC tissues, including aminoacyl-tRNA biosynthesis, glutathione metabolism, arginine biosynthesis, arachidonic acid metabolism, pantothenate and CoA biosynthesis, glycine, serine, and threonine metabolism, beta-alanine metabolism, biosynthesis of unsaturated fatty acids, arginine and proline metabolism, alanine, aspartate and glutamate metabolism, nitrogen metabolism, D-glutamine, and D-glutamate metabolism, histidine metabolism, cysteine, and methionine metabolism, as well as valine, leucine, and isoleucine biosynthesis (p < .05, ). The enriched pathways are shown in . Among these altered metabolic pathways, glutathione metabolism was the second significant between the T and N samples.
Figure 4. Metabolomic pathway analysis in tissue and serum of patients with PDAC. (A) Pathway analysis of 51 significant differential metabolites from T vs N. (a) Aminoacyl-tRNA biosynthesis (p < .001). (b) Glutathione metabolism (p < .001). (c) Arachidonic acid metabolism (p < .001). (d) Arginine biosynthesis (p < .001). (e) Pantothenate and CoA biosynthesis (p = .002). (f) Glycine, serine, and threonine metabolism (p = .003); (g) beta-alanine metabolism (p = .003). (h) Biosynthesis of unsaturated fatty acids (p = .004). (i) Arginine and proline metabolism (p = .005). (j) Alanine, aspartate, and glutamate metabolism (p = .010). k. Histidine metabolism (p = .012). (l) Nitrogen metabolism (p = .013). (m) D-Glutamine and D-glutamate metabolism (p = .013). (n) Cysteine and methionine metabolism (p = .017). (o) Valine, leucine, and isoleucine biosynthesis (p = .023). (B) Enrichment analysis of 51 significant differential metabolites from T vs N. (C) Pathway analysis of 26 significant differential metabolites from ST vs SN. (a) Glycine, serine, and threonine metabolism (p < .001). (b) Aminoacyl-tRNA biosynthesis (p < .001). (c) Glutathione metabolism (p < .001). (d) Cysteine and methionine metabolism (p < .001). (e) Pantothenate and CoA biosynthesis (p < .001). (f) Valine, leucine, and isoleucine biosynthesis (p < .001). (g) Arginine biosynthesis (p = .002). (h) Nitrogen metabolism (p = .005). (i) D-glutamine and D-glutamate metabolism (p = .005). (j) Alanine, aspartate, and glutamate metabolism (p = .013). (k) Glyoxylate and dicarboxylate metabolism (p = .018). (l) Butanoate metabolism (p = .029). (m) Arginine and proline metabolism (p = .029). (n) Histidine metabolism (p = .032). (D) Enrichment analysis of 26 significant differential metabolites from ST vs SN. (E) Venn diagram analysis of significant metabolic related pathway from tissue, serum, and database. (F) GSEA of ROS between PDAC samples and normal pancreas.
Metabolic pathway analysis of serum samples
As shown in , in the ST group, the expressions of 16 metabolites, including glutathione, L-Glutathione Oxidized (GSSG), and glutamic acid, were significantly upregulated compared with those in the SN group, whereas the expressions of 10 metabolites, including methionine and cysteine, were downregulated. Fourteen metabolic pathways changed in PDAC serum samples included glycine, serine and threonine metabolism, aminoacyl-tRNA biosynthesis, cysteine and methionine metabolism, valine, leucine, and isoleucine biosynthesis, pantothenate and CoA biosynthesis, arginine biosynthesis, nitrogen metabolism, D-glutamine, and D-glutamate metabolism, arginine and proline metabolism, glutathione metabolism, alanine, aspartate, and glutamate metabolism, glyoxylate and dicarboxylate metabolism, butanoate metabolism, and histidine metabolism (p < .05, ). The enriched pathways are shown in . Notably, glycine-serine-threonine metabolism was the most significantly different pathway between the ST and SN groups.
Integrated interactome analysis using multiple platforms
To comprehensively assess the metabolic differences in KEGG, the significantly different metabolic pathways in TCGA vs. GTEx, T vs. N, and ST vs. SN were intersected using Venn. As shown in , four metabolic pathways were altered in all three comparisons: glutathione, cysteine-methionine, arginine-proline, and glycine-serine-threonine. Interestingly, glutathione metabolism, cysteine-methionine metabolism, and glycine-serine-threonine metabolism belongs to the γ-glutamyl cycle. In addition, based on GSEA, reactive oxygen species (ROS) levels were significantly higher in PDAC samples than in normal pancreas samples ().
Clinical relevance of key metabolites
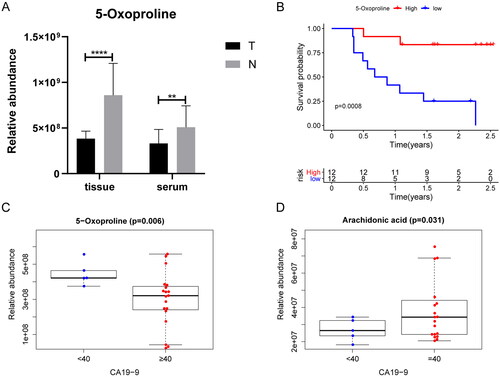
The peak area of the TICs was used to represent the relative abundance of the metabolites. To evaluate the relationship between prognosis or clinical features and key metabolites in the four metabolomic pathways, a Kaplan–Meier analysis was performed using the survival package in R, whereas clinical features were analyzed using the beeswarm package in R. Patients with PDAC were stratified by the median expression values of key metabolites. In PDAC tissue samples, the relative concentration of 5-OP was negatively associated with overall survival (OS) () and carbohydrate antigen 19-9 (CA19-9) levels (). Stratified analysis showed that groups with higher relative abundance of 5-OP exhibit longer OS in both of patients with low stage (I-II) (p = .04*) and high stage (III-IV) (p = .007**). In addition, relative arachidonic acid concentration was higher in patients with higher CA19-9 levels (). Prognosis-related metabolites are listed in Table S2 (supplementary material). The associations between the clinical features and metabolites are described in Table S3.
Figure 5. Associations of metabolites with overall survival and clinical features in patients of PDAC (A) the relative concentration of 5-oxoproline (5-OP) was increased in T and ST vs N and SN; (B) Overall survival analysis of the relative concentration of 5-OP in T group by Kaplan–Meier plot. Log-rank test was used to evaluate significance; (C) The relative concentration of 5-OP in the ST group is higher along with higher CA19-9 levels. (D) The relative content of arachidonic acid in ST group is higher along with higher CA19-9 levels (*p < .05, **p < .01, ***p < .001, ****p < .0001).
Discussion
Pancreatic ductal adenocarcinoma has a poor prognosis owing to its rapid progression and difficult diagnosis. Diagnosis biomarkers help detect PDAC earlier, which is important for patients [Citation4]. Metabolic reprogramming is a hallmark of cancer [Citation23]. Under physical, oxidative, and inflammatory stresses, metabolic reprogramming may play a pivotal role in PDAC development and progression [Citation9]. Therefore, a better understanding of metabolic dysregulation may help discover potential diagnostic biomarkers and therapeutic targets for PDAC [Citation24]. In this study, we analyzed the PDAC metabolome by integrating transcriptomic and metabolomic analyses. Importantly, the γ-glutamyl cycle was the most significant pathway involved in the metabolic reprogramming of PDAC, whereas 5-OP was the most prominent protective factor for prognosis.
GSEA identified significant differences in metabolic reprogramming that may distinguish PDAC from normal pancreatic tissues. In particular, glycolysis and glutathione, histidine-glycine, and serine-threonine metabolism changed substantially. Both glutathione and serine-threonine metabolism belong to γ-glutamyl cycle. Reprogramming of glucose metabolism provides tumour cells with building blocks for proliferation such that glycolysis may become a biochemical fingerprint of cancer [Citation25]. Histidine, an essential amino acid, promotes malignant transformation by activating the mammalian target of rapamycin (mTOR) [Citation26]. Cancer cell metabolism plays an important role in PDAC tumorigenesis and metastasis [Citation9,Citation27,Citation28]. Metabolic pathways involving BCAA, glutamine, glucose, cholesterol, and lipids are critical for the rapid division of cancer cells and provide potential therapeutic targets for PDAC [Citation11–13,Citation29].
Significantly altered pathways and metabolites have been identified in PDAC tissues and serum samples. The metabolism of pyrimidines, glucose, and fatty acids contributes to PDAC pathogenesis [Citation28,Citation30,Citation31], as identified by GSEA and PDAC tissue samples. However, a single metabolomics study of tissue, plasma, or serum samples may not accurately reflect metabolic reprogramming in patients with PDAC. In this study, metabolomic data from tumour tissues and serum samples were integrated with transcriptomic data to reveal metabolic reprogramming in patients with PDAC.
Metabolomics simultaneously qualitatively and quantitatively analyzes the low-molecular-weight metabolites of an organism or cell at specific time points. Metabolomics can help us to better understand metabolic reprogramming in patients with PDAC. In this study, we identified 51 metabolites in 24 pairs of PDAC tissue samples and 26 metabolites in 24 pairs of serum samples using UPLC-MS/MS. In total, 7186 DEGs were identified in PDAC samples using public databases. Subsequently, KEGG pathway analysis was performed on the PDAC tissue and serum samples. Thus, four key metabolic pathways for patients with PDAC were identified: glutathione, arginine-proline, glycine-serine-threonine, and cysteine-methionine metabolism. All these pathways belong to the γ-glutamyl cycle. Pantothenate and CoA biosynthesis, D-glutamine and D-glutamate metabolism, and alanine, aspartate, and glutamate metabolism also belong to the γ-glutamyl cycle. Valine-leucine-isoleucine biosynthesis relies on glycine-serine-threonine metabolism. As for nitrogen metabolism, Gln is the most important source of nitrogen [Citation32]. In addition, ROS was increased in PDAC tumour tissues more than in normal pancreas, indicating substantial changes in the γ-glutamyl cycle in PDAC. The changes in the related genes and metabolites are depicted in and Figure S2 (supplementary material).
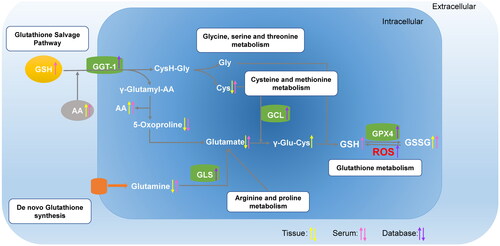
Figure 6. Graphical representation of γ-glutamyl cycle. The compounds with differential expressions in the T group compared to those in the N group are depicted as yellow arrows. The compounds with differential expressions in the ST group compared to those in the SN group are depicted as pink arrows. The differentially expressed genes in the PDAC group compared to those in the normal pancreas group are depicted as purple arrows. Upward arrows represent that the metabolite concentrations, enzyme activities, and gene expressions are upregulated, whereas downward arrows indicate that the metabolite concentrations, enzyme activities, and gene expressions are downregulated.
Although combination cytotoxic chemotherapies, such as leucovorin, fluorouracil, irinotecan, oxaliplatin (FOLFIRINOX), and gemcitabine with nab-paclitaxel, have improved clinical outcomes in PDAC moderately, the 5-year OS rate remains less than 10%, and the median survival time is typically less than 1 year [Citation33–35]. Currently, the identification of new therapeutic targets is crucial for the development of efficient PDAC therapies. Notably, the γ-glutamyl cycle has been used as a target for treatment of esophageal cancer [Citation36]. The γ-glutamyl cycle, the primary pathway for glutathione synthesis and degradation, maintains intracellular γ-glutamyl-cysteinyl-glycine levels and intercellular redox balance [Citation37,Citation38]. Activation of the γ-glutamyl cycle may increase cellular sensitivity to oxidative stress, mitochondrial damage, and reprogramming of glutamine and glucose metabolism. In esophageal cancer, γ-glutamyl cycle has been considered to be a therapeutic target [Citation36]. In PDAC, cysteine can act as a target of tumour ferroptosis, and glutamine may support tumour growth via Kirsten rat sarcoma (KRAS) -regulated metabolic pathways [Citation16,Citation39]. Thus, the γ-glutamyl cycle might be a therapeutic target in PDAC. All metabolites in the γ-glutamyl cycle were evaluated for their associations with clinical features. Importantly, only 5-OP showed lower expression in PDAC tumour and serum samples. Meanwhile, 5-OP levels were lower in the tissue samples from PDAC patients with poor survival. Thus, 5-OP may serve as a protective agent against PDAC. The prognosis of patients may be predicted by measuring 5-OP concentrations in plasma or tissue samples. 5-OP is highly expressed in PDAC patients with low CA19-9 expression. 5-OP, also known as pyroglutamic acid, is an intermediate of the γ-glutamyl cycle of glutathione synthesis and degradation and belongs to glutathione metabolism. Recent studies identified 5-OP as a candidate biomarker for breast cancer [Citation40] and for distinguishing between mucinous and non-mucinous pancreatic cysts [Citation41]. Our findings may reflect interrelated components of the γ-glutamyl cycle [Citation42]. The reduction in glutathione secondarily leads to increased production of 5-OP. Metabolic regulators have been used in preclinical studies and clinical trials [Citation9,Citation43,Citation44]. Therefore, if the γ-glutamyl cycle serves as a target for clinical therapy, 5-OP could be used as a biomarker to estimate therapeutic efficacy.
Differentially expressed metabolites have been identified as factors that promote PDAC pathogenesis. For example, arachidonic acid (AA), a member of ω-6 family, is enriched in exosomes released by AsPC-1 cells, which exerted a pro-tumorigenic phenotype and impacted macrophage function [Citation45]. Consistently, in our study, AA levels were higher in the serum of patients with PDAC and higher in patients with high CA19-9 levels, suggesting that AA might participate in PDAC tumorigenesis. M2 macrophages express high levels of membrane-associated prostaglandin E synthase-1 and 5-lipoxygenase, which promotes tumour progression [Citation46]. In our study, the relative concentration of AA was higher in the tissue and serum samples of PDAC patients, and AA was higher in patients with higher CA19-9 (≥40 U/mL). CA19-9 may cause rapid and severe pancreatitis and cooperate with the KrasG12D oncogene to cause aggressive PDAC [Citation47]. While adding AA directly to PDAC cells may decrease vitality and increase ROS in PDAC cells [Citation48], other studies have shown that AA may promote tumour growth [Citation49,Citation50].
Our study has several limitations. First, the sample size is relatively small. All participants were enrolled from a single center, and no external testing cohort was established. Second, PDAC is composed of two major transcriptomic subtypes, classical (pancreatic) and squamous [Citation51], whose metabolic characteristics should be explored in the future. Thirdly, the exact mechanism underlying the involvement of 5-OP in PDAC remains unclear. Last but not least, Quantitative measurement of the content of 5-OP and establishment of judgement criteria may provide more support for the diagnosis and prognosis prediction of pancreatic cancer in the future. Thus, further analyses with a larger sample size from multiple centers are required to validate our results. A mechanistic study of several metabolites involved in the pathophysiology of PDAC will be the focus of our future studies.
In conclusion, we have identified the γ-glutamyl cycle as a potential novel therapeutic target and 5-OP as a diagnosis biomarker for PDAC because of their close relationship with tumour development and progression, as demonstrated by integrated transcriptomic and metabolomic interactome analyses. This approach moves beyond single-gene investigation or metabolomic analysis to provide a systematic perspective on the potential relationships among members of a biological network in PDAC. Further studies are needed to elucidate the complex mechanisms underlying the dynamic alteration of the γ-glutamyl cycle and to explore potential clinical applications in PDAC. Novel targets, such as aberrant metabolism and nutrient utilization, may become diagnostic biomarkers and additional therapeutic options for PDAC patients in the near future.
Author contributions
W.W.J and T.X.Y designed the study, performed experiments, analyzed data, and wrote the manuscript. G.X.Y, W.J.H, L.D.N, D.B, Y.L, and Z.M performed experiments and analyzed data. W.W.J, T.X.Y and H.C.Y conceived and designed the study and wrote the manuscript.
Ethical approval and consent to participate
The research was conducted in accordance with the Declaration of Helsinki (1964) and approved by the Institutional Review Board (IRB) of Peking University Cancer Hospital (approval no. 2016KT41) and in accordance with the principles of the Declaration of Helsinki.
Consent for publication
All authors agree publication this article on Annals of medicine.
Supplemental Material
Download MS Word (533.3 KB)Acknowledgements
We are grateful to all the participants who have made this research possible.
Disclosure statement
No potential conflict of interest was reported by the author(s).
Availability of supporting data
The datasets generated during and/or analyzed during the current study are available from the corresponding author on reasonable request.
Additional information
Funding
References
- Li YJ, Wu JY, Wang JM, et al. Emerging nanomedicine-based strategies for preventing metastasis of pancreatic cancer. J Control Release. 2020;320:1–13. doi: 10.1016/j.jconrel.2020.01.041.
- Haeberle L, Esposito I. Pathology of pancreatic cancer. Transl Gastroenterol Hepatol. 2019;4:50. doi: 10.21037/tgh.2019.06.02.
- Rawla P, Sunkara T, Gaduputi V. Epidemiology of pancreatic cancer: global trends, etiology and risk factors. World J Oncol. 2019;10(1):10–27. doi: 10.14740/wjon1166.
- Goggins M, Overbeek KA, Brand R, et al. Management of patients with increased risk for familial pancreatic cancer: updated recommendations from the International Cancer of the Pancreas Screening (CAPS) Consortium. Gut. 2020;69(1):7–17. doi: 10.1136/gutjnl-2019-319352.
- Luchini C, Brosens LAA, Wood LD, et al. Comprehensive characterization of pancreatic ductal adenocarcinoma with microsatellite instability: histology, molecular pathology and clinical implications. Gut. 2021;70(1):148–156. doi: 10.1136/gutjnl-2020-320726.
- Siegel RL, Miller, KD, Jemal A. Cancer statistics, 2019. CA Cancer J Clin. 2019;69(6):438–451. doi: 10.3322/caac.21583.
- Deberardinis RJ, Chandel NS. Fundamentals of cancer metabolism. Sci Adv. 2016;2(5):e1600200. doi: 10.1126/sciadv.1600200.
- Hanahan D, Weinberg RA. Hallmarks of cancer: the next generation. Cell. 2011;144(5):646–674. doi: 10.1016/j.cell.2011.02.013.
- Halbrook CJ, Lyssiotis CA. Employing metabolism to improve the diagnosis and treatment of pancreatic cancer. Cancer Cell. 2017;31(1):5–19. doi: 10.1016/j.ccell.2016.12.006.
- Karasinska JM, Topham JT, Kalloger SE, et al. Altered gene expression along the glycolysis-cholesterol synthesis axis is associated with outcome in pancreatic cancer. Clin Cancer Res. 2020;26(1):135–146. doi: 10.1158/1078-0432.CCR-19-1543.
- Zhou D, Mu D, Cheng M, et al. Differences in lipidomics may be potential biomarkers for early diagnosis of pancreatic cancer. Acta Cir Bras. 2020;35(5):e202000508. doi: 10.1590/s0102-865020200050000008.
- Gabitova-Cornell L, Surumbayeva A, Peri S, et al. Cholesterol pathway inhibition induces TGF-beta signaling to promote basal differentiation in pancreatic cancer. Cancer Cell. 2020;38(4):567–583 e11. doi: 10.1016/j.ccell.2020.08.015.
- Lee JH, Cho YR, Kim JH, et al. Branched-chain amino acids sustain pancreatic cancer growth by regulating lipid metabolism. Exp Mol Med. 2019;51(11):1–11. doi: 10.1038/s12276-019-0350-z.
- Hui S, Ghergurovich JM, Morscher RJ, et al. 2017. Glucose feeds the TCA cycle via circulating lactate. Nature, 551(7678), 115–118. doi: 10.1038/nature24057.
- Recouvreux MV, Moldenhauer MR, Galenkamp KMO, et al. Glutamine depletion regulates slug to promote EMT and metastasis in pancreatic cancer. J Exp Med. 2020;217(9):e20200388. doi: 10.1084/jem.20200388.
- Son J, Lyssiotis CA, Ying H, et al. Glutamine supports pancreatic cancer growth through a KRAS-regulated metabolic pathway. Nature. 2013;496(7443):101–105. doi: 10.1038/nature12040.
- Peng X, Chen Z, Farshidfar F, et al. Molecular characterization and clinical relevance of metabolic expression subtypes in human cancers. Cell Rep. 2018;23(1):255–269 e4. doi: 10.1016/j.celrep.2018.03.077.
- Yu G, Wang L-G, Han Y, et al. clusterProfiler: an R package for comparing biological themes among gene clusters. OMICS. 2012;16(5):284–287. doi: 10.1089/omi.2011.0118.
- Ito K, Murphy D. Application of ggplot2 to pharmacometric graphics. CPT Pharmacometrics Syst Pharmacol. 2013;2(10):e79. doi: 10.1038/psp.2013.56.
- Zhao X, Zeng Z, Chen A, et al. Comprehensive strategy to construct in-house database for accurate and batch identification of small molecular metabolites. Anal Chem. 2018;90(12):7635–7643. doi: 10.1021/acs.analchem.8b01482.
- Sun Y, Wang X, Zhou Y, et al. Protective effect of metformin on BPA-induced liver toxicity in rats through upregulation of cystathionine beta synthase and cystathionine gamma lyase expression. Sci Total Environ. 2021;750:141685. doi: 10.1016/j.scitotenv.2020.141685.
- Guo X, Long P, Meng Q, et al. An emerging strategy for evaluating the grades of Keemun black tea by combinatory liquid chromatography-Orbitrap mass spectrometry-based untargeted metabolomics and inhibition effects on alpha-glucosidase and alpha-amylase. Food Chem. 2018;246:74–81. doi: 10.1016/j.foodchem.2017.10.148.
- Pavlova NN, Thompson CB. The emerging hallmarks of cancer metabolism. Cell Metab. 2016;23(1):27–47. doi: 10.1016/j.cmet.2015.12.006.
- Svensson RU, Shaw RJ. Cancer metabolism: tumour friend or foe. Nature. 2012;485(7400):590–591. doi: 10.1038/485590a.
- Ganapathy-Kanniappan S, Geschwind JF. Tumor glycolysis as a target for cancer therapy: progress and prospects. Mol Cancer. 2013;12:152. doi: 10.1186/1476-4598-12-152.
- Yue M, Jiang J, Gao P, et al. Oncogenic MYC activates a feedforward regulatory loop promoting essential amino acid metabolism and tumorigenesis. Cell Rep. 2017;21(13):3819–3832. doi: 10.1016/j.celrep.2017.12.002.
- Biancur DE, Kimmelman AC. The plasticity of pancreatic cancer metabolism in tumor progression and therapeutic resistance. Biochim Biophys Acta Rev Cancer. 2018;1870(1):67–75. doi: 10.1016/j.bbcan.2018.04.011.
- Qin C, Yang G, Yang J, et al. Metabolism of pancreatic cancer: paving the way to better anticancer strategies. Mol Cancer. 2020;19(1):50. doi: 10.1186/s12943-020-01169-7.
- Gatenby RA, Gillies RJ. Why do cancers have high aerobic glycolysis? Nat Rev Cancer. 2004;4(11):891–899. doi: 10.1038/nrc1478.
- An Y, Cai H, Yang Y, et al. Identification of ENTPD8 and cytidine in pancreatic cancer by metabolomic and transcriptomic conjoint analysis. Cancer Sci. 2018;109(9):2811–2821. doi: 10.1111/cas.13733.
- Zhang G, He P, Tan H, et al. Integration of metabolomics and transcriptomics revealed a fatty acid network exerting growth inhibitory effects in human pancreatic cancer. Clin Cancer Res. 2013;19(18):4983–4993. doi: 10.1158/1078-0432.CCR-13-0209.
- Bott AJ, Shen J, Tonelli C, et al. Glutamine anabolism plays a critical role in pancreatic cancer by coupling carbon and nitrogen metabolism. Cell Rep. 2019;29(5):1287–1298 e6. doi: 10.1016/j.celrep.2019.09.056.
- Sun H, Ma H, Hong G, et al. Survival improvement in patients with pancreatic cancer by decade: a period analysis of the SEER database, 1981–2010. Sci Rep. 2014;4:6747. doi: 10.1038/srep06747.
- Vaccaro V, Sperduti I, Milella M. FOLFIRINOX versus gemcitabine for metastatic pancreatic cancer. N Engl J Med. 2011;365(8):768–769; author reply 769. doi: 10.1056/NEJMc1107627.
- Von Hoff DD, Ervin T, Arena FP, et al. Increased survival in pancreatic cancer with nab-paclitaxel plus gemcitabine. N Engl J Med. 2013;369(18):1691–1703. doi: 10.1056/NEJMoa1304369.
- Zhang J, Wang N, Zhou Y, et al. Oridonin induces ferroptosis by inhibiting gamma-glutamyl cycle in TE1 cells. Phytother Res. 2021;35(1):494–503. doi: 10.1002/ptr.6829.
- Liss DB, Paden MS, Schwarz ES, et al. What is the clinical significance of 5-oxoproline (pyroglutamic acid) in high anion gap metabolic acidosis following paracetamol (acetaminophen) exposure? Clin Toxicol. 2013;51(9):817–827. doi: 10.3109/15563650.2013.844822.
- Priolo C, Khabibullin D, Reznik E, et al. Impairment of gamma-glutamyl transferase 1 activity in the metabolic pathogenesis of chromophobe renal cell carcinoma. Proc Natl Acad Sci USA. 2018;115(27):E6274–E6282. doi: 10.1073/pnas.1710849115.
- Badgley MA, Kremer DM, Maurer HC, et al. Cysteine depletion induces pancreatic tumor ferroptosis in mice. Science. 2020;368(6486):85–89. doi: 10.1126/science.aaw9872.
- Park J, Shin Y, Kim TH, et al. Plasma metabolites as possible biomarkers for diagnosis of breast cancer. PLoS One. 2019;14(12):e0225129. doi: 10.1371/journal.pone.0225129.
- Shi J, Yi Z, Jin L, et al. Cyst fluid metabolites distinguish malignant from benign pancreatic cysts. Neoplasia. 2021;23(11):1078–1088. doi: 10.1016/j.neo.2021.09.004.
- Metges CC, Yu YM, Cai W, et al. Plasma L-5-oxoproline carbon and nitrogen kinetics in healthy young adults. J Nutr. 1999;129(11):1998–2004. doi: 10.1093/jn/129.11.1998.
- Martinez-Outschoorn UE, Peiris-Pages M, Pestell RG, et al. Cancer metabolism: a therapeutic perspective. Nat Rev Clin Oncol. 2017;14(1):11–31. doi: 10.1038/nrclinonc.2016.60.
- Rajeshkumar NV, Yabuuchi S, Pai SG, et al. Treatment of pancreatic cancer patient-derived xenograft panel with metabolic inhibitors reveals efficacy of phenformin. Clin Cancer Res. 2017;23(18):5639–5647. doi: 10.1158/1078-0432.CCR-17-1115.
- Linton SS, Abraham T, Liao J, et al. Tumor-promoting effects of pancreatic cancer cell exosomes on THP-1-derived macrophages. PLoS One. 2018;13(11):e0206759. doi: 10.1371/journal.pone.0206759.
- Janakiram NB, Mohammed A, Bryant T, et al. Loss of natural killer T cells promotes pancreatic cancer in LSL-Kras(G12D/+) mice. Immunology. 2017;152(1):36–51. doi: 10.1111/imm.12746.
- Engle DD, Tiriac H, Rivera KD, et al. The glycan CA19-9 promotes pancreatitis and pancreatic cancer in mice. Science. 2019;364(6446):1156–1162. doi: 10.1126/science.aaw3145.
- Comba A, Almada LL, Tolosa EJ, et al. Nuclear factor of activated T cells-dependent down-regulation of the transcription factor glioma-associated protein 1 (GLI1) underlies the growth inhibitory properties of arachidonic acid. J Biol Chem. 2016;291(4):1933–1947. doi: 10.1074/jbc.M115.691972.
- Hughes-Fulford M, Li CF, Boonyaratanakornkit J, et al. Arachidonic acid activates phosphatidylinositol 3-kinase signaling and induces gene expression in prostate cancer. Cancer Res. 2006;66(3):1427–1433. doi: 10.1158/0008-5472.CAN-05-0914.
- Monjazeb AM, High KP, Connoy A, et al. Arachidonic acid-induced gene expression in Colon cancer cells. Carcinogenesis. 2006;27(10):1950–1960. doi: 10.1093/carcin/bgl023.
- Brunton H, Caligiuri G, Cunningham R, et al. HNF4A and GATA6 loss reveals therapeutically actionable subtypes in pancreatic cancer. Cell Rep. 2020;31(6):107625. doi: 10.1016/j.celrep.2020.107625.