
Abstract
Objective
To explore potential biomarkers indicating endometriosis (EM).
Materials and methods
A proteomics method and combined quantitative transcriptomics were adopted to highlight markers in the EM. Venn analysis was used to integrate the ribonucleic acid sequencing (RNA-seq) and protein profiles. Promising candidate markers were tested by enzyme-related immunosorbent assay.
Results
A sum of 979 mRNAs and 39 proteins were tested to be significantly differentially expression in the standard cluster compared with the EM cluster. Venn analysis showed a filtered signature of only two down-regulated molecules in the EM group, i.e. fetuin B (FETUB) and serpin family C member 1 (SERPINC1); the latter showed a big variance between the control category and the EM set in the authentication test.
Conclusion
SERPINC1 may be a useful possible biomarker for the analysis of EM.
Introduction
Endometriosis (EM) is one of the main gynaecological disorders (affecting between 10% and 15% of females in reproductive-age). One of its characteristic is the growth of ectopic endometrial tissue separate from the uterine cavity and can cause impairments in quality of life, including psychiatric disturbances, lower abdominal pain (without or with back pain), deep pelvic pain, fatigue, gastrointestinal disorders, dyspareunia and dysmenorrhea [Citation1]. EM often occurs in the pelvic cavity and can be divided into three categories: superficial peritoneal EM, deep EM and ovarian EM [Citation2]. In the current world, the only way to categorically detect EM is via laparoscopic inspection, if possible, with histological confirmation. Thus, there is a middling of 7–11 years delay between the onset of symptoms and diagnosis [Citation3].
Several mechanisms have been explored to explain EM. The classic mechanisms involve retrograde menstruation but other aetiologies, including inflammatory factors, chemokines, hormones, epigenetic and genetic polymorphisms have also been suggested [Citation2]. Additionally, immunological abnormalities are also significant in the initiation and progression of EM, which is also implicated in other gynaecological diseases [Citation4].
A non‐invasive analytical test for EM-utilizing imagery, biomarkers (in the endometrium, blood, urine or other bodily tissue or fluids), or some mixture of the two has long been sought. An accurate, reliable and non-surgical method for diagnosing EM will help to provide higher-value care. However, despite the proposal of more than 100 markers of EM, none have shown adequate predictive problem-solving value. Up to date, EM markers search has been mainly restricted to aimed compounds (i.e. the metabolites of steroids and arachidonic acid) [Citation5]. Mass spectrometry (MS) is one of the most reliable and widely used procedures for analysing biological samples. Here, we analysed serum plasma protein profiles from patients with and without ovarian EMs, alongside measurements of messenger ribonucleic acid (mRNA) expression differences to [Citation1] understand the possible pathogenesis of EM and [Citation2] to examine the probability of these procedures as minimally invasive diagnostic tests for the disease.
Previous studies have shown that mRNA expression differs. It is related to chemotaxis, haemostasis, blood coagulation, wound healing and extracellular matrix pathways in the luteal endometrium and the menstrual endometrium in patients without and with EM [Citation6]. Our analyses are in line with past reports that demonstrated significant variances in mRNA expression between the luteal and follicular phase in the eutopic endometrium. Cycle phase (i.e. early, mid or late-luteal phase) was shown to have a more noticeable impact on eutopic endometrial mRNA expression than the absence or presence of EM [Citation6–8].
Interestingly, the fibrinogen beta chain gene expression was raised in the eutopic endometrium compared with the endometrium in women lacking EM, but not in females having EM. The conclusion was in line with information from our plasma proteomics analyses, which showed raise in fibrinogen beta chain gene expression in the plasma of females lacking EM than in women having EM [Citation6].
Stem cell differentiation, stem cell pluripotency and epigenetic regulation may all be influenced by long non-coding RNAs (lncRNAs), RNAs with records lengthier than 200 nucleotides that are not turned into proteins (stem cells) [Citation9,Citation10]. A growing body of research demonstrates that lncRNAs are dysregulated and tightly linked to endometrial cancer as tumour suppressor gene and enhance treatment responsiveness [Citation11,Citation12]. LINC00261 was found to prevent cell migration in patients with EM by Sha et al. [Citation13]. The lncRNA H19 was found to boost Let-7 activity, which suppressed insulin-like growth factor 1 receptor production at the post-transcriptional level, resulting in a decrease in endometrial stromal cells [Citation14]. Zhang et al. [Citation15] observed that lncRNA CD36-005 was substantially expression in the uterus of a polycystic ovarian syndrome rat type and enhanced the growth of rat primary endometrial stromal cells in vitro.
The competing endogenous RNA (ceRNA) theory argues that lncRNAs can control other RNA records using microRNA feedback aspects and that ceRNA activity creates a large-scale control network across the transcriptome, widening the functional genetic data in the human genome and playing essential characters in pathological circumstances [Citation16]. MicroRNA (miRNA) may have an effect on mRNA degradation, resulting in variations in transcript levels that can be measured via gene expression analysis. Endometrial receptiveness and the activity of the ceRNA methods have led us to creation of an EM-related network and identify a number of important RNAs that could assist as biomarkers of endometrial accessibility [Citation17].
Based on our prior study, we used MS to evaluate differences in proteomics in patients with ovarian EM. We sought to categorize past unappreciated and possibly promising diagnostic patients for recognizing EM by profiling protein and gene expression changes after clinically diagnosed EM. We did this study on two stages. First, based on our earlier findings that a subset of genes are changed in samples from patients with EM, we are now able to identify the genes that are affected, we systematically assessed transcriptome signatures. Second, quantitative transcriptomics and proteomic approaches to acquire a better knowledge of the major molecular changes that occur at various functional levels, it is reasoned, as well as enable us to highlight markers that are most prominent in the EM process; we also touched on the proteome level.
Methods and materials
Ethics and registration
The Institutional Review Board of Peking Union Medical College Hospital approved the research (no. JS-1722). The registration number is NCT03682341 (clinicaltrials.gov). All patients included in the research gave a written consent for inclusion before enrolment.
Patients
All participants were aged between 20 and 45 years. All contributors had normal menstrual cycles, did not have hormone therapy (i.e. gonadotropin-releasing hormone agonists, contraceptive tablets) before surgery, and did not take anti-inflammatory medications for at least 3 months before the laparoscopy. Patients with systemic disease (including diabetes mellitus, cardiovascular disease, hormone treatment diseases, inflammatory diseases or severe liver or kidney dysfunction), or who were postmenopausal (either physiological or premature) were excluded. Those with a past record of any malignant disease, systemic autoimmune diseases (i.e. systemic lupus erythematosus or rheumatoid arthritis), infection or acute inflammatory process were also excepted from involvement. Endometrioid ovarian cysts were acknowledged before surgery in cases using magnetic resonance imaging and transvaginal ultrasound. Detailed epidemiological, clinical and pathological data were collected prospectively.
The absence or presence of EM was visually affirmed using additional histopathological and laparoscopy study of the samples. Beginning in January 2018, new patients with ovarian EM in the Obstetrics and Gynecology Department of Peking Union Medical College Hospital were prospectively signed in. At the same time, patients with a new diagnosis of serous or dermoid ovarian cysts were recruited as controls.
Part 1. Transcriptomics
Tissue collection
Fourteen infertile women underwent endometrial biopsies in this study’s transcriptomics portion. shows the averages for each participant’s age, BMI, and levels of plasma oestrogen and progesterone.
Table 1. Characteristics of females participating in the research and variables assessed during the menstrual cycle.
It was determined that a total of n = 7 women who had EM, and n = 7 women who were deemed to be clear of EM at surgery, had biopsies taken. Each patient had a single endometrial biopsy during their menstrual cycle. Vaginal ultrasonography was used to keep tabs on the cycle (Aloka-1000, UST-985 transvaginal probe; Aloka Co. Ltd., Tokyo, Japan). Ultrasound monitoring began on the ninth day of the menstrual cycle for these women. Follicular diameter of 14–15 mm necessitated the use of an LH urine test. The biopsy was taken on an open day LH + 7, which was determined by measuring the LH levels in the urine. Sterilized endometrial samples were taken from the uterus using SAP-1 endometrial harvesting instruments (Saipujiuzhou, Beijing, China). Each sample was split into two equal parts and then glued together. After haematoxylin–eosin staining and immunohistochemistry, samples for histological dating were fixed in formalin and turned into wax under uniform circumstances in similar laboratory. This study used Noyes et al. to code and date all biopsies based on histopathology. Liquid nitrogen was used to keep the RNA test specimens cool [Citation15].
RNA-seq analysis and RNA isolation
Conventional TRIzol methods were followed to extract total RNA from epithelial cells (Life Technologies, Inc., Gaithersburg, MD). A Nanodrop ND-1000 was used to determine the RNA purity (Agilent Technologies, Santa Clara, CA). The A260:A280 and A260:A230 proportions of each RNA were above 1.8 and 2.0, respectively. Analyses of the integrity of the RNA were performed using the Agilent 2200 Tape Station. Every single sample had an RNA integrity number of at least 7. A 3′ RNA adapter was used to ligate the RNAs, and a 5′ adapter was used to ligate them. We used reverse transcription-polymerase chain reaction (RT-PCR) to amplify the adapter-ligated RNAs and a low cycling threshold. NEBNext® Multiplex Small RNA Library Prep Set for Illumina® instructions called for the use of polyacrylamide gel electrophoresis for the purpose of selecting the PCR products for size (Illumina, San Diego, CA).
The cleansed products were analysed using the Agilent 2200 TapeStation and watered down to 10 pM for set creation in situ on the HiSeq2500 single-end flow cell, followed by classifying (1 × 50 bp) on the HiSeq 2500. To remove the rRNAs, EpicentreRibo-Zero rRNA Removal Kit was used (Illumina). On subsequent occasions, polyacrylamide gel electrophoresis was used to choose the desired size of the PCR products in accordance with the manufacturer’s recommendations, and chain-specific library classifying was carried out utilizing the uracil N-glycosylase enzymatic approach (New England Biolabs Inc., Ipswich, MA). In order to generate clusters on the HiSeq3000 single-end flow cell in situ, the sanitized L products were diluted to 10 pM and then sequenced on the HiSeq 3000. Differential expression gene (DEG) analysis was performed using DESeq2, which uses reduction approximation for dispersion and fold change estimates to increase the stability and interpretability of values.
Screening of DEGs
When linking two clusters of outline variances, the ‘fold change’ (i.e. the groups’ ratio averages) between the groups for RNAs (differentially expressed mRNAs [DEMs]) was calculated. The arithmetical importance of the variance was approximated by DESeq2. The RNAs with fold variations ≥1 and p values <0.05 were noticed to be meaningfully differentially examined.
Pathway study
In order to estimate the possible functions of DEMs, Gene Ontology (GO) keywords and Kyoto Encyclopedia of Genomes and Genes pathways (KEGG) were found. In order to establish the function of target genes, the GO molecular function and biological procedures terms were applied in three ways: (1) cellular components; (2) biological processes; and (3) molecular functions. An analysis of KEGG pathways was carried out to identify clusters of pathways connected to the molecular interaction and reaction networks of DEGs. The relevance of the pathway connected with these conditions is demonstrated by the enrichment score of log10 p value.
Part 2. Proteomics
Blood sample collection and preparation
Blood was collected from preoperative fasting patients on the day of their scheduled ovarian EM surgeries.
Differential protein screening
Protein quantification and identification were founded on high-resolution/accurate fragmentation data and accurate precursor mass measurements based on N1 unique peptides. Protein abundance was calculated using iBAQ in MaxQuant software. This process has been issued many times and is largely used for various tissue types. Following protein extraction, tandem mass spectrometry (LC-MS/MS) and shotgun liquid chromatography was performed. A data-dependent ‘top 10’ method was employed to operate the MS which was done in positive ion mode. The statistical analysis was performed using SPSS Version 22.0 (SPSS Inc., Chicago, IL, USA). The Scaffold version 4.2.1 software was applied to validate protein identifications and MS/MS-based peptide. The cutoffs of global FDR for protein and peptide credentials were both set to 0.01 at the protein and peptide levels. Proteins with t-test result p < 0.05 were the only ones accepted.
Blast2GO version 4.1.9 software system was used for functional annotation study of the disparity proteins. In this experiment, GO annotation was carried out on all the differential proteins, and the first 20 proteins at level 3 were chosen to make diagrams and obtain their functions. The p value of each GO item was calculated through statistical analysis of GO item enrichment of differentially expressed proteins. A smaller p value indicated relatively more significant enrichment. GO enrichment study of the screened contrasting expressed proteins was performed using BLAST2GO version 4.1.9 software.
KEGG enrichment study was also executed for the screened differential proteins. The notch of KEGG enrichment was examined using the p-value, Rich factor, and the number of proteins improved into the pathway. Rich factor is noted as the ratio of the protein’s numbers enriched in the pathway to the proteins numbers annotated in the pathway. The bigger the Rich factor is, the larger the notch of enhancement. The closer the p value is to zero (i.e. the greater the − log10 p value), the higher the enrichment implication of DEGs in this path. Differential proteins were matched with data from the protein–protein interaction (PPI) human network species in the String record to get the protein interaction data. Mapping results were generated using Cytoscape software.
Part 3. Connecting transcriptomics and proteomics
Venn analysis
Venn analysis was used to find the intersection of RNA-seq and protein profiles. Patients with EM compared to healthy controls showed statistically significant protein and transcript alterations, hence these targets were chosen. Data from transcriptomics and proteomics were combined to identify mRNA and protein regulators that have maintained their differential regulation across time. Because we were looking for molecules that were considerably different from each other, we only accepted molecules that were significantly different (control vs. EM; t-test p < 0.05) from each other in the transcriptomics and proteomics datasets.
Validation with ELISA
Commercial ELISA kits were used to test promising candidate markers. To guarantee that the protein of interest could be accurately detected in serum samples, assays were validated for repeatability and technical sensitivity. For each assay, a complete study set was used in accordance with manufacturer directions.
Statistical study
Continuous variables conforming to standard disseminations were summarized with standard and means deviations. Those that did not conform to usual distributions were summarized with interquartile, ranges and medians ranges. The statistical significance of the DEMs difference was conveniently estimated by DESeq2. The RNAs with fold variations ≥1 and p values <0.05 were noticed to be meaningfully differentially examined. The information in this study was normally distributed, so comparisons between the two groups in characteristics of participants were examined using the unpaired t-test of the study. Categorical variable quantities were examined using Chi-square tests or Fisher’s exact tests. GraphPad Prism version 6.0 (GraphPad Software, Inc., La Jolla, CA) was applied to carry out statistical research. All studies were two-sided, and importance was presented at a p value of 0.05. The Perseus software system was used to examine the variances of the protein in proteomic inventories between patients with and without ovarian EM.
Student’s t-tests were performed on the quantitative protein data for the two groups of samples to be compared, and proteins with p values <0.05 were analysed. The appointment of differential intrant proteins should be determined according to the variation multiple and statistical implications. In this study, proteins with proportion ≤ (1 − 2 *SD) or ratio ≥ (1 + 2*SD) and p values <0.05 were designated as candidate discrepancy proteins. We also carried out a study of difference (two-sample t-tests), set at 1.5-fold for switch-up and 0.67-fold for modified cutoff principles. Differential variations were considered important at a p value of 0.05.
Results
Part 1. Transcriptomics
Overall, 14 participants were comprised in the analysis (seven forbearing with EM and seven controls). The mean age of the forbearing with ovarian EM cysts and the control group was 34.28 (±3.49) years and 33.57 (±2.43) years, respectively. As shows, there was no noticeable variance in age between the two clusters.
RNA-Seq expression summarizing
There were 979 mRNAs (371 up- and 608 down-regulated) in the healthy group compared to the EM group that were shown to be significantly different in expression (i.e. fold variation >1.0 and p 0.05). As seen by the volcano and scatter graphs, the mRNA expression levels of the two groups differ significantly ().
Figure 1. The Gene Ontology (GO) terms, KEGG pathway analyses, scatter plots and volcano indicate the difference of mRNA expression between the two clusters. (A) The volcano and scatter plots. (B) The GO molecular function research identified 30 enriched GO terms. (C)(D) The WikiPathway, Reactome and KEGG pathway analyses.
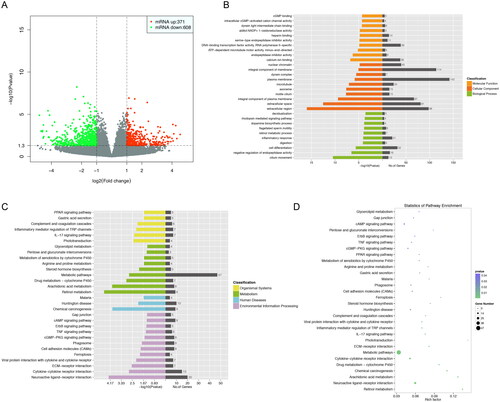
Pathway analysis
The GO organizations and KEGG pathways of the gene were analysed to venture on the possible functions of differentially expression gene types. As shown in , GO function analysis yielded 30 significantly expressed items that were statistically significant (p 0.05 corrected with Benjamini–Hochberg). (p 0.05) shows that the WikiPathway, Reactome and KEGG pathway analyses suggest that these genes may be tangled in ‘oxidative stress’, ‘interaction between L1 and ankyrins’ ‘retinol metabolism’ and ‘drug metabolism’.
Part 2. Proteomics
Protein identification
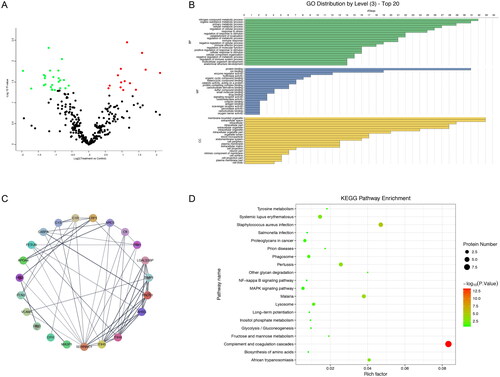
We carried out a high-resolution proteomics detection analysis on a set of 20 patients with EM and 20 patients without EM to identify proteins in EM. A total of 420 proteins were found by LC-MS/MS, and 305 were quantitative proteins. The screening condition was that the deletions value was less than 60% in each group. Comparing serum proteomes from patients with EM and serum proteomes from the control group revealed 39 largely differentially expression proteins. Network and GO study, performed using String and Blast2GO, discovered that the differentially expressed proteins are mainly tangled in responses to cellular processes, localization, metabolic, immune system and stimuli (; Supplementary Figure 1). The qualitative and quantitative raw data for total proteins is displayed in the excel list in the Supplementary Table 1.
Figure 2. The GO terms, KEGG pathway analyses, PPI, scatter plots and volcano show the difference of protein expression between the two groups. (A) The volcano and scatter plots. (B) The GO molecular function. (C) The PPI network. (D) The KEGG enrichment analysis.
Untargeted protein screening
Using LC-MS/MS, 420 proteins (specific polypeptide ≥1) were identified, 305 of which were quantified with screening conditions meeting the deletion value of less than 60% in each group. A total of 39 proteins showed statistically significant differences between the EM and control groups (fold change cutoffs of 1.5 and 0.677, and a p value cutoff of 0.05). These 39 proteins also underwent further verification, returning a filtered signature of only 14 proteins (>1.5) that were significantly upregulated and 25 proteins (<0.67) that were largely remoulded in the EM category compared with the control cluster. These signatures are summarized in a volcano plot ().
Pathway enrichment and Gene Ontology analysis
GO annotation () was carried out to describe the function of all the differentially expressed proteins. Proteins were analysed distinctly for (1) enrichment of the GO organic progression, (2) cellular components and molecular functions (3) protein networks for interaction, and (4) disease associations and KEGG pathways. In each contrast, the protein lists were analysed distinctly as down or up-regulated proteins. Basing on the GO cataloguing, most of the differentially stated proteins were located in membrane-bounded organelles and extracellular space. According to the Blast2GO 4.1.9 functional categories, the main molecular functional categories of these proteins were protein binding, ion binding and enzyme regulatory activity. Additionally, the main function of categories that were overexpressed in the EM group was protein binding and ion binding. These proteins were also involved in different biological progressions, such as; metabolic processes, stress responses, stimuli responses, immune responses, localization and cellular processes.
String analysis suggested that there were interactions between the differentially expressed proteins. These proteins were imported into the PPI network of human species in the String database to get information about protein interaction. The results indicated that 22 of the 39 proteins interacted with one another (). The KEGG enrichment study indicated that the screened differential proteins were mainly enhanced in the complement system ().
Part 3. Integration of proteomics and transcriptomics datasets
Venn analysis to classify obstinately differentially controlled molecules
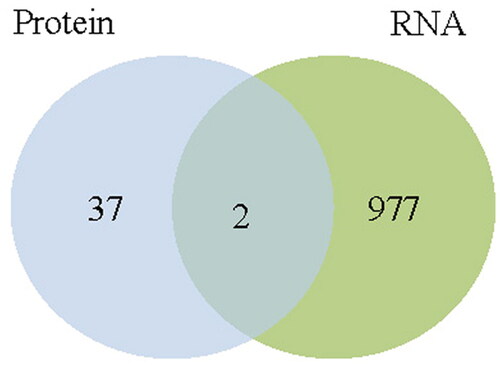
Venn analysis was used to integrate the RNA-seq and protein profiles (i.e. the targets that showed statistically large changes at both the transcript and protein levels were selected). This joint study returned a perfect sign of only two down-regulated molecules, fetuin B (FETUB) and serpin family C member 1 (SERPINC1), which showed significant changes at both the transcript and protein levels ().
Figure 3. Venn analysis was used to integrate the RNA-seq and protein profiles.
Testing candidates with ELISA
Promising candidate markers were tested with ELISA; FETUB and SERPINC1 were appointed for further studies as serological markers using 44 women as samples (control = 22, EM = 22, ). Only SERPINC1 showed significant variances between the control group and the EM group in the validation examination.
Table 2. Characteristics of women participating in the ELISA evaluating study.
Discussion
EM is characterised by the existence of endometriotic-like tissue outside the uterine cavity that is growing and functioning [Citation18]. Endometriotic lesions and histological confirmation by laparoscopy or laparotomy are necessary for a definitive diagnosis of the disease. Tranvaginal ultrasonography as well as CA-125 biomarkers has also been used for diagnostic purposes. The development of blood-based diagnostic assays for EM has been hampered by the fact that few of the described markers have been independently verified and none are now used in clinical practice [Citation19–22]. For these reasons, the urgent need for non-invasive biomarkers is clear and substantial. The average delay in diagnosis is between 7 and 11 years [Citation3]. While, early-stage EM is not without consequences, diagnostic delays may allow the disease to progress, resulting in decreased treatment efficiency and poorer outcomes. Clinically valuable blood-borne indicators have yet to be create; as such, there is still an unmet requirement for a minimally aggressive diagnostic examination for EM.
Due to post-translational modifications taking place in cells, the genome and the expressed proteome differ significantly. High-throughput protein analysis is essential. mRNA expression does not always correlate protein expression or accumulation in tissues since transcripts have a shorter half-life than proteins. As a result of post-translational changes and protein–protein interactions, protein structures become more complex and diversified [Citation23].
In proteomics research, proteins and peptides that are expressed in different tissues or under different situations are identified. Precursors of EM or consequences of the disease may be responsible for these changes in protein expression [Citation24]. It is taken until now to find proteins or peptides that are expressed differently in the blood or urine of EM patients compared to healthy controls or between endometriums that are either eutopic or ectopic [Citation25]. Many eutopic endometrial proteins have been found to be differently expressed between patients with EM and controls, but few have been proven to have a role in the development of EM [Citation26].
Here, we used a combination of transcriptomics and proteomics to provide a comprehensive overview of proteins that showed persistently different mRNA and protein expression in patients with EM. We accepted only significantly differentially regulated molecules in both transcriptomics and proteomics high-throughput datasets to ensure stringent filtering. The intersection of proteomics and transcriptomics is useful in this context. In contrast to mRNA screening, proteomics establishes the functional expression of proteins from controlled transcripts and underscores the changes in EM serum proteotypic compositions. mRNA and protein expression levels can differ significantly. However, choosing targets using two different biological levels reduced the chances for false-positive findings and allowed us to investigate the information for further investigation and validation of clinical correlations.
An established method for protein quantification, label-free shotgun proteomics, has been bolstered by recent advances in multidimensional LC and MS [Citation27,Citation28]. These proteins correlating to EM were identified using an untargeted quantitative technique. Proteins that were linked to gene expression were identified by performing a complementary targeted transcriptomics research on a different sample set. We were able to compare two different sets of data for validation by integrating protein and transcript level profiles.
The intersection of transcriptomics and proteomics from two independent laboratories guarantees balanced endorsement of high-throughput information and offers assurance in sifting these molecular goals. Nevertheless, our focus on differentially regulated proteins, both at the protein and mRNA level, points the likely significance of these differentially controlled signs to EM. The combination of transcriptomics and proteomics returned two persistently down-regulated proteins, FETUB and SERPINC1, but only SERPINC1 proved meaningful when validated using an ELISA assay.
As indicates, SERPINC1 exhibited significant variances in the EM vs. control group on both the transcript and protein level, and these differences were supported by ELISA in the validation set. Validation using ELISA in an independent sample set (n = 44) showed a similar and statistically important trend (p < 0.05). The SERPINC1 gene is located on chromosome 1q23-25 and comprises 6 introns and 7 exons and spans 13.4 kbp of genomic deoxyribonucleic acid [Citation29]. The SERPINC1 gene has a wide range of mutations, according to prior studies. To date, there have been more than 250 reports linking antithrombin deficiency with mutations in the SERPINC1 gene [Citation30]. Mutations in SERPINC1 were discovered via direct sequencing of all seven exons and regulatory areas, as well as multiplex ligation-dependent probe amplification, in 21 families studied by Mulder et al. They found that nearly half of the SERPINC1 mutations were linked to type I antithrombin deficiency. The most common cause of antithrombin deficiency is a mutation in the SERPINC1 gene [Citation30]. Because EM has long been considered a disease characterized by haemorrhage, the down-regulation of SERPINC1 may be associated with the aetiology of EM through the antithrombin pathway, which could lead to dysfunctional anticoagulation.
SERPINC1 belongs to serpin superfamily of serine proteinase inhibitors with special primary structure. Up to now, 34 serpins have been identified and divided into nine clades in human [Citation31]. Serpin family proteins have been study as potential biomarkers and therapeutic drugs in other disease [Citation32]. After treatment with plasminogen activator inhibitor (PAI) 1 for patients with EM, Gómez et al. found a significant change of serpin-1 in patients, which suggested that the serpin family was indeed a potential target for EM treatment through the antithrombin pathway. However, considering that there are many suptypes in serpin family, whose functions are not completely consistent, and others are rarely reported. We can further study other members of serpin family in the future [Citation33].
Another target correlating with EM identified by both transcriptomics and proteomics results were FETUB, but it was not significant according to the ELISA test. Nevertheless, previous studies have shown that FETUB is related to female infertility, which is one of the most critical symptoms of EM. Preliminary research shows that FETUB helps to sustain the penetration of zona pellucida (ZP). Cortical granule proteinase ovastacin breaks down ZP protein 2 (ZP2) after fertilization of the egg, leading to a permanent block of fertilization, also known as ZP stiffening [Citation34,Citation35]. To prevent premature ovulation, FETUB (a plasma protein that originates in the liver) effectively blocks the production of ovastacin [Citation36,Citation37]. ZP stiffening occurs before fertilization in the absence of FETUB, preventing sperm from penetrating the egg. Therefore, our results showing that the EM group had down-regulated FETUB may have been due to patients in the EM group having greater instances of infertility. Thus, we could speculate that FETUB may be the main cause of infertility in patients with EM. Future work should pay attention to this molecule and its correlation with EM.
The main challenges experienced in this study related to variable blood contamination and the heterogeneity of tissue samples. This was affirmed by the availability of serum proteins and variable levels of plentiful fibro-muscular across the illustration set that may have corrupted the quality of the study. While combining would result to some of this heterogeneity, outlier samples could have skewed the data and led to a higher FDR. In spite of this, a few differentially expression proteins assayed in serum samples were identified as potential biomarkers and resulted to multivariate representations that could distinguish patients with EM from control patients with reasonable accuracy. Therefore, through a combination of transcriptomics and proteomics and subsequent validation, we prospect that SERPINC1 has potential as a blood marker for the noninvasive detection of EM earlier.
Conclusion
Overall, we connected transcriptomics with proteomics and identified two differentially expression proteins in the plasma of women with EM. Nevertheless, only SERPINC1 proved to be notably reduced in the plasma of the forbearing with EM after an ELISA validation test. Therefore, SERPINC1 may be a useful possible biomarker for the testing of EM. However, further researches are needed to assess its clinical utility.
Ethics approval and consent to participate
This research was approved by the Institutional Review Board of Peking Union Medical College Hospital (no. JS-1722). The registration number is NCT03682341 (clinicaltrials.gov). All patients included in the study provided written informed consent for inclusion before enrolment. This study was conducted in accordance with the declaration of Helsinki.
Authors’ contributions
Conception and design of the research: Xiaoyan Li
Acquisition of data: Xi Wang
Analysis and interpretation of the data: Zhiyue Gu
Statistical analysis: Tingting Sun
Obtaining financing: Jinhua Leng
Writing of the manuscript: Xiaoyan Li
Critical revision of the manuscript for intellectual content: Qi Yu
All authors read and approved the final draft.
Consent for publication
Not applicable.
Supplemental Material
Download Zip (661.5 KB)Acknowledgements
We would like to acknowledge the hard and dedicated work of all the staff that implemented the intervention and evaluation components of the study.
Disclosure statement
No potential conflict of interest was reported by the authors.
Availability of data and materials
The datasets used and/or analysed during the current study available from the corresponding author on reasonable request.
Additional information
Funding
References
- Saunders PTK, Horne AW. Endometriosis: etiology, pathobiology, and therapeutic prospects. Cell. 2021;184(11):1–10. doi: 10.1016/j.cell.2021.04.041.
- Taylor HS, Kotlyar AM, Flores VA. Endometriosis is a chronic systemic disease: clinical challenges and novel innovations. Lancet. 2021;397(10276):839–852. doi: 10.1016/S0140-6736(21)00389-5.
- Staal AH, van der Zanden M, Nap AW. Diagnostic delay of endometriosis in the Netherlands. Gynecol Obstet Invest. 2016;81(4):321–324. doi: 10.1159/000441911.
- Wu X, Lu W, Xu C, et al. Macrophages phenotype regulated by IL-6 are associated with the prognosis of platinum-resistant serous ovarian cancer: integrated analysis of clinical trial and omics. J Immunol Res. 2023;2023:6455704.
- Anastasiu CV, Moga MA, Elena Neculau A, et al. Biomarkers for the noninvasive diagnosis of endometriosis: state of the art and future perspectives. Int J Mol Sci. 2020;21(5):1750.
- Fassbender A, Verbeeck N, Bornigen D, et al. Combined mRNA microarray and proteomic analysis of eutopic endometrium of women with and without endometriosis. Hum Reprod. 2012;27(7):2020–2029. doi: 10.1093/humrep/des127.
- Aghajanova L, Giudice LC. Molecular evidence for differences in endometrium in severe versus mild endometriosis. Reprod Sci. 2011;18(3):229–251. doi: 10.1177/1933719110386241.
- Fassbender A, Waelkens E, Verbeeck N, et al. Proteomics analysis of plasma for early diagnosis of endometriosis. Obstet Gynecol. 2012;119(2 Pt 1):276–285. doi: 10.1097/AOG.0b013e31823fda8d.
- Zhao M, Wang J, Xi X, et al. SNHG12 promotes angiogenesis following ischemic stroke via regulating miR-150/VEGF pathway. Neuroscience. 2018;390:231–240. doi: 10.1016/j.neuroscience.2018.08.029.
- Ahmed W, Liu ZF. Long Non-Coding RNAs: novel players in regulation of immune response upon herpesvirus infection. Front Immunol. 2018;9:761. doi: 10.3389/fimmu.2018.00761.
- Zhai W, Li X, Wu S, et al. Microarray expression profile of lncRNAs and the upregulated ASLNC04080 lncRNA in human endometrial carcinoma. Int J Oncol. 2015;46(5):2125–2137. doi: 10.3892/ijo.2015.2897.
- Yang L, Zhang J, Jiang A, et al. Expression profile of long non-coding RNAs is altered in endometrial cancer. Int J Clin Exp Med. 2015;8(4):5010–5021.
- Sha L, Huang L, Luo X, et al. Long non-coding RNA LINC00261 inhibits cell growth and migration in endometriosis. J Obstet Gynaecol Res. 2017;43(10):1563–1569. doi: 10.1111/jog.13427.
- Ghazal S, McKinnon B, Zhou J, et al. H19 lncRNA alters stromal cell growth via IGF signaling in the endometrium of women with endometriosis. EMBO Mol Med. 2015;7(8):996–1003. doi: 10.15252/emmm.201505245.
- Zhang X, Xu Y, Fu L, et al. Identification of mRNAs related to endometrium function regulated by lncRNA CD36-005 in rat endometrial stromal cells. Reprod Biol Endocrinol. 2018;16(1):96. doi: 10.1186/s12958-018-0412-4.
- Salmena L, Poliseno L, Tay Y, et al. A ceRNA hypothesis: the rosetta stone of a hidden RNA language? Cell. 2011;146(3):353–358. doi: 10.1016/j.cell.2011.07.014.
- Wang X, Yu Q. Endometriosis-related ceRNA network to identify predictive biomarkers of endometrial receptivity. Epigenomics. 2019;11(2):147–167. doi: 10.2217/epi-2018-0190.
- Giudice LC, Kao LC. Endometriosis. Lancet. 2004;364(9447):1789–1799. doi: 10.1016/S0140-6736(04)17403-5.
- Fassbender A, Vodolazkaia A, Saunders P, et al. Biomarkers of endometriosis. Fertil Steril. 2013;99(4):1135–1145. doi: 10.1016/j.fertnstert.2013.01.097.
- Simoens S, Hummelshoj L, D’Hooghe T. Endometriosis: cost estimates and methodological perspective. Hum Reprod Update. 2007;13(4):395–404. doi: 10.1093/humupd/dmm010.
- Nisenblat V, Bossuyt PMM, Shaikh R, et al. Blood biomarkers for the non-invasive diagnosis of endometriosis. Cochrane Database Syst Rev. 2016;2016(5):CD012179. doi: 10.1002/14651858.CD012179.
- May KE, Conduit-Hulbert SA, Villar J, et al. Peripheral biomarkers of endometriosis: a systematic review. Hum Reprod Update. 2010;16(6):651–674. doi: 10.1093/humupd/dmq009.
- Ma X, Fan L, Meng Y, et al. Proteomic analysis of human ovaries from normal and polycystic ovarian syndrome. Mol Hum Reprod. 2007;13(8):527–535. doi: 10.1093/molehr/gam036.
- Siristatidis CS. What have the ‘omics done for endometriosis? Med Sci Monit. 2009;15(5):RA116–RA23.
- May KE, Villar J, Kirtley S, et al. Endometrial alterations in endometriosis: a systematic review of putative biomarkers. Hum Reprod Update. 2011;17(5):637–653. doi: 10.1093/humupd/dmr013.
- Siva AB, Srivastava P, Shivaji S. Understanding the pathogenesis of endometriosis through proteomics: recent advances and future prospects. Proteom Clin Appl. 2014;8(1–2):86–98.
- Glish GL, Vachet RW. The basics of mass spectrometry in the twenty-first century. Nat Rev Drug Discov. 2003;2(2):140–150. doi: 10.1038/nrd1011.
- Blackburn K, Mbeunkui F, Mitra SK, et al. Improving protein and proteome coverage through data-independent multiplexed peptide fragmentation. J Proteome Res. 2010;9(7):3621–3637. doi: 10.1021/pr100144z.
- Bock SC, Harris JF, Balazs I, et al. Assignment of the human antithrombin III structural gene to chromosome 1q23-25. Cytogenet Cell Genet. 1985;39(1):67–69. doi: 10.1159/000132105.
- Mulder R, Croles FN, Mulder AB, et al. SERPINC1 gene mutations in antithrombin deficiency. Br J Haematol. 2017;178(2):279–285. doi: 10.1111/bjh.14658.
- Gettins PG. Serpin structure, mechanism, and function. Chem Rev. 2002;102(12):4751–4804. doi: 10.1021/cr010170+.
- Yan B, Luo L, Liu L, et al. Serpin family proteins as potential biomarkers and therapeutic drugs in stroke: a systematic review and meta-analysis on clinical/preclinical studies. CNS Neurosci Ther. 2023;29(7):1738–1749. doi: 10.1111/cns.14205.
- Gómez R, Abad A, Delgado F, et al. Effects of hyperprolactinemia treatment with the dopamine agonist quinagolide on endometriotic lesions in patients with endometriosis-associated hyperprolactinemia. Fertil Steril. 2011;95(3):882–888.e1. doi: 10.1016/j.fertnstert.2010.10.024.
- Burkart AD, Xiong B, Baibakov B, et al. Ovastacin, a cortical granule protease, cleaves ZP2 in the zona pellucida to prevent polyspermy. J Cell Biol. 2012;197(1):37–44. doi: 10.1083/jcb.201112094.
- Sachdev M, Mandal A, Mulders S, et al. Oocyte specific oolemmal SAS1B involved in sperm binding through intra-acrosomal SLLP1 during fertilization. Dev Biol. 2012;363(1):40–51. doi: 10.1016/j.ydbio.2011.12.021.
- Dietzel E, Wessling J, Floehr J, et al. Fetuin-B, a liver-derived plasma protein is essential for fertilization. Dev Cell. 2013;25(1):106–112. doi: 10.1016/j.devcel.2013.03.001.
- Stöcker W, Karmilin K, Hildebrand A, et al. Mammalian gamete fusion depends on the inhibition of ovastacin by fetuin-B. Biol Chem. 2014;395(10):1195–1199. doi: 10.1515/hsz-2014-0189.