
Abstract
Objective
To explore the novel applications of histological factors by stratifying the prognostic markers of the overall CRC patients in subgroups.
Materials and methods
A total of 17 histopathological and molecular factors were retrospectively collected and systematically analyzed for the prediction of CRC prognosis in the overall and stratified subgroups by using the Kaplan-Meier curve analysis as well as the Cox regression test. The χ2 test was used to analyze the correlation of the prognostic markers with other factors.
Results
The histopathological markers including the lymph node metastasis (LNM), perineural/venous invasion (PVI), TNM stage, the local recurrence or distant metastasis after surgery (R/M) and the molecular markers Ki-67 expression as well as KRAS mutation were identified to be the independent prognostic biomarkers in the overall CRC. The differential prognosis of LNM was found to be significant in age, tumor site, histological classification (histo_classification), cell differentiation, and KRAS/NRAS/BRAF (KNB) mutation stratified subgroups. The PVI was discovered to differently predict survival for patients in age, histo_classification, differentiation, and R/M stratified subgroups. Same as LNM and PVI, TNM was also found to demonstrate differential prognosis in age, tumor site, histo_classification, differentiation, R/M status and KRAS/KNB mutation stratified subgroups. More importantly, R/M was firstly identified not to be terrible for patients in age, histo_classification, LNM, TNM, Ki-67, and KRAS/KNB stratified subgroups. Besides, KRAS mutation was innovatively found to show differential prognosis in age, differentiation, and LNM stratified subgroups.
Conclusions
The stratification analyses of prognostic markers in CRC patients indicate novel applications of the above histopathological and molecular markers in clinic and the findings provide new insights into future investigations of precision pathology.
KEY MESSAGES
The pathological markers LNM, PVI, TNM stage, R/M, the histological marker Ki-67 expression and the molecular marker KRAS mutation are all the early biomarkers capable of independently predicting the 2-year survival rate for CRC.
Differential prognosis of the histopathological and molecular markers is commonly found in age, tumor site, differentiation, histological type, LNM, TNM, and R/M stratified CRC subgroups.
Introduction
With the development, the ageing population and dietary habits have greatly posed risks for colorectal cancer (CRC), which is now the world’s third most common malignancy and the fourth most deadly cancer [Citation1], while it is the second most commonly diagnosed cancer type and the fifth leading cause of cancer related death in China [Citation2]. Currently, the histological factors such as the TNM stage, histological classification (histo_classification), cell differentiation, tumor invasion depth, lymph node metastasis (LNM), perineural invasion and venous invasion (PVI) are still the gold standards guiding the subsequent management of CRC patients [Citation1].
The status of LNM and the number of positive lymph nodes (LNs), both of which predict the poor survival for CRC patients, have been integrated into TNM staging system according to the American Joint Committee on Cancer (AJCC) 7th guideline [Citation3]. Generally, the number of retrieved LNs in CRC is highly associated with tumor stage and its right-sided location. However, studies have also shown that higher number of LN (>11) predicts better progression free survival (PFS) and OS in advanced CRC patients [Citation4,Citation5]. The PNI, another potential TNM staging factor, has also been reported to significantly predict poor survival for CRC patients [Citation6], which could be surprisingly rescued by adjuvant chemotherapies [Citation7]. It appears that the prognosis of LNM and PVI in CRC population still needs to be comprehensively investigated in other histopathological and molecular stratified subgroups.
The Ki-67 has been widely used as a tumor diagnostic marker in multiple malignancies because of its role in proliferation and has also been suggested as a prognostic biomarker for CRC due to its close correlation with tumor invasiveness, metastasis and risk of relapse [Citation8]. However, its prognostic role is still challenged. Its high expression has been reported to be a good prognostic marker in overall CRC patients [Citation8], contrarily, its high expression predicts poor survival in stage I/II/III of CRC patients [Citation9]. KRAS is commonly mutated in CRC with a prevalence of 40% [Citation10]. Mechanistically, once its mutations occur, specifically at G12, G13, Q16 sites, the hydrolysis of GTP is disrupted to maintain its activity so that it can continuously drive the activation of downstream signaling pathways, thereby promoting tumor cell proliferation [Citation10]. In line with its biological functions, its mutations have been reported to be highly associated with poorer survival in CRC, specifically in metastatic CRC [Citation11].
Overall, it appears that most of those well-known histopathological and molecular factors in CRC have been intensively explored as prognostic or predictive biomarkers in specific subgroups. However, to our present knowledge, no one has comprehensively reported the differential prognosis of these independently prognostic markers. Herein, in this study, the independent prognostic markers were firstly identified from a total of 17 factors in overall CRC patients who were initially diagnosed and received radical operation from June 2018 to February 2022 in our hospital, which include LNM, PVI, R/M status, TNM stage, Ki-67 expression and KRAS/KNB mutation. Subsequently, the differential prognosis of above factors in other 16 factors was comprehensively explored using the Kaplan-Meier (KM) survival curve test and Cox regression test. Interestingly, our findings not only support results from previous individual reports, but also find that the prognosis of those independent prognostic markers in overall CRC is commonly different in age, tumor site, differentiation, histological type, LNM, TNM, and R/M stratified subgroups. In summary, our data not only provide novel insights into precisely predicting the prognosis for some histopathological and molecular factors stratified CRC patients, but also will provide a new direction for precision pathology in guiding the appropriate management in specific CRC subgroups.
Materials and methods
Patients, follow up and ethics
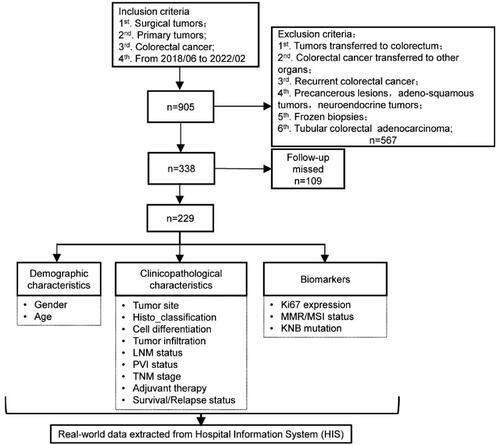
A total of 905 primary CRC patients diagnosed and surgically treated in our hospital from June 2018 to February 2022 were initially included in the study. Then the CRC tumors transferred to colorectum, transferred to other organs and the recurrent ones were excluded (n = 567). The follow-up of 338 patients was performed via telephone in May 2022, and 109 patients were out of contact without follow-up information. The flowchart of inclusion and exclusion process was shown in . The analyzed histopathological and molecular factors (n = 17) were retrospectively retrieved from the hospital information system (HIS), followed by the manual curation. This study was approved by the institutional review board of Shanghai Ninth People’s Hospital, Shanghai Jiao Tong University School of Medicine (No. SH9H-2022-T114-2) and performed in accordance with the Declaration of Helsinki.
Figure 1. Flowchart of the inclusion and exclusion process in the study.
Histopathological diagnosis
All the samples were the formalin-fixed paraffin-embedded (FFPE) tumor tissues from the primary CRC lesions and diagnosed by board certificated pathologists. Notably, in the study, the perineural and venous invasion (PVI) was defined as positive (PVIpos) when at least one of them was positive, otherwise, it was PVI negative (PVIneg). The LNM was defined as positive (LNMpos) when at least one LN was diagnosed positive, otherwise, it was LNM negative (LNMneg).
Immunostaining and interpretation criteria
The immunohistochemistry (IHC) assays were performed by pathological technicians on the Ventana BenchMark ULTRA instrument (Roche, United States). The primary antibodies were commercially purchased from Agilent (Shanghai, China) for the mismatch repair (MMR) proteins (MLH1, MSH2, MSH6, PMS2) and Ki-67 antibodies, respectively. All the secondary antibodies and other staining materials were the accessory products of Ventana. Ki-67 expression was evaluated based on the staining percentage (%) in tumor cells according to the manufacture’s protocol, taking 50% as the cutoff, which was determined by the receiver operating characteristic (ROC) curve analysis evaluating its predicting reliability and the best cutoff for overall survival (OS) in our cohort (Figure S1A). When one of above MMR proteins was stained negatively in the nucleus of tumor cells, it was diagnosed as MMR deficiency (dMMR), otherwise, the MMR proficiency (pMMR). The representative immunostaining of Ki-67 was scanned using the digital scanner NanoZoomer S60 (Hamamatsu Photonics, Japan) and was exported from the NDP.view2 software (version 2.8.24) at indicated resolution (Figure S1B). While the representative immunostaining of MMR proteins was taken under the OLYPUS microscope (BX53) with CapStudio imaging software and shown in Figure S2.
Detection of molecular markers
In the study, the mutations of KRAS/NRAS/BRAF (KNB) were tested using the AmoyDx® human KRAS/NRAS/BRAF mutations detection kit (ADx-KN04-MX, Xiamen, China), which is commercially used to test the KRAS mutations at exon 2 (G12A/C/D/V/S, G13D), exon 3 (Q61H) and exon 4 (K117N, A146V/P/T), NRAS mutations at exon 2 (G12D) and exon 3 (Q61R/K), BRAF mutations at exon 15 (V600E). The microsatellite was amplified and sequenced on the 3500 Dx Genetic Analyzer instrument (Applied Biosystems, USA), which was interpreted as highly instable microsatellite (MSI-H) or stable microsatellite (MSS) according to the manufacture’s protocol (AmoyDx, Xiamen, China).
Statistical analysis
In the study, the histopathological and molecular factors were all manually curated as binary variables, as shown in . The Pearson χ2 test or the Fisher’s exact test were used for the correlation analysis. The univariate and multivariate Cox regression analysis was used to identify the independent prognostic markers in the overall cohort. The Log-rank (Mantel-Cox) test was used for the Kaplan-Meier (KM) survival analysis. All the p-values (pval) were calculated either by SPSS (RRID: SCR_002865, version 25.0) or Graph Prism 8, and the two-sided pval less than 0.05 was defined statistically significant. Notably, the differential prognosis of markers in all the other factors stratified subgroups was determined when both the KM survival data was different among the stratified subgroups and its interrelated pval with the markers was less than 0.025 [Citation12].
Table 1. Demographics of the overall CRC population in the study.
Results
Demographics of the overall CRC population
In the study, 229 CRC patients were finally included for the downstream analysis. The median follow-up period was 561 days, ranging from 110 days to 1054 days. In the overall population, patients over 50 years old were 213 cases (93.0%), with colon cancers 140 cases (61.1%), with LNMpos 101 cases (44.1%), with advanced cases 115 cases (50.2%), with adjuvant therapies were 155 cases (67.7%), with Ki-67>50% 202 cases (88.2%), with MMR deficient (dMMR) or MSI-H 16 cases (7.0%), and with mutated KRAS (KRASmut) 96 cases (46.8%). The detailed demographics of the study population was summarized in . Notably, some data of LNM, PVI, KRAS and KNB mutation were missed for some patients.
LNM, PVI, TNM, R/M, Ki-67 expression and KRAS mutation are the independent prognostic markers in the overall CRC population
To determine the independent prognostic markers in our CRC cohort, we studied the OS prognosis of all the included factors using the univariate and multivariate Cox regression analysis. As shown in , the LNM status (p = 0.028), PVI status (p = 0.021), TNM stage (p = 0.004), R/M status (p < 0.0001), Ki-67 expression (p = 0.030), and KRAS mutation (p = 0.023) were identified as the independent prognostic markers in our study cohort.
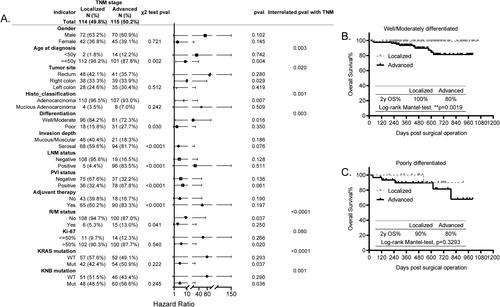
Figure 2. Independent histopathological and molecular prognostic markers identified in the overall CRC population. (A) The forest plot showing the univariate and multivariate Cox regression survival analysis used to identify the independent prognostic markers in the overall population. pval, statistical p-value. (B–G) The Kaplan-Meier (KM) survival curves showing the differential prognosis indicated by 2 y OS% of LNM (B), PVI (C), TNM (D), R/M (E), Ki-67 (F) and KRAS mutation (G) in the overall population. *p < 0.05, **p < 0.01, ***p < 0.001, ****p < 0.0001.
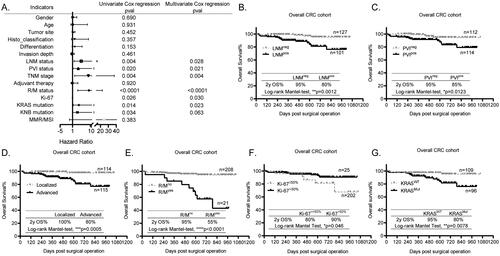
According to the individual KM survival curves of above independent prognostic markers, the CRC patients with negative LNM (LNMneg) and PVI (PVIneg) had significantly better 2 y OS% than those with positive LNM (LNMpos, , p = 0.0012) and PVI (PVIpos, , p = 0.0123), respectively. Furthermore, the KM curves of TNM showed that the 2 y OS% of patients with localized CRC was up to 100%, whereas it was 80% for those with advanced stage (, p = 0.0005). Besides, consistent with our general concept, the patients with R/M (R/Myes) apparently had poorer 2 y OS% than those without R/M (R/Mno) (, p < 0.0001, 2 y OS%: 55% vs 95%). In terms of Ki-67, contrary to its biological roles, it was discovered to be a favorable prognostic marker in CRC, which showed that patients with higher Ki-67 (Ki-67>50%) had better 2 y OS% than those with lower Ki-67 (Ki-67≤50%) (, 90% vs 80%, p = 0.046). However, this finding is consistent with reports from others, who also suggest that the Ki-67 is a good classification tool for prognosis in CRC when taking 25% as the cutoff [Citation9]. Interestingly, the KRASmut at G12 or G13 sites tested in this study was an independent prognostic marker in the overall CRC population, showing that patients with wild-type KRAS (KRASWT) had significantly higher 2 y OS% than those with KRASmut (, p = 0.0078, 95% vs 80%), same as findings from previous studies [Citation10]. However, the KNB mutation, including 1.3% BRAF mutation and 3.9% NRAS mutation, was not an independent prognostic marker. Taken all together, the independent prognostic markers for 2 y OS% identified in our study were same as the long-term OS% in CRC worldwide.
The survival prognosis of LNM is significantly different in age, tumor site, histological classification, cell differentiation, KRAS mutation and KNB mutations stratified CRC subgroups
The histological factor LNM which has been integrated into TNM staging system in AJCC guideline is crucial for individualized therapy in malignancy [Citation13]. In our study, as shown in , we found that it was closely correlated with patients’ age at diagnosis (p = 0.010), tumor cell differentiation (p = 0.030), tumor invasion depth (p = 0.001), PVI status (p < 0.0001), TNM stage (p < 0.0001), and the adjuvant therapy (p < 0.0001), indicating that CRC patients who are young (<50 y), with poorly differentiated cells, with invasion depth into serosal, with PVIpos, with advanced TNM stage are prone to have higher rate of LNMpos, thus leading to higher possibility to receive adjuvant therapies according to the NCCN guideline [Citation14].
Figure 3. Prognosis of LNM in all the other histopathological and molecular markers stratified subgroups. (A) The forest plot showing the correlation of LNM status with all the other explored factors and its different prognosis in the histopathological and molecular markers stratified subgroups analyzed using the χ2 test, KM test, and Cox-regression survival test, respectively. (B–D) The KM survival curves showing the significantly different prognosis of LNM in the tumor site stratified subgroups, rectum (B), left colon (C) and right colon (D).
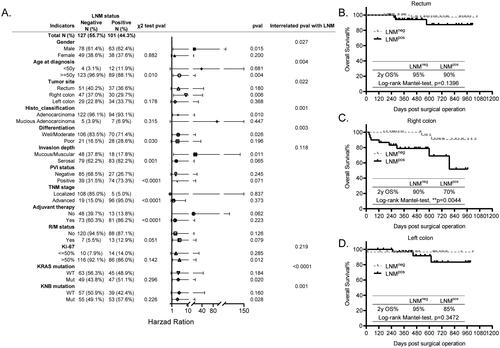
Moreover, although the KM survival analysis showed that the LNM had different prognosis in gender, age, tumor site, histological classification (histo_classification), differentiation, invasion depth, Ki-67 expression, KRAS mutation as well as the KNB mutation stratified subgroups, the interrelated Cox regression analysis of above factors with LNM suggested that the differential prognosis of LNM was significant only in age (p = 0.004), tumor site (p = 0.022), histo_classification (p = 0.001), differentiation (p = 0.003), KRAS mutation (p < 0.0001), and KNB mutation (p = 0.001) stratified subgroups (). Taking the tumor site as an example, the LNM was not a prognostic marker for patients with rectum cancer (, p = 0.1396) and those with left colon cancer (, p = 0.3472), whereas it significantly predicted the OS for patients with right colon cancer (, p = 0.0044). Above all, we propose that the LNM status is an unfavorable prognostic marker specifically in patients who are older than 50 y, with right colon cancer, with adenocarcinoma, with well/moderately differentiated cells, with KRAS or KNB mutation.
The survival prognosis of PVI is remarkably different in age, histological classification, cell differentiation and R/M status stratified CRC subgroups
Similarly, the histological factor PVI has also been implicated as an unfavorable prognostic factor and plays a crucial role in tumor invasiveness and metastasis in CRC [Citation15,Citation16]. Here, we also found that it was significantly associated with cell differentiation (p = 0.001), tumor invasion depth (p < 0.0001), LNM status (p < 0.0001), TNM stage (p < 0.0001), and adjuvant therapy (p < 0.030), suggesting that it was of higher possibility to be positive in patients with poorly differentiated cells, with invasion depth to serosal, with LNMpos, with advanced stage, thus, leading to higher chance to receive adjuvant therapies (), same as its mutually interacted factor LNM indicated above.
Figure 4. Prognosis of PVI in all the other histopathological and molecular markers stratified subgroups. (A) The forest plot showing the correlation of PVI status with all the other explored factors and its different prognosis in the histopathological and molecular markers stratified subgroups analyzed using the χ2 test, KM test, and Cox-regression survival test, respectively. (B,C) The KM survival curves showing the significantly different prognosis of PVI in the differentiation stratified subgroups, well and moderately differentiated (B) and poorly differentiated (C).
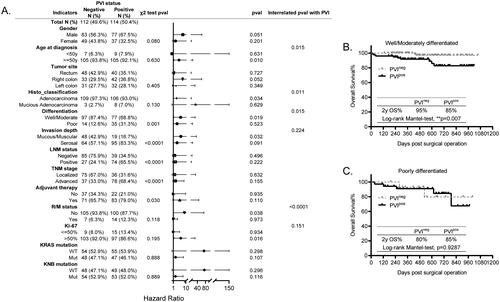
In addition, the KM survival data showed that PVI status appeared to differentially predict the poor survival for patients in age, histo_classification, cell differentiation, tumor invasion depth, R/M status, and Ki-67 expression stratified subgroups. However, further interrelated Cox regression analysis results confirmed that its differential prognosis was significant merely in age, histo_classification, cell differentiation and R/M status, indicating that it was an unfavorable prognostic maker for patients who are older than 50 y, with adenocarcinoma, with well/moderately differentiated cells, and without R/M (). For instance, in the cell differentiation stratified subgroups, the PVIpos predicted poorer OS for CRC patients with well/moderately differentiated cells (, p = 0.007), while it had no prognostic significance in those with poorly differentiated cells (, p = 0.9287). Overall, our results firstly provide evidence supporting the differential prognosis of PVI in specific markers stratified subgroups.
The prognosis of TNM is different in age, tumor site, cell differentiation, R/M status, KRAS mutation as well as KNB mutation stratified CRC subgroups
In our CRC cohort, the TNM stage was closely associated with age (p = 0.002), tumor invasion depth (p < 0.0001), LNM status (p < 0.0001), PVI status (p < 0.0001), and it was also slightly correlated with cell differentiation (p = 0.030), R/M status (p = 0.041), characterized as that the CRC patients with advanced stage are prone to be younger than 50 y, with poorly differentiated cells, with invasion depth to serosal layer, with LNMpos, with PVIpos, and with higher occurrence of R/M, as shown in , therefore, the adjuvant therapy was applied to treat these patients, consistently manifested by its tight correlation with adjuvant therapy (p < 0.0001).
Figure 5. Prognosis of TNM in all the other histopathological and molecular markers stratified subgroups. (A) The forest plot showing the correlation of TNM status with all the other explored factors and its different prognosis in the histopathological and molecular markers stratified subgroups analyzed using the χ2 test, KM test, and Cox-regression survival test, respectively. (B,C) The KM survival curves showing the significantly different prognosis of TNM in the differentiation stratified subgroups, well and moderately differentiated (B) and poorly differentiated (C).
Next, the prognosis of TNM in all the other factors stratified subgroups was explored. The KM results showed that it probably exhibited differential prognosis in age, tumor site, histo_classification, cell differentiation, R/M status, Ki-67 expression, KRAS and KNB mutation stratified subgroups (). Its further interrelated analysis with above factors confirmed that its distinct prognosis was significant in age (p = 0.003), tumor site (p = 0.020), histo_classification (p = 0.001), cell differentiation (p = 0.003), R/M status (p < 0.0001), KRAS mutation (p < 0.0001) as well as KNB mutation (p < 0.036) stratified subgroups (). Taking the cell differentiation stratified subgroups as examples, the TNM stage specifically predicted the unfavorable OS for patients with well/moderately differentiated cells (, p = 0.0019, 2 y OS%: 100% vs 80%), whereas patients with poorly differentiated cells showed 80% of 2 y OS%, regardless of the TNM stage (, p = 0.3293). Above all, in this study, we provide clues indicating that the prognosis of TNM is specifically in CRC patients who are older than 50 y, with right colon, with adenocarcinoma, with well/moderately differentiated cells, without R/M, and with KRAS or KNB mutation.
The prognosis of R/M status is significantly different in age, histological classification, LNM status, TNM stage, Ki-67 expression, KRAS mutation and KNB mutation stratified CRC subgroups
The post-operative occurrence of R/M is always lethal to patients with tumors, however, to our present knowledge, its differential prognosis has not been investigated. Here, we found that its incidence was statistically correlated with the histo_classification (p = 0.016), cell differentiation (p = 0.008), TNM stage (p = 0.041), Ki-67 expression (p = 0.003) as well as KRAS mutation (p = 0.017), as shown in , indicative of higher possibility of R/M occurred in patients with mucious adenocarcinoma, with poorly differentiated cells, with advanced stage, with high expression of Ki-67, and with KRAS mutation.
Figure 6. Prognosis of R/M in all the other histopathological and molecular markers stratified subgroups. (A) The forest plot showing the correlation of R/M with all the other explored factors and its different prognosis in the histopathological and molecular markers stratified subgroups analyzed using the χ2 test, KM test, and Cox-regression survival test, respectively. (B,C) The KM survival curves showing the significantly different prognosis of R/M in the LNM status stratified subgroups, LNM negative (B) and LNM positive (C). (D,E) The KM survival curves showing the significantly different prognosis of R/M in the KRAS mutation stratified subgroups, KRAS wild-type (D) and KRAS mutant (E).
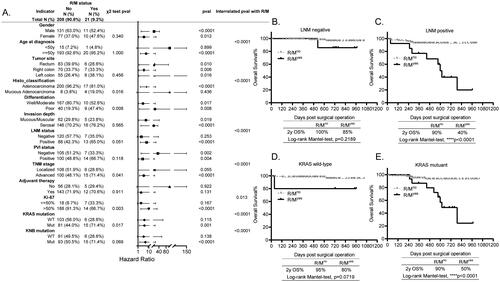
Interestingly, unlike to above prognostic markers, the integrated analyses using the KM survival test and Cox regression interrelation test showed that R/M significantly predicted the poor survival for patients regardless of their gender, the tumor site, cell differentiation, tumor invasion depth, and the PVI status. However, its prognosis was statistically different in age (p < 0.0001), histo_classification (p < 0.0001), LNM status (p < 0.0001), TNM stage (p < 0.0001), Ki-67 expression (p = 0.013), KRAS (p < 0.0001) and KNB mutation (p < 0.0001) stratified subgroups, demonstrating that it specifically predicted poorer survival for patients who are older than 50 y, with adenocarcinoma, with positive LNM, with advanced stage, with high expression of Ki-67, and with KRAS or KNB mutation (). For instance, the 2 y OS% of LNMneg patients with R/M was same as those without R/M (, p = 0.2189), while the LNMpos patients with R/M had significantly less 2 y OS% than those without R/M (, p < 0.0001). Besides, the 2 y OS% of patients with wild-type KRAS (KRASWT) was as long as 90% regardless of the R/M status (, p = 0.0719), however, the incidence of R/M significantly predicted less 2 y OS% for patients with KRASmut (, p < 0.0001). Together, our findings firstly report that the occurrence of R/M in CRC is not always lethal for some subgroups.
KRAS mutation differentially predicts poorer survival for patients in age, histological classification, cell differentiation and LNM status stratified CRC subgroups
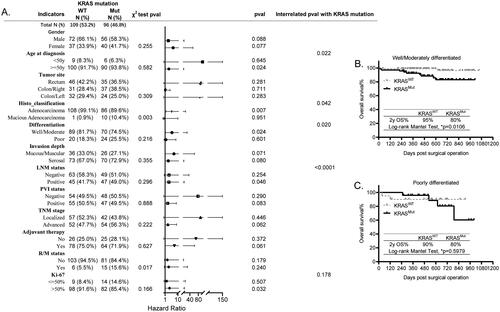
The frequency of KRAS mutation was 46.8% in our study cohort (), which is consistent with its prevalence studied from larger cohorts [Citation10]. Although patients harboring different KRAS mutation variants, including G12 (63.51%), G13 (17.57%), Q16 (5.14%), have been discovered to have distinct prognosis, its mutation is of critical significance in guiding the precise diagnosis and therapy for CRC patients [Citation10]. In this study, we found that it was closely correlated with histo_classification (p = 0.003) and R/M status (p = 0.017), characterized as higher frequency of KRASmut in patients with mucious adenocarcinoma, and with R/M occurrence (). Recent studies have shown that the metastatic CRC patients with KRASmut have higher death rate than those with KRASWT [Citation11]. Here, we further figured out that KRASmut differentially predicted the poorer survival for patients with age older than 50 y (p = 0.022), with well/moderately differentiated cells (p = 0.020), and with positive LNM (p < 0.0001), as shown in . For example, the 2 y OS% of KRASmut patients histologically diagnosed with well/moderately differentiated cells was less than those with KRASWT (, 80% vs 95%, p = 0.0106). However, the 2 y OS% of KRASWT and KRASmut patients with poorly differentiated tumor cells was the same (, p = 0.5979). In summary, our findings not only support previous reports by others, but also further signify the differential prognosis of KRAS in age, cell differentiation and LNM stratified CRC subgroups.
Figure 7. Prognosis of KRAS mutation in all the other histopathological and molecular markers stratified subgroups. (A) The forest plot showing the correlation of KRAS mutation with all the other explored factors and its different prognosis in the histopathological and molecular markers stratified subgroups analyzed using the χ2 test, KM test, Cox-regression survival test, respectively. (B,C) The KM survival curves showing the significantly different prognosis of KRAS mutation in the differentiation stratified subgroups, well/moderately differentiated (B) and poorly differentiated (C).
It is worth noting that, even though the independent prognostic marker Ki-67 expression was found to be associated with R/M occurrence (Figure S3, p = 0.003), and potentially predicted differential prognosis in gender, histo_classification, cell differentiation, PVI status, and TNM stage stratified subgroups, it was not statistically significant in these subgroups (Figure S3), suggesting that its favorable prognosis is common for the overall CRC population.
Discussion
Histopathological factors such as LNM, PVI have been integrated into TNM staging system because of their close association with tumor metastasis, malignancy, relapse and poor prognosis in overall CRC population [Citation3]. Currently, a majority of studies have focused on individual applications of above factors [Citation5,Citation13,Citation16,Citation17]. However, to our present knowledge, no one has reported a comprehensive stratification of prognostic factors in the same study allowing the direct comparisons among different prognostic models. Therefore, in the study, we systematically stratified the prognostic factors by all the other variables to evaluate their differential prognosis in CRC subpopulation by integrating results from KM survival analysis as well as the Cox regression test.
At present, multiple studies are focusing on personalized applications of above well-established prognostic tools in CRC subpopulation [Citation18]. For instance, the Ki-67 expression has been suggested as a prognostic factor in men with CRC [Citation19] and in specific AJCC-8 stages [Citation9]. The PVI is employed to predict the LNM status in T1/2 CRC patients [Citation16]. The LN number and LNRs specifically predict the survival outcomes in T1–4N0M0 (5) and stage III CRC patients [Citation20]. In our study, we found that the histological markers LNM, PVI and TNM stage, which are mutually correlated with each other, all specifically predict poor survival for age, histo_classification and differentiation stratified CRC subgroups, manifested as those with LNMpos or PVIpos, or advanced stage who are older than 50 y, with adenocarcinoma, with well/moderately differentiated cells are prone to have lower 2 y OS% than those with LNMneg or PVIneg or localized stage in above subgroups. Interestingly, our findings reveal that TNM differentially predicts the survival for subgroups similarly identified for LNM and PVI, coincidentally supporting the AJCC8th guideline that it is necessary to integrate LNM and PVI into the TNM staging system for prognosis [Citation14].
The localized recurrence or distant metastasis is generally occurred in approximately 30–40% of CRC patients within five years after initial surgical resection, depending on the stage [Citation21]. However, beyond the TNM stage and its associated factors LNM as well as PVI, our data also suggest that the R/M is significantly associated with Ki-67 expression and KRAS mutation, demonstrated as higher possibility of R/M in patients with low expression of Ki-67 and KRASmut, consistent their independent prognosis in the overall CRC, suggesting that low expression of Ki-67 and KRASmut possibly drive the occurrence of R/M to cause poor survival in overall CRC. More importantly, our data suggest that R/M is not that terrible for patients who are younger than 50 y, with mucious adenocarcinoma, with LNMneg, with localized tumor, with high expression of Ki-67, with mutant KRAS/KNB, which will guide better surveillance for CRC occurrence in the future.
Notably, the frequency of KRASmut is significantly higher in patients with mucious adenocarcinoma, implicating that the pharmaceutic therapies targeting KRASG12/G13 would be promising in treating these patients. Besides, KRASmut is also higher in patients with R/M, implicating that KRASmut inherently recovers the tumor cells at the surgical margin to initiate R/M. However, although it highly occurs in above subgroups, KRASmut shows differential prognosis in CRC patients who are older than 50 y, with well/moderately differentiated cells, with positive LNM. Taken together, our data firstly provide clues implicating more specific roles of KRAS in tumorigenesis and prognosis for patients with CRC.
Conclusions
Above all, there are still some limitations of our study. Firstly, the median follow-up period of our cohort is 1.6 years, therefore, we can only report the 2-year OS rate instead of 5-year OS rate. Secondly, the underlying mechanisms of above meaningful subgroups which will ultimately guide the appropriate targeted therapies are still under investigation. Thirdly, this is a single center study, further validations from multi-centers and larger cohorts are required to warrant our findings. Taken together, our studies at least shed novel insights into precisely applying these routinely tested markers in predicting the survival outcomes in CRC subpopulation, and the underlying mechanisms and precision treatments for these subgroups will guide innovative directions in the study of precision pathology.
Authors’ contributions
Conceptualization and design: Yang, QY, Yuan, Y, Ren, WM; Data curation and analysis: Yuan, Y, Ren, WM, Zhu, JC, Ji, SY; Ethics: Yang, QY, Yuan, Y, Ren, WM; Supervision: Yang, QY; Writing: Yang, QY, Yuan, Y, Ren, WM; Review and approval: all the authors.
Supplemental Material
Download Zip (978.6 KB)Acknowledgments
The authors are grateful to Yining, He from Biostatistics Office of Clinical Research Unit in our hospital for statistical advice. We also thank the executive director Dr. Tianhai, Ji in our department for warm-heart support and encouragement all the time.
Disclosure statement
All the listed authors declare no conflict of interest.
Data availability statement
All the datasets used and/or analyzed in the study are available from the corresponding author on reasonable request.
Additional information
Funding
References
- Dekker E, Tanis PJ, Vleugels JLA, et al. Colorectal cancer. Lancet. 2019;394(10207):1–12. doi: 10.1016/S0140-6736(19)32319-0.
- Xia C, Dong X, Li H, et al. Cancer statistics in China and United States, 2022: profiles, trends, and determinants. Chin Med J (Engl). 2022;135(5):584–590. doi: 10.1097/CM9.0000000000002108.
- Edge SB, Compton CC. The American joint committee on cancer: the 7th edition of the AJCC cancer staging manual and the future of TNM. Ann Surg Oncol. 2010;17(6):1471–1474. doi: 10.1245/s10434-010-0985-4.
- Betge J, Harbaum L, Pollheimer MJ, et al. Lymph node retrieval in colorectal cancer: determining factors and prognostic significance. Int J Colorectal Dis. 2017;32(7):991–998. doi: 10.1007/s00384-017-2778-8.
- Berberoglu U. Prognostic significance of total lymph node number in patients with T1-4N0M0 colorectal cancer. Hepato-gastroenterology. 2004;51(60):1689–1693.
- Cao Y, Deng S, Yan L, et al. Perineural invasion is associated with poor prognosis of colorectal cancer: a retrospective cohort study. Int J Colorectal Dis. 2020;35(6):1067–1075. doi: 10.1007/s00384-020-03566-2.
- Suzuki T, Suwa K, Ogawa M, et al. Adjuvant chemotherapy for the perineural invasion of colorectal cancer. J Surg Res. 2015;199(1):84–89. doi: 10.1016/j.jss.2015.03.101.
- Melling N, Kowitz CM, Simon R, et al. High Ki67 expression is an independent good prognostic marker in colorectal cancer. J Clin Pathol. 2016;69(3):209–214. doi: 10.1136/jclinpath-2015-202985.
- Tong G, Zhang G, Liu J, et al. Cutoff of 25% for Ki67 expression is a good classification tool for prognosis in colorectal cancer in the AJCC8 stratification. Oncology Reports. 2020;43(4):1187–1198.
- Zhu G, Pei L, Xia H, et al. Role of oncogenic KRAS in the prognosis, diagnosis and treatment of colorectal cancer. Mol Cancer. 2021;20(1):143. doi: 10.1186/s12943-021-01441-4.
- Damit D, Patnaik R, Chaw LL, et al. KRAS mutation: characterization and its impact on survival outcome of patients with metastatic colorectal cancer. Front Biosci (Landmark Ed). 2022;27(7):213. doi: 10.31083/j.fbl2707213.
- Luo H, Lu J, Bai Y, et al. Effect of camrelizumab vs placebo added to chemotherapy on survival and Progression-Free survival in patients with advanced or metastatic esophageal squamous cell carcinoma: the ESCORT-1st randomized clinical trial. Jama. 2021;326(10):916–925. doi: 10.1001/jama.2021.12836.
- Steffen P, Li J, Chandra J, et al. Molecular features of lymph node metastasis in T1/2 colorectal cancer from Formalin-Fixed Paraffin-Embedded archival specimens. J Proteome Res. 2021;20(2):1304–1312. doi: 10.1021/acs.jproteome.0c00693.
- Benson AB, Venook AP, Al-Hawary MM, et al. Colon cancer, version 2.2021, NCCN clinical practice guidelines in oncology. J Natl Compr Canc Netw. 2021;19(3):329–359. doi: 10.6004/jnccn.2021.0012.
- Al-Sukhni E, Attwood K, Gabriel EM, et al. Lymphovascular and perineural invasion are associated with poor prognostic features and outcomes in colorectal cancer: a retrospective cohort study. Int J Surg. 2017;37:42–49. doi: 10.1016/j.ijsu.2016.08.528.
- Huh JW, Kim HR, Kim YJ. Lymphovascular or perineural invasion may predict lymph node metastasis in patients with T1 and T2 colorectal cancer. J Gastrointest Surg. 2010;14(7):1074–1080. doi: 10.1007/s11605-010-1206-y.
- Liu L, Liu J, Wang J, et al. Machine learning revealed molecular classification of colorectal cancer with negative lymph node metastasis. Biomarkers. 2022;27(1):86–94. doi: 10.1080/1354750X.2021.2016971.
- Mahar AL, Compton C, Halabi S, et al. Personalizing prognosis in colorectal cancer: a systematic review of the quality and nature of clinical prognostic tools for survival outcomes. J Surg Oncol. 2017;116(8):969–982. doi: 10.1002/jso.24774.
- Lumachi F, Orlando R, Marino F, et al. Expression of p53 and Ki-67 as prognostic factors for survival of men with colorectal cancer. Anticancer Res. 2012;32(9):3965–3967.
- Ren JQ, Liu JW, Chen ZT, et al. Prognostic value of the lymph node ratio in stage III colorectal cancer. Chin J Cancer. 2012;31(5):241–247. doi: 10.5732/cjc.011.10374.
- Walker AS, Johnson EK, Maykel JA, et al. Future directions for the early detection of colorectal cancer recurrence. J Cancer. 2014;5(4):272–280. doi: 10.7150/jca.8871.