
Abstract
Background
To explore the crosstalk between baseline or visit hemoglobin and major adverse cardiovascular and cerebral events (MACCE) in percutaneous coronary intervention (PCI) patients and to construct risk stratification models to predict MACCE amongst these patients.
Materials and methods
We conducted a retrospective cohort in patients undergoing PCI procedures at Beijing Friendship Hospital between January 2013 and December 2020. Multivariate Cox proportional hazards models were employed for data analyses. The composite MACCE was the primary endpoint and we used machine learning algorithms to evaluate risk factors associated with MACCE. Model performance was measured using Brier scores and receiver-operating characteristic curves. The association between risk factors and MACCE probability was examined using partial dependency plots.
Results
8,298 PCI-treated patients were enrolled in the study. 1,919 of these patients had anemia. During a four-year median follow-up period, 1,636 patients (19.71%) had MACCE. The visit hemoglobin and hemoglobin change was associated with higher risk of MACCE respectively (visit hemoglobin: hazard ratio [HR]: 0.98; 95% confidence interval [CI]: 0.98–0.99; p < 0.001; hemoglobin change: HR: 0.99; 95%CI: 0.98–0.99; p < 0.001). Gradient Boosting (GB) was the BPM, with a mean C-statistic value of 0.78 (95% CI: 0.76–0.80) for predicting MACCE (Brier score: 0.26). The best indicator for MACCE was a low estimated glomerular filtration rate [eGFR] (71 mL/min/1.73m2) at admission, followed by a high serum HbA1c (6.6%) level. A simple risk tree successfully classified patients (17–40.5%) with increased risks of MACCE. The high- vs. low-risk HR for MACCE was 2.04 (95% CI: 1.48–2.82).
Conclusions
Visit hemoglobin and long-term hemoglobin changes were more predictive of MACCE risk than baseline hemoglobin levels. Our findings indicated that increasing hemoglobin levels might improve the long-term prognosis of anemia patients. We established a new risk stratification model for MACCE, which may more efficiently prioritize targeted screening for at-risk anemic patients undergoing PCI.
KEY MESSAGES
Visit hemoglobin and long-term hemoglobin changes predicted the risk of MACCE better than baseline hemoglobin.
Patients with anemia will benefit from increasing hemoglobin levels.
A new risk stratification model for MACCE was established to identify at-risk anemic patients undergoing PCI.
Introduction
Anemia is a major global public health burden. It affects about 32.9% of the world’s population, particularly young children, the elderly, and menstruating or pregnant women. This pathological condition gradually reduces physical performance and increases morbidity and mortality in patients [Citation1]. Additionally, the average prevalence of anemia among older adults is approximately 17%, but these numbers are significantly higher for older patients admitted to nursing homes (47%) or hospitals (40%) [Citation2]. The prevalence of anemic conditions varies from 10% to 43% at the time of hospitalization amongst acute coronary syndrome (ACS) patients. Anemic patients also have increased rates of comorbidities compared to their non-anemic counterparts [Citation3]. Previous clinical investigations have identified anemia as an independent risk factor for coronary heart disease (CHD) and other cardiovascular diseases [Citation4,Citation5].
Percutaneous coronary intervention (PCI) therapy is an effective approach to treating CHD pathology in a non-surgical manner. However, prior risk assessment is a critical part of selecting CHD patients for PCI to improve prognosis and outcomes. Notably, post-PCI systemic inflammation can lead to serious damage to the endothelial lining, promoting coronary stenosis (CS) in certain patients [Citation6]. Interestingly, clinical trials have shown a significant correlation between anemia and the prognosis of PCI-treated CHD patients, regardless of the type of stent implantation or percutaneous transluminal coronary angioplasty (PTCA) procedure. Indeed, previous studies have shown that anemic patients experience worse outcomes after PCI.
The different levels of hemoglobin value, even amongst patients without anemia, might influence long-term outcomes. Some studies have shown low baseline hemoglobin levels are associated with worse outcomes following PCI for patients with both stable coronary artery disease and ACS. However, other studies that have accounted for confounding variables have not found any significant associations between low hemoglobin levels and outcomes [Citation7]. 1 g/L decreases in discharge hemoglobin and 2-year mortality was significantly increased by 1.02-fold [Citation8]. However, most previous studies have focused on the presence of anemia at the time of admission or discharge, and little is known about longer-term hemoglobin changes amongst patients who undergo PCI.
Despite the reportedly high risk of treatment failure in CHD patients with anemia who undergo PCI, very few attempts have been made to determine potential risk factors or ways to improve prognosis. Considering the pathomechanistic complexity of the disease, machine learning (ML) methods might offer additional advantages in revealing therapeutic targets for this disease. Additionally, ML-based clinical models can take multiple high-dimensional variables and non-linear models into account when predicting diagnosis and therapeutic response for anemic CHD patients [Citation9].
Therefore, we conducted the present analysis to comprehensively assess the clinical impact of the levels change of hemoglobin on long-term MACCE risk after PCI. We also employed an ML approach to construct reliable models for predicting MACCE in PCI-treated CHD patients with anemia and risk-stratified these patients.
Materials and methods
Participants and data collection
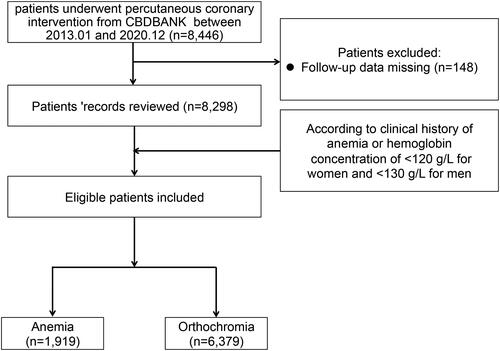
All participants were registered in the PCI study at Beijing Friendship Hospital (BF-PCI: NCT05728580), and their corresponding demographics information and procedural, clinical, and angiographic records were carefully collected from the Cardiovascular Center Beijing Friendship Hospital Database Bank (CBDBANK). Follow-up data collection was conducted by an experienced clinical researcher at 6-month and 12-month time points either via teleconference or in-person visits. From the second year onwards, patients were followed up once a year. All relevant adverse events (AE) before admission were recorded in the CBDBANK. Patients’ demographics, angiographic characteristics, blood work, and cardiovascular risk factors were collected from corresponding electronic medical records (EMRs). The study protocol was aligned with the Declaration of Helsinki. As this was a retrospective study, the Beijing Friendship Hospital Medical Ethics Committee approved the study and waived the requirement of informed consent. To maximize the protection of patients’ rights and interests, however, we also got verbal informed consent from all subjects during follow-up visits. illustrates the patient selection procedure.
Figure 1. Flowchart of the patient selection process.
CBDBANK: Cardiovascular Center Beijing Friendship Hospital Database Bank.
Clinical classification of hemoglobin disorders
The WHO guidelines refer to anemia as a physiological abnormality defined as a hemoglobin level <13.0 g/dL for men and <12.0 g/dL for women at indexing hospitals. Orthochromia suggests the absence of any clinical or laboratory symptoms of anemia. Patients were further categorized by their hemoglobin levels, with those with hemoglobin levels ranging from 9.0–12.0g/dL or <13.0 g/dL, respectively, for women and men being classified as mild anemia; those with hemoglobin levels <9.0 g/dL being classified as moderate-to-severe anemia; and those with physiological hemoglobin levels being classified as orthochromia. Hemoglobin levels were measured on admission and at the time of follow-up visit. Patients with ≥2 serial hemoglobin measurements with ≥4 weeks between both measurements were included in the final analysis.
Clinical outcomes
AE-related information was collected from the CBDBANK for each of the study subjects. The primary endpoint was set as a composite of multiple MACCE items, including all-cause death, revascularization, stroke, myocardial infarction (MI), or heart failure (HF)-related hospitalization.
Model development
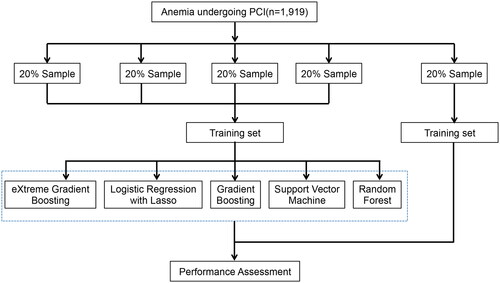
A five-fold cross-validation method was applied to establish stratified validation and derivation cohorts (). Subjects were randomly allotted to five different subsets with a similar event rate. Of these, four subsets were combined to construct the derivation cohort, while the remaining one subset was designated as the validation cohort, and the whole process was recapitulated five times for each outcome study to obtain statistical significance for risk assessment scores for all participants. Fifty-four variables were included in this model, were analyzed using various ML approaches such as Gradient Boosting (GB), Lasso regression (LR), su-pport vector machine (SVM), random forest (RF), and extreme gradient boosting (XGBoost).
Figure 2. Analysis flow for the development and evaluation of models.
Model discrimination was calculated using C-statistics or area under the curve (AUC) in the receiver operating characteristic (ROC) curve. The best-performing model (BPM) was selected, according to the highest AUC value and was used further analysis. The accuracy of the prediction capacity of the BPM was determined by the Brier score (which ranges from 0 to 1.00, where 0 represents the best possible calibration). A mean risk score was calculated using the calibration plot for a given decile of predicted risks.
The LR model determined the rank order of selected variables based on their importance using a standard statistical procedure. One additional variable was added at each iteration to calculate the maximum likelihood ratio between those variables. p < 0.05 was set to select a variable with the largest maximum likelihood. The process was repeated until no variables scored at a significant p-value. In the RF model, variables were ranked for importance by their mean decrease in accuracy. GB estimated the importance of any variable by the number of tree branches in it. Each variable was then tested to see how well it fir to BPM. To avoid overfitting, cross-validation was applied during model discrimination, where a good fit exhibited a narrow confidence interval. The variable importance of a model was calculated on all data points, and the absence of overfitting was ensured by cross-validation. Selected variables were ranked by their importance and were evaluated by gradual increment in the 5-fold cross-validation dataset. There could have been an overestimation of the gain for each variable, but the final values did match to corresponding cross-validation results. The accuracy of the derived risk tree in predicting the low, intermediate, and high-risk group patients for MACCE were tested by classifying patients into different risk groups based on their decision tree. 95% Confidence intervals (CIs) and hazard ratios (HRs) between different risk groups were determined and compared. For the important variables, the relationship between the variables and four-year MACCE probabilities in the BPM was visualized using the partial dependency plot, which is a useful tool to improve a model’s interpretability. The partial dependency plot was generated by calculating the marginal effect of a variable of interest on the outcome and integrating out the effects of all other variables. The average probabilities of four-year MACCE were calculated at different values of a variable, which were traced using locally estimated scatterplot smoothing curves.
Sensitivity analysis was conducted for the total cohort in this trial, and models were developed for predicting MACCE for this study population.
Statistical analysis
The sample size calculation was based on estimates for mean 5-year follow-up rates for the composite primary endpoint of MACCE. A previous study reported that the rate of MACCE was 37.3% at five years [Citation10]. We set the alpha risk to 0.05 and the power to 80%, and determined that at least 1,534 patients were needed to detect a difference of 5% in MACCE at five years.
Continuous variables are presented as mean ± standard deviation (mean ± SD) or median (interquartile range, IQR), and were compared using Wilcoxon rank-sum tests or Student’s t-tests, as appropriate. Categorical variables are presented as counts (n) and percentages (%) and were compared using chi-squared (χ2) or Fisher’s exact tests. Kaplan-Meier (KM) survival curve and the log-rank test were applied to calculate the differences between curves. A multivariate Cox proportional hazards (MCPH) model was used to determine HRs for outcomes in anemic patients compared to their non-anemic (or orthochromatic) counterparts after adjusting for age, gender, F/H coronary artery disease (CAD), chronic HF, hypertension, hyperlipidemia, chronic kidney disease (CKD), diabetes mellitus (DM), prior stroke, diseased vessels, stent number, and medications (including aspirin, angiotensin-converting enzyme inhibitor (ACEI)/angiotensin receptor blockers (ARB), β-blockers, and/or statins). To confirm model stability, highly collinear variables were excluded from the final analysis. To minimize the influence of other confounders on the outcome, we used a propensity score matching (PSM) to match anemia with orthochromia. Patients with anemia were matched in a 1:1 ratio with orthochromic patients using the nearest neighbor matching and based on age, gender, BMI, MI, chronic HF, hypertension, hyperlipidemia, CKD, DM, prior stroke, peripheral arterial disease, diseased vessels, aspirin, clopidogrel, ticagrelor, ACEI/ARB, β-blockers, statins, total cholesterol (TC), low-density lipoprotein (LDL-C), triglycerides (TG), high-density lipoprotein (HDL-C), glucose, White blood cells (WBC), systolic blood pressure (SBP), diastolic blood pressure (DBP), heart rate, and estimated glomerular filtration rate (eGFR). Between-group balance in baseline characteristics before and after matching was assessed by absolute standardized differences, and the results were presented as a Love plot. An absolute standardized difference of 0% would indicate no residual bias and a difference of 10% would indicate inconsequential bias (Figure S1). Before calculating HR, MCPH values were graphically verified for each model by plotting log hazard vs. time for anemia and orthochromatic patients. Each set of plotted lines was then evaluated to ensure the maintenance of the same vertical distance each time. To evaluate the impact of time on hemoglobin levels and outcomes, we built a multivariate Cox model with restricted cubic splines, defined by three knots at the 5th, 50th, and 95th percentiles. The time point with the lowest HR was set as the threshold. A 95% confidence interval (CI) was derived using bootstrap resampling. All tests included a two-tailed p < 0.05 for significance. Analyses were performed using R (v3.6.3) and Python.
Results
Baseline characteristics
A total of 8,298 patients were eligible for the study. 1,919 of these patients (23.13%) had anemia (). The median (IQR) at follow-up was 4.0 (range: 2.1–5.9) years for all subjects. A total of 1,636 patients (19.71%) had MACCE. The baseline laboratory, angiographic, and clinical features of this cohort in the pre-match and post-match samples are described in . Relative to the orthochromatic group, anemic patients were mostly females and elderly. Prevalence rates of hypertension (72.66 vs. 66.58%, p < 0.001), DM (46.00 vs. 34.00%, p < 0.001), peripheral arterial diseases (9.41 vs. 6.12%, p < 0.001), prior stroke (19.02 vs. 13.81%, p < 0.001), CKD (7.69 vs. 1.88%, p < 0.001) and chronic HF (1.35 vs. 0.33%, p < 0.001) were significantly higher amongst anemic patients. DBP, WBC, platelet count, TC, LDL-C, and TG levels, as well as the eGFR, were significantly lower in anemic patients, while creatinine (Cr) and HDL-C levels were significantly higher in this group. Anemic patients were more likely to be taking calcium channel blockers (CCBs), low-dose aspirin, or β-blockers. There were a relatively higher number of individuals with left main and 3-vessel disease in the anemia group. In the post-match model, between-group differences in all variables were reduced and were not statistically significant.
Table 1. Baseline characteristics of patients in the pre-match and post-match samples.
Cardiovascular events and anemia
After PSM, the KM curves amongst anemic patients for MACCE (p = 0.047), all-cause mortality (p = 0.002), non-cardiac death (p = 0.006), and HF-related hospitalization (p = 0.049) were significantly higher than those in orthochromatic patients (Figure S2). After adjusting for covariates, including age, gender, F/H CAD, chronic HF, hypertension, hyperlipidemia, CKD, DM, prior stroke, diseased vessels, stent number, and medications (including aspirin, ACEI/ARB, β-blockers and/or statins), the risk of MACCE (HR: 1.16; 95%CI: 1.03–1.3; p = 0.01), all-cause mortality (HR: 1.64; 95%CI: 1.36–1.97; p < 0.001), cardiac death (HR: 1.52; 95%CI: 1.20–1.91; p < 0.001), and non-cardiac death (HR: 1.97; 95%CI: 1.44–2.70; p < 0.001) were elevated in the anemia group (Table S1). After controlling for all covariates using a PSM approach, anemia remained a significant predictor for MACCE (HR: 1.19, 95% CI: 1.03–1.38, p = 0.020), all-cause mortality (HR: 1.49; 95%CI: 1.18–1.88; p = 0.001), cardiac death (HR: 1.38; 95%CI: 1.03–1.85; p = 0.033), non-cardiac death (HR: 1.76; 95%CI: 1.19–2.60; p = 0.004) and HF-related hospitalization (HR: 1.60; 95%CI: 1.07–2.39; p = 0.021; Table S1).
Association between hemoglobin levels and MACCE
Additional hemoglobin data at follow-up were available for a subset of 6,800 subjects, most of whom were not anemic at baseline and at follow-up. The presence of anemia at the time of follow up (HR: 0.98; 95%CI: 0.98–0.99; p < 0.001; ) and the amount of change in hemoglobin levels (HR: 0.99; 95%CI: 0.98–0.99; p < 0.001; ) increased the risk of MACCE. Dose-response relationships between baseline and follow-up visit hemoglobin levels and MACCE risk were shown in . Low baseline hemoglobin levels were associated with a higher risk of MACCE with hemoglobin under 125 g/L in female patients, whereas the risk of MACCE was increased regardless of hemoglobin levels in male patients. When patients had the same relative of hemoglobin levels, males had a higher risk of MACCE than female patients (). Next, to evaluate the effect of the degree of anemia on MACCE, the patients were subdivided into the orthochromia, mild anemia, and moderate-to-severe anemia groups. KM estimates for the MACCE in anemia at baseline, follow-up visit, and change were significantly different across these groups (p < 0.001, ). After covariate adjustment, moderate-to-severe anemia at baseline was associated with a higher risk of MACCE (HR: 2.62; 95%CI: 1.57–4.37; p < 0.001; ). We found that lower follow-up visit hemoglobin could also predict the risk of MACCE (mild anemia: HR: 1.58; 95%CI: 1.39–1.80; p < 0.001; moderate-to-severe anemia: HR: 3.24; 95%CI: 2.26–4.65; p < 0.001; ). In terms of long-term hemoglobin changes, the risk of MACCE was significantly higher when hemoglobin levels decreased more (HR: 0.99; 95%CI: 0.98–0.99; p < 0.001; ). With regard to changes in hemoglobin levels, persistent moderate-to-severe anemia from baseline to follow-up visit increased the risk of MACCE (HR: 6.46; 95%CI: 3.17–13.19, p < 0.001; ), to the same degree as persistent mild anemia (HR: 1.50; 95%CI: 1.27–1.77, p < 0.001). The risk of MACCE was increased from mild at baseline to severe anemia at visit (HR: 2.91; 95%CI: 1.81–4.67, p < 0.001). We also found that visit hemoglobin levels and long-term hemoglobin changes had higher c-indices for MACCE when compared with baseline hemoglobin (p < 0.001, Table S2).
Figure 3. Associations of hemoglobin and MACCE.
Restricted cubic spline models with three knots were constructed to display the association between hemoglobin concentrations as continuous variables and the HR of adverse cardiovascular events according to gender. The dotted lines indicate 95% confidence intervals. Restricted cubic spline models for (A) baseline hemoglobin, (B) visit hemoglobin. Unadjusted Kaplan-Meier curves during follow-up for (C) baseline hemoglobin, (D) follow-up visit hemoglobin, (E) hemoglobin changes. (F) Risk stratification for anemic patients undergoing PCI was established based on eGFR and HbA1c. Each node is based on the available data from the patients for each predictive variable. MACCE: major adverse cardiovascular and cerebral events; eGFR: estimated glomerular filtration rate; PCI: percutaneous coronary intervention; HR: hazard ratio.
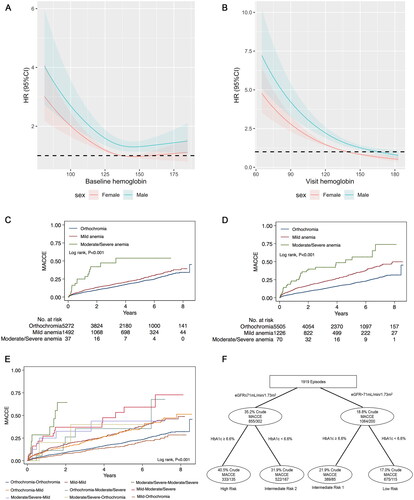
Table 2. Hazard ratios for primary outcomes in patients with PCI according to baseline and visit haemoglobin analysed as categorical and continuous variable.
ML for predicting outcomes
The results of five analytical methods are presented in . GB had the best performance, with the most significant C-statistic value of 0.78 (95%CI: 0.76–0.80) for MACCE, which was in contrast to the LR model with a C-statistic value of 0.66 (95%CI: 0.62–0.69).
Table 3. Results of the prediction models for MACCE in patients with PCI with anemia.
All final models were calibrated for prediction accuracy such that the model for predicting MACCE had a mean Brier score of 0.26, a resolution of 0.018, and a reliability of 0.001. A Brier score of nearly 0 (and similar resolution and reliability) denotes better calibration in measurements (Figure S3).
Predictor variables and partial dependency plots
GB and C-statistics were used for ranking the variables by their importance to add to the prediction model for MACCE (Table S3). Levels of eGFR and HbA1c, as well as hyperlipidemia-linked variables, were potentially high predictors of MACCE. Furthermore, Cr levels and platelet counts were highly predictive of MACCE.
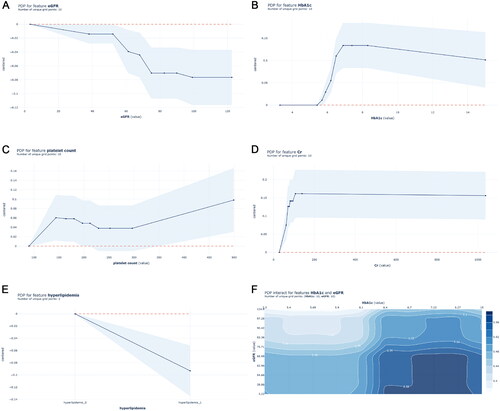
Partial dependency plots, which show the adjusted relationship of variables with the outcome, were generated from the main GB model (). In the partial dependency plot, the probability of MACCE was significantly higher with eGFR less than 52 ml/min/1.73m2. The probability of MACCE also decreases as eGFR increases. When eGFR increases to 71 ml/min/1.73m2, the probability of MACCE remains stable (). The probability of MACCE rapidly increases when HbA1c approaches 6.0%, and remains high when HbA1c exceeds 6.6% (). Hyperlipidemia is associated with an increased probability of MACCE (). In terms of Cr levels, the MACCE probability gradually increases under approximately 200 μmol/L. The influence of Cr level on the probability of MACCE is similar when the Cr level goes beyond 200 μmol/L (). Higher platelet counts were also associated with increased probabilities of MACCE beyond 300 × 10^9/L (). Considering the interaction between eGFR and HbA1c on the probability of MACCE, and as the results in show, the probability of MACCE was the highest (reaching up to 58%) when eGFR was less than 71 ml/min/1.73m2 and HbA1c was more than 6.6%.
Figure 4. Partial dependency plots of top five important risk factors in the GB model.
Partial dependency plots were generated from the GB models, which show the adjusted relationship between each variable and the predicted probabilities of MACCE: (A) eGFR, (B) HbA1c, (C) platelet count, (D) Cr level, (E) hyperlipidemia, (F) eGFR & HbA1c. GB: Gradient Boosting; MACCE: major adverse cardiovascular and cerebral event; eGFR: estimated glomerular filtration rate; Cr: Creatinine.
Risk stratification for anemic patients undergoing PCI
We then established risk stratification using top-ranking predictors of MACCE. The GB method identified an eGFR level of 71 mL/min/1.73m2 or lower as the best discriminator between MACCE and non-MACCE subjects. The next important indicator of MACCE in both the higher and lower eGFR nodes was HbA1c at a discrimination level of >6.6%. depicts the final tree generated by the decision tree, along with the MACCE data for each branch node, which stratified patients into four risk groups: high-risk (eGFR level ≤71mL/min/1.73m2 & HbA1c ≥6.6%), intermediate risk-1 (eGFR level >71mL/min/1.73m2 & HbA1c ≥6.6%), intermediate risk-2 (eGFR level ≤71mL/min/1.73m2 & HbA1c <6.6%), and low-risk (eGFR level >71mL/min/1.73m2 & HbA1c <6.6%). The MACCE HR between the high- and low-risk groups was 2.04(95%CI: 1.48–2.82; ). Also, significant differences in MACCE risk score were detected between all risk groups, the except low-, intermediate risk- 1, and 2 groups ().
Table 4. MACCE between risk groups.
Discussion
We demonstrated that follow-up visit hemoglobin and long-term hemoglobin changes were more predictive of MACCE risk than baseline hemoglobin levels. The GB model was the BPM for predicting MACCE in anemic patients receiving PCI. The best single predictors for MACCE were low eGFR and high HbA1c levels.
Anemia and MACCE
Anemia has been shown to lead to unfavorable outcomes in ACS [Citation11] and chronic HF patients [Citation12]. The causes of anemia in patients with cardiovascular disease are very sophisticated and have not been fully elucidated. The decreased oxygen-carrying capacity of hemoglobin under anemic conditions is a critical modifier in vascular diseases and can exacerbate hypoxic lung symptoms, pulmonary vascular diseases, HF, and coronary/systemic atherosclerosis [Citation13]. It has been shown that hypoxia can induce vascular inflammation via the hypoxia signaling pathway [Citation14,Citation15]. Low grade inflammation is one of the important reasons for anemia leading to cardiovascular disease progression. Both inflammatory cytokines and hepcidin (master regulators of iron metabolism) can inhibit iron absorption, resulting in iron-deficient erythropoiesis [Citation16,Citation17]. It has been shown that PCI treatment can cause acute-phase reactions and systemic inflammation, while persistent inflammation can induce atherosclerosis [Citation18–21]. Hemorrhage is also a common cause of anemia in patients with PCI. Due to the increased risk of bleeding associated with standard dual antiplatelet therapy (DAPT) after PCI, anemia is an important bleeding risk assessment factor. Therefore, it is particularly crucial for anemic patients with PCI to balance the risk of antithrombotic therapy and bleeding with the benefit of reducing adverse events. Previous studies have found that a very short (≤3 months) duration of dual antiplatelet therapy (VSDAPT) significantly decreased the odds of MACCEs and major bleeding by 17% and 29%, respectively, without increasing ischemic events [Citation22]. Another meta-analysis reported that abbreviated DAPT significantly reduced major bleeding by 43% [Citation23]. The GLOBAL LEADERS study compared the efficacy and safety of ticagrelor combined with aspirin for one month, followed by a single drug treatment of ticagrelor for 23 months after implantation of drug-eluting stents, and aspirin combined with clopidogrel or ticagrelor for 12 months before receiving aspirin alone for 12 months. The patients were followed up for two years. The results showed that, compared with the traditional DAPT control group, the ticagrelor monotherapy group had a trend in reduced main composite endpoint, and that overall safety was satisfactory [Citation24]. The TWILLIGHT study compared the safety and effectiveness of DAPT (ticagrelor + aspirin) followed by ticagrelor monotherapy after three months of ticagrelor + aspirin in high-risk patients after PCI. The results of this study showed that monotherapy significantly reduced the risk of bleeding compared to DAPT and did not increase the risk of ischemia [Citation25]. Thus, VSDAPT could be well tolerated and feasible after PCI with drug-eluting stents. We used discharge drugs in our analysis. Due to patients’ memory biases, the use of dual antiplatelet drugs during the follow-up period could not be accurately obtained. In the future prospective study, we will further clarify the impact of dual antiplatelet therapy adjustment on the prognosis of anemia patients with PCI.
Hemoglobin status and MACCE
Hemoglobin is an important factor in evaluating anemia. Its function is to transport oxygen throughout the body and then expel carbon dioxide from the body. Low haemoglobin concentrations have been associated with increased mortality in patients with angina and MI [Citation26]. The associations of lower admission hemoglobin levels with increased odds of hematoma expansion mediating worse outcomes after intracerebral hemorrhage have also been shown [Citation27]. In ACS patients, even moderate anemia (hemoglobin: 10.0–12.0g/dL) could lead to a higher mortality rate compared to patients with normal hemoglobin levels [Citation28,Citation29]. Currently, most studies focus on the admission hemoglobin level [Citation30]. There are also a few studies that have shown a significant correlation between hemoglobin levels at the time of hospital discharge and the prognosis of heart disease patients [Citation8]. However, other studies have shown that hemoglobin is a not associated with disease prognosis [Citation31]. Our study found no significant correlation between baseline hemoglobin and MACCE, but long-term follow-up visit hemoglobin was significantly associated with prognosis. Changes in hemoglobin levels were also significantly correlated with prognosis. Hemoglobin levels increased during follow-up in patients with baseline severe anemia could improve outcomes. Decreases in hemoglobin during follow-up may be related to poor prognosis. Therefore, increasing hemoglobin levels and the recovery of anemia status may improve the patients’ long-term prognoses ().
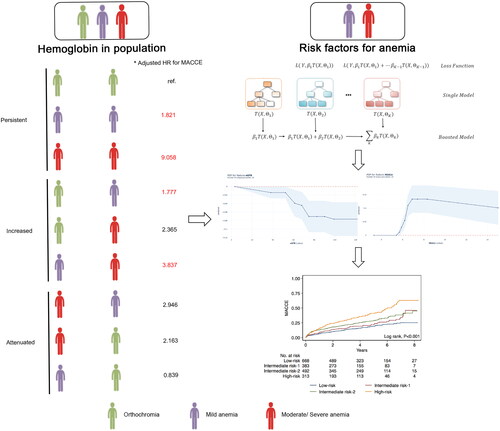
Figure 5. Graphical summary of study findings.
*Adjusted for age, gender, F/H CAD, diabetes mellitus, hypertension, hyperlipidaemia, chronic heart failure, CKD, prior stroke, aspirin, β-blockers, ACEI/ARBs, statins, diseased vessels, and stent number. Red hazard ratio indicates a P-value <0.05. MACCE: major adverse cardiovascular and cerebral events; CAD: coronary heart disease; CKD: chronic kidney disease; ACEI/ARBs: angiotensin-converting enzyme inhibitor/angiotensin receptor; HR: hazard ratio; PDP: partial dependency plots; eGFR: estimated glomerular filtration rate.
Risk stratification
We showed that eGFR and HbA1c levels could effectively stratify the risk of MACCE in anemic patients treated with PCI (). Deterioration of renal function is a crucial factor leading to anemia (and is termed renal anemia). The main causes of renal anemia are the reduction of erythropoietin and malnutrition anemia caused by bone marrow erythropoiesis environment destruction. At the same time, the shortening of red blood cell life and hemolysis can lead to the occurrence or aggravation of anemia [Citation32]. Contrast-induced nephropathy (CIN) is one of the most common complications associated with coronary angiography and PCI. For patients with normal renal function (GFR≥ 60 ml/min/1.73m2), the incidence of CIN is about 5.2%, and dialysis rarely required in these cases (0.07%). In contrast, patients with GFR≤ 30 ml/min/1.73m2 suffered from morbidity of CIN as high as 26.6%, of which 4.3% required dialysis [Citation33]. To reduce PCI-related renal dysfunction, early detection of CNI risk factors can prevent renal function deterioration. A previous study indicated that H2FPEF scores might predict the development of CIN in patients presenting with ACS and undergoing PCI [Citation34]. Hypomagnesemia was also associated with an increased risk for CIN [Citation35]. Therefore, it will be important to strengthen the monitoring and treatment of renal function, interrupt the vicious cycle of renal insufficiency and anemia, and improve prognosis in anemia patients who are receiving PCI. We also found that the HbA1c level was another potential predictor of MACCE risk. Anemia was more common in DM patients than in non-diabetic subjects. Thus, DM patients who also have anemia might be at increased risk of AEs from diabetic retinopathy (DR) and neuropathy (DN), as well as cardiovascular diseases. The etiopathology of anemia in DM is multifactorial and involves inflammation, concomitant autoimmune diseases, malnutrition, hormonal changes, drugs, and kidney diseases [Citation36]. For patients with higher HbA1c levels, drug treatment may have an impact on prognosis. Aydınyılmaz et al. [Citation37] found that ticagrelor was superior in terms of angiographic parameters regardless of diabetes, and clopidogrel efficiency was found to be lower than ticagrelor, especially in patients with no-reflow and higher HbA1c levels. Our study suggests that HbA1c can effectively predict the risk of MACCE in anemia patients with PCI. To reduce the impact of medication on outcomes, we adjusted the medication and found that higher HbA1c levels were still associated with the risk of MACCE.
Limitations
Our study had several limitations. First, as a retrospective cohort study, our results could be affected by other variables that were not considered in these analyses. Second, the number of patients with severe anemia in the clinical practice was statistically small, and might represent a selection bias. Third, due to its observational nature and relatively moderate sample size, the results should be re-evaluated in larger samples with random trials. Finally, our findings were limited to the PCI population in a specific Asian population and cannot be extended to other populations.
Conclusions
Follow-up visit hemoglobin and long-term hemoglobin changes were most predictive of prognosis PCI-patients. Increasing hemoglobin levels may improve the long-term prognosis of anemia patients. A new risk stratification model for MACCE was also constructed based on GB model to identify high-risk patients in comorbid PCI and anemia. Patients with eGFR levels ≤71mL/min/1.73m2 & HbA1c ≥6.6% had a higher risk of MACCE than others.
Authors’ contributions
BB. K, AD. S and H. Q contributed to the study conceptualization, experiment design, and manuscript writing. BB. K, AD. S, H. Q, and WP. L collected and analyzed the data. RC. G, ZZ. Z and Y. X were responsible for the machine-learning algorithms and their training. BB. K, AD. S, H. Q, H. C, WP. L, and HW. L provided the critique, data analysis, manuscript writing, and study supervision. WP. L and HW. L. approved the final version of the manuscript for submission. All authors have contributed to the manuscript and approved the submitted version.
Disclosure statement
The authors report no conflicts of interest.
Data availability statement
Data sharing is not applicable–no new data were generated.
Additional information
Funding
References
- Chaparro CM, Suchdev PS. Anemia epidemiology, pathophysiology, and etiology in low- and Middle-income countries. Ann N Y Acad Sci. 2019;1450(1):1–14.
- Marton I, Agócs S, Babik B. Epidemiology of anemia. Orv Hetil. 2020;161(37):1569–1573. doi: 10.1556/650.2020.31916.
- Stucchi M, Cantoni S, Piccinelli E, et al. Anemia and acute coronary syndrome: current perspectives. Vasc Health Risk Manag. 2018;14:109–118. doi: 10.2147/VHRM.S140951.
- Sarnak MJ, Tighiouart H, Manjunath G, et al. Anemia as a risk factor for cardiovascular disease in the atherosclerosis risk in communities (ARIC) study. J Am Coll Cardiol. 2002;40(1):27–33. doi: 10.1016/s0735-1097(02)01938-1.
- Muzzarelli S, Pfisterer M; TIME Investigators. Anemia as independent predictor of major events in elderly patients with chronic angina. Am Heart J. 2006;152(5):991–996. doi: 10.1016/j.ahj.2006.06.014.
- Ma J, Liu X, Qiao L, et al. Association between stent implantation and progression of nontarget lesions in a rabbit model of atherosclerosis. Circ Cardiovasc Interv. 2021;14(11):e010764.
- Soh RY, Sia CH, Djohan AH, et al. Clinical characteristics and Long-Term outcomes of patients with differing haemoglobin levels undergoing Semi-Urgent and elective percutaneous coronary intervention in an asian population. Front Cardiovasc Med. 2022;9:687555. doi: 10.3389/fcvm.2022.687555.
- Gao M, Zhang X, Qin L, et al. Discharge hemoglobin association with Long-Term outcomes of ST-Elevation myocardial infarction patients undergoing primary percutaneous coronary intervention. Cardiovasc Ther. 2020;2020:8647837. doi: 10.1155/2020/8647837.
- Mortazavi BJ, Downing NS, Bucholz EM, et al. Analysis of machine learning techniques for heart failure readmissions. Circ Cardiovasc Qual Outcomes. 2016;9(6):629–640. doi: 10.1161/CIRCOUTCOMES.116.003039.
- Mohr FW, Morice MC, Kappetein AP, et al. Coronary artery bypass graft surgery versus percutaneous coronary intervention in patients with three-vessel disease and left main coronary disease: 5-year follow-up of the randomised, clinical SYNTAX trial. Lancet. 2013;381(9867):629–638. doi: 10.1016/S0140-6736(13)60141-5.
- Manfredini R, Fabbian F, Manfredini F, et al. Takotsubo cardiomyopathy and summer: a dangerous liaison? Am Heart J. 2013;165(1):e5. doi: 10.1016/j.ahj.2012.10.011.
- Savic-Radojevic A, Pljesa-Ercegovac M, Matic M, et al. Novel biomarkers of heart failure. Adv Clin Chem. 2017;79:93–152.
- Weiss G, Ganz T, Goodnough LT. Anemia of inflammation. Blood. 2019;133(1):40–50. doi: 10.1182/blood-2018-06-856500.
- Eltzschig HK, Carmeliet P. Hypoxia and inflammation. N Engl J Med. 2011;364(7):656–665. doi: 10.1056/NEJMra0910283.
- Taylor CT, Colgan SP. Regulation of immunity and inflammation by hypoxia in immunological niches. Nat Rev Immunol. 2017;17(12):774–785. doi: 10.1038/nri.2017.103.
- Ganz T. Anemia of inflammation. N Engl J Med. 2019;381(12):1148–1157. doi: 10.1056/NEJMra1804281.
- Lanser L, Fuchs D, Kurz K, et al. Physiology and inflammation driven pathophysiology of iron Homeostasis-Mechanistic insights into anemia of inflammation and its treatment. Nutrients. 2021;13(11):3732. doi: 10.3390/nu13113732.
- Hansson GK. Inflammation, atherosclerosis, and coronary artery disease. N Engl J Med. 2005;352(16):1685–1695.
- Wolf D, Ley K. Immunity and inflammation in atherosclerosis. Circ Res. 2019;124(2):315–327. doi: 10.1161/CIRCRESAHA.118.313591.
- Zhu Y, Xian X, Wang Z, et al. Research progress on the relationship between atherosclerosis and inflammation. Biomolecules. 2018;8(3):80. doi: 10.3390/biom8030080.
- Hansson GK, Robertson AK, Söderberg-Nauclér C. Inflammation and atherosclerosis. Annu Rev Pathol. 2006;1:297–329. doi: 10.1146/annurev.pathol.1.110304.100100.
- Tsigkas G, Apostolos A, Trigka A, et al. Very short versus longer dual antiplatelet treatment after coronary interventions: a systematic review and meta-analysis. Am J Cardiovasc Drugs. 2023;23(1):35–46. doi: 10.1007/s40256-022-00559-0.
- Apostolos A, Chlorogiannis D, Vasilagkos G, et al. Safety and efficacy of shortened dual antiplatelet therapy after complex percutaneous coronary intervention: a systematic review and meta-analysis. Hellenic J Cardiol. 2023;71:33–41. doi: 10.1016/j.hjc.2023.01.005.
- Franzone A, McFadden E, Leonardi S, et al. Ticagrelor alone versus dual antiplatelet therapy from 1 month after drug-eluting coronary stenting. J Am Coll Cardiol. 2019;74(18):2223–2234. doi: 10.1016/j.jacc.2019.08.1038.
- Mehran R, Baber U, Sharma SK, et al. Ticagrelor with or without aspirin in High-Risk patients after PCI. N Engl J Med. 2019;381(21):2032–2042. doi: 10.1056/NEJMoa1908419.
- Shah AD, Nicholas O, Timmis AD, et al. Threshold haemoglobin levels and the prognosis of stable coronary disease: two new cohorts and a systematic review and meta-analysis. PLoS Med. 2011;8(5):e1000439. doi: 10.1371/journal.pmed.1000439.
- Roh DJ, Albers DJ, Magid-Bernstein J, et al. Low hemoglobin and hematoma expansion after intracerebral hemorrhage. Neurology. 2019;93(4):e372–e80. doi: 10.1212/WNL.0000000000007820.
- Sabatine MS, Morrow DA, Giugliano RP, et al. Association of hemoglobin levels with clinical outcomes in acute coronary syndromes. Circulation. 2005;111(16):2042–2049. doi: 10.1161/01.CIR.0000162477.70955.5F.
- Pilgrim T, Vetterli F, Kalesan B, et al. The impact of anemia on long-term clinical outcome in patients undergoing revascularization with the unrestricted use of drug-eluting stents. Circ Cardiovasc Interv. 2012;5(2):202–210. doi: 10.1161/CIRCINTERVENTIONS.111.965749.
- Kunadian V, Mehran R, Lincoff AM, et al. Effect of anemia on frequency of short- and long-term clinical events in acute coronary syndromes (from the acute catheterization and urgent intervention triage strategy trial). Am J Cardiol. 2014;114(12):1823–1829. doi: 10.1016/j.amjcard.2014.09.023.
- Matsue Y, Matsumura A, Abe M, et al. Prognostic implications of chronic kidney disease and anemia after percutaneous coronary intervention in acute myocardial infarction patients. Heart Vessels. 2013;28(1):19–26. doi: 10.1007/s00380-011-0209-2.
- Babitt JL, Lin HY. Mechanisms of anemia in CKD. J Am Soc Nephrol. 2012;23(10):1631–1634. doi: 10.1681/ASN.2011111078.
- Zhang F, Lu Z, Wang F. Advances in the pathogenesis and prevention of contrast-induced nephropathy. Life Sci. 2020;259:118379. doi: 10.1016/j.lfs.2020.118379.
- Ozbeyaz NB, Gokalp G, Algul E, et al. H(2)FPEF score and Contrast-Induced nephropathy in patients with acute coronary syndrome undergoing percutaneous coronary intervention. Angiology. 2023;74(2):181–188. doi: 10.1177/00033197221099425.
- Özbeyaz NB, Gökalp G, Aydınyılmaz F, et al. Hypomagnesemia and the risk of contrast-induced nephropathy in patients undergoing elective coronary angiography. Turkish J Clin Lab. 2022. doi: 10.18663/tjcl.1183898.
- McGill JB, Bell DS. Anemia and the role of erythropoietin in diabetes. J Diabetes Complicat. 2006;20(4):262–272. doi: 10.1016/j.jdiacomp.2005.08.001.
- Aydınyılmaz F, Sunman H, Algül E, et al. The effect of ticagrelor and clopidogrel on angiographic parameters according to diabetic status in patients with ST elevation myocardial infarction. Russ J Cardiol. 2022;27(9):5021. doi: 10.15829/1560-4071-2022-5021.