
Abstract
Background
Intervertebral disc degeneration (IDD) is an important cause of low back pain. The aim of this study is to identify the potential molecular mechanism of abnormal methylation-modified DNA in the progression of IDD, hoping to contribute to the diagnosis and management of IDD.
Methods
Low-grade IDD (grade I–II) and high-grade IDD (grade III–V) data were downloaded from GSE70362 and GSE129789 datasets. The abnormally methylated modified differentially expressed mRNAs (DEmRNAs) were identified by differential expression analysis (screening criteria were p < .05 and |logFC| > 1) and differential methylation analysis (screening criteria were p < .05 and |δβ| > 0.1). The classification models were constructed, and the receiver operating characteristic analysis was also carried out. In addition, functional enrichment analysis and immune correlation analysis were performed and the miRNAs targeted for the abnormally methylated DEmRNAs were predicted. Finally, expression validation was performed using real-time PCR.
Results
Compared with low-grade IDD, seven abnormal methylation-modified DEmRNAs (AOX1, IBSP, QDPR, ABLIM1, CRISPLD2, ACTC1 and EMILIN1) were identified in high-grade IDD, and the classification models of random forests (RF) and support vector machine (SVM) were constructed. Moreover, seven abnormal methylation-modified DEmRNAs and classification models have high diagnostic accuracy (area under the curve [AUC] > 0.8). We also found that AUC values of single abnormal methylation-modified DEmRNA were all lower than those of RF and SVM classification models. Pearson correlation analysis found that macrophages M2 and EMILIN1 had significant negative correlation, while macrophages M2 and IBSP had significant positive correlation. In addition, four targeted relationship pairs (hsa-miR-4728-5p-QDPR, hsa-miR-4533-ABLIM1, hsa-miR-4728-5p-ABLIM1 and hsa-miR-4534-CRISPLD2) and multiple signalling pathways (for example, PI3K-AKT signalling pathway, osteoclast differentiation and calcium signalling pathway) were also identified that may be involved in the progression of IDD.
Conclusion
The identification of abnormal methylation-modified DEmRNAs and the construction of classification models in this study were helpful for the diagnosis and management of IDD progression.
Introduction
Intervertebral disc degeneration (IDD) is a common spinal imaging finding, and its incidence increases with age [Citation1]. IDD is caused by many factors, including genetic factors, ageing, mechanical damage, malnutrition, etc. Currently, IDD is often treated by conservative treatment and surgical treatment according to the patient’s symptoms [Citation2]. However, these treatments only provide temporary relief to the pain symptoms, rather than solve the underlying problem of IDD. In addition, severe IDD is an important cause of low back pain, disc herniation, degenerative stenosis of the spinal canal, lumbar spondylolisthesis and disability [Citation3–5]. Therefore, identifying molecules that accelerate the degeneration may help reduce the speed and severity of IDD. Although the mechanism of IDD has been clarified to some extent, it has not yet been fully clarified. Therefore, it is necessary to constantly study the potential molecular mechanisms of IDD to develop more effective strategies to prevent and manage the progression of IDD.
DNA methylation is an epigenetic mechanism that plays an important role in regulating gene expression [Citation6]. Abnormal DNA methylation modification also has an important regulatory mechanism in the progression of IDD [Citation7]. Enhanced GPX4 methylation via homocysteine may up-regulate oxidative stress and iron ptosis in the nucleus pulposus, thus participating in the progression of IDD [Citation8]. Previous studies have shown that DNMT3B reduces extracellular matrix degradation and IDD by inhibiting the COX2/YAP axis through TRPA1 methylation [Citation9]. Reduced expression of secreted protein acidic and cysteine rich (SPARC) is associated with ageing and degeneration of human intervertebral disc, and its promoter is hypermethylated in low back pain (LBP) patients with disc degeneration [Citation10]. These studies suggest the potential role of abnormal DNA methylation in the progression of IDD. Therefore, analysing DNA methylation modification data of genes is important for elucidating the epigenetic regulation mechanisms of IDD.
The immune system, including immune cells and cytokines, plays an important mediating role in IDD [Citation11]. During the development of IDD, some components of nucleus pulposus cells are gradually exposed to the body’s immune system, thus triggering a series of autoimmune reactions [Citation12]. The imbalance of neutrophils and gamma delta T cells is significantly associated with IDD progression [Citation13]. Increased expression of FasL in human nucleus pulposus cells led to a significant increase in apoptosis rates of macrophages and CD8 T cells [Citation14]. Previous studies have found that ANXA3, MSH2, ZBTB16, LY96, PIK3CD, ZBTB16, and ADAM8 are correlated with the proportion of CD8 T cells and resting memory CD4 T cells in IDD [Citation15]. Therefore, exploring the correlation between key molecules and immune cell infiltration in the progression of IDD is conducive to understanding the immune regulatory mechanism of IDD.
Machine learning (ML), which integrates computer science and statistics into medical problems, is considered to be a promising method for disease diagnosis or prediction of clinical results [Citation16–18]. ML algorithms have been used to classify results from biomedical datasets, including support vector machine (SVM), random forest (RF), etc. [Citation19]. Previous prediction models of RF and SVM based on immune-related genes of IDD have high accuracy [Citation20]. Receiver operating characteristic (ROC) analysis is a tool used to describe the discrimination accuracy of a diagnostic test or prediction model [Citation21]. The ROC curve is an effective way to evaluate the performance of diagnostic tests [Citation22]. In ROC analysis, the larger the area under the curve (AUC), the higher the diagnostic accuracy [Citation23]. In this study, we downloaded the mRNA expression data and methylation data of low-grade IDD (grade I–II) and high-grade IDD (grade III–V) from the Gene Expression Omnibus (GEO) database (https://www.ncbi.nlm.nih.gov/geo/) [Citation24]. Subsequently, seven abnormal methylation-modified DEmRNAs (differentially expressed mRNAs) were identified and RF and SVM classification models were constructed. In addition, the correlation between abnormal methylation-modified DEmRNAs and immune cell infiltration was analysed. In order to further understand the molecular mechanism of abnormal methylation-modified DEmRNAs, we also constructed the mRNA–miRNA interaction network. The aim of this study is to explore the potential molecular mechanisms of abnormal methylation-modified DEmRNAs in the progression of IDD through differential analysis, functional enrichment, model construction, immune correlation analysis, and mRNA–miRNA interaction network construction, hoping to contribute to the diagnosis and management of IDD. This study laid a theoretical foundation for studying the molecular mechanism, clinical diagnosis and management of IDD.
Materials and methods
Data screening
Retrieve IDD-related datasets from the GEO database, and limit the research types to ‘Expression profiling by array’ and ‘Methylation profiling by array’. Datasets must be genome-wide mRNA transcriptome data and DNA methylation data. Moreover, the data were from nucleus pulposus samples of patients with different grades of IDD. In this study, standardized or original datasets were considered. Finally, one mRNA dataset and one methylation dataset were obtained according to the above screening criteria ().
Table 1. Details of the GSE70362 and GSE129789 datasets.
Identification and functional enrichment of differentially expressed mRNAs (DEmRNAs)
The GSE70362 dataset includes 24 samples of the nucleus pulposus and 24 samples of the annulus fibrosus. Subsequently, 24 samples of nucleus pulposus were selected and divided into low-grade IDD (grade I–II) and high-grade IDD (grade III–V) according to Thompson grade. Then, the probe was mapped to the gene. If a gene corresponds to multiple probes, the average value is taken as the expression amount of the gene. The limma package in R software was used for mRNA differential expression analysis. The screening criteria were set to p value <.05 and |log fold change| (|logFC|) > 1. Subsequently, in order to understand the biological processes involved in DEmRNAs, Gene Ontology (GO) and Kyoto Encyclopedia of Genes and Genomes (KEGG) functional enrichment analyses of DEmRNAs were performed using DAVID database (https://david.ncifcrf.gov/tools.jsp). The screening criteria was p < .05. KEGG is a knowledge base for systematic analysis of gene function [Citation25]. GO annotations are divided into molecular function (MF), biological process (BP) and cellular components (CC). Through these three functional categories, the functions of genes are defined and described in many aspects [Citation26].
Identification and functional enrichment of abnormally methylated modified mRNAs
The GSE129789 dataset includes methylation data of 16 nucleus pulposus samples. Then, according to Thompson’s grade, 16 samples were divided into low-grade IDD (grade I–II) and high-grade IDD (grade III–V). The CHAMP package in R software was used for differential methylation analysis. The screening criteria were set to p < .05 and |δβ| > 0.1. Subsequently, in order to understand the biological processes involved in abnormally methylated modified mRNAs, GO and KEGG functional enrichment analysis of abnormally methylated modified mRNAs were performed using the DAVID database. The screening criteria was p < .05.
Identification of abnormal methylation-modified DEmRNAs
The intersection of DEmRNAs and abnormally methylated mRNAs was performed to obtain abnormal methylation-modified DEmRNAs. Subsequently, RF and SVM classification models were constructed using RF (https://cran.r-project.org/web/packages/randomForest/) and e1071 (https://cran.r-project.org/web/packages/e1071/index.html) packages in R software based on abnormal methylation-modified DEmRNAs. Ten-fold cross-validation was used to obtain the accuracy, sensitivity, specificity and AUC values of RF and SVM classification models. In addition, ROC analysis was performed using the pROC package (http://web.expasy.org/pROC/) in R software to evaluate the potential diagnostic value of abnormal methylation-modified DEmRNAs [Citation27]. In ROC analysis, the larger the AUC, the higher the diagnostic accuracy [Citation23]. AUC >0.8 indicates very good diagnostic accuracy.
Immune cells and abnormal methylation-modified DEmRNAs
CIBERSORT calculates the proportion of immune cells in each sample based on gene expression and gets the scores of immune cells in all samples. Then, scores of immune cells were sorted into immune cell infiltration matrix, and the differences between low-grade IDD and high-grade IDD of immune cells were calculated. The Wilcoxon test was used to statistically analyse the difference in immune cell infiltration levels between low-grade IDD and high-grade IDD groups. Pearson correlation analysis was used to analyse the correlation between differential infiltrating immune cells and abnormal methylation-modified mRNA.
Construction of mRNA–miRNA interaction network
The target miRNAs of abnormal methylation-modified DEmRNAs were predicted based on TargetScan (http://www.targetscan.org/vert_72/) and miRDB (http://mirdb.org/) databases. Then, the mRNA–miRNA interaction network was constructed. Cytoscape (www.cytoscape.org/) was used to visualize the miRNA–mRNA network. Meanwhile, the differential expression of miRNA in the GSE63492 dataset was analysed. The screening threshold was p < .05. Subsequently, the intersection of targeted miRNAs and differentially expressed miRNAs (DEmiRNAs) was selected.
Validation of real-time PCR
The sample size was calculated. The parameters are as follows: (1) significance level (α) = 0.05; (2) statistical power (1–β) = 0.80; (3) expected effect size (δ) = 1.5; (4) standard deviation of each group (σ) = 1.0. The results showed that the number of samples required for each group was about 7. In total, 18 blood samples (nine low-grade IDD blood samples and nine high-grade IDD blood samples) were collected from the population examined and treated in our hospital. This study was approved by the Bioethics Committee of Beijing Friendship Hospital, Capital Medical University (2023-P2-025-01). The written consent was obtained from all patients. The main reagents needed were RNAliquid ultrafast whole blood (liquid sample) total RNA extraction kit, FastQuant cDNA first strand synthesis kit and SuperReal PreMix Plus (SYBR Green). Each experiment was repeated three times. GAPDH and ACTB were internal reference. The 2−ΔΔCT method was used for relative quantitative analysis.
Statistical analysis
All statistics were performed using R-4.0.5 software. The limma package in R software was used to identify DEmRNAs. The screening criteria were set to p < .05 and |logFC| > 1. The CHAMP package in R software was used to identify differential methylation sites (DMSs). The screening criteria were set to p < .05 and |δβ| > 0.1. The Wilcoxon test was used to statistically analyse the difference in immune cell infiltration levels between low-grade IDD and high-grade IDD groups. p < .05 was considered statistically significant.
Results
Identification and functional enrichment of DEmRNAs
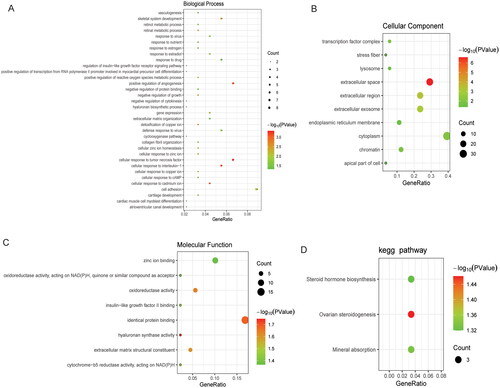
A total of 89 DEmRNAs were obtained based on p < .05 and |logFC| > 1, among which 43 were up-regulated and 46 were down-regulated in the high-grade IDD. The volcano map and heat map of DEmRNAs are shown in . Subsequently, GO and KEGG functional enrichment analyses were performed. In BP category, the DEmRNAs were found to be involved in skeletal system development, cartilage development and cellular zinc ion homeostasis (). In CC category, it was found that the DEmRNAs were mainly distributed in the cytoplasm, extracellular space and extracellular region (). In MF category, it was found that the DEmRNAs were mainly involved in identical protein binding, zinc ion binding and oxidoreductase activity (). In addition, KEGG analysis only found three significantly enriched signalling pathways, namely ovarian steroidogenesis, mineral absorption and steroid hormone biosynthesis ().
Figure 1. Volcano map and heat map of DEmRNAs.
A: Volcano map of DEmRNAs. The blue dot and red dot represent the up- and down-regulated DEmRNAs, respectively. X-axis and Y-axis represent − log10 (p value) and log2 fold change, respectively. B: Heat map of DEmRNAs. The full chain method combined with Euclidean distance was used to construct the cluster heat map. Red and green represent high and low expression DEmRNAs, respectively. LIDD: low-grade intervertebral disc degeneration; HIDD: high-grade intervertebral disc degeneration.
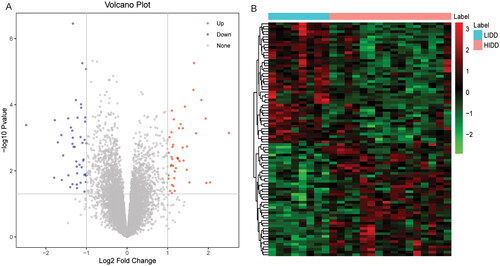
Figure 2. Functional enrichment analysis of DEmRNAs.
A: BP category in GO functional enrichment analysis of DEmRNAs; B: CC category in GO functional enrichment analysis of DEmRNAs; C: MF category in GO functional enrichment analysis of DEmRNAs; D: KEGG functional enrichment analysis of DEmRNAs. GO: Gene Ontology; KEGG: Kyoto Encyclopedia of Genes and Genomes; BP: biological process; CC: cellular components; MF: molecular function.
Identification and functional enrichment of abnormally methylated modified mRNAs
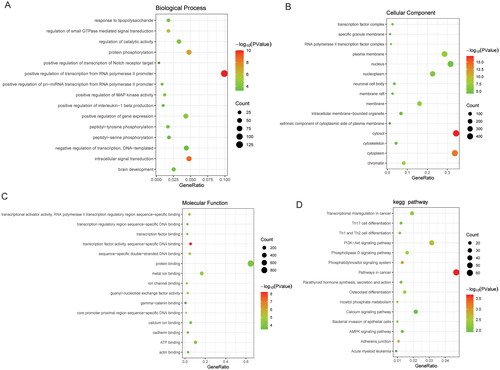
A total of 2828 DMSs were obtained based on p < .05 and |δβ| > 0.1. The DMSs contained 1440 abnormally methylated modified mRNAs, among which 1371 were hypermethylated mRNAs and 69 were hypomethylated mRNAs in high-grade IDD. The volcano map and Manhattan map of DMSs are shown in . Subsequently, GO and KEGG functional enrichment analyses were performed. In BP category, it was found that the abnormally methylated modified mRNAs were mainly involved in positive regulation of transcription from RNA polymerase II promoter, intracellular signal transduction and protein phosphorylation (). In CC category, it was found that the abnormally methylated modified mRNAs were mainly distributed in the cytosol, cytoplasm and nucleus (). In MF category, it was found that the abnormally methylated modified mRNAs were mainly involved in protein binding, metal ion binding and ATP binding (). KEGG enrichment analysis showed that abnormally methylated modified mRNAs was significantly enriched in PI3K-AKT signalling pathway, osteoclast differentiation and calcium signalling pathway ().
Figure 3. Volcano map and Manhattan map of DMSs.
A: Volcano map of DMSs. The blue dot and red dot represent hypermethylated and hypomethylated DMSs, respectively. B: Manhattan map of DMSs.
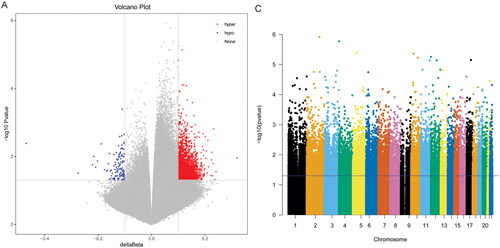
Figure 4. Functional enrichment analysis of abnormally methylated modified mRNAs.
A: BP category (top 15) in GO functional enrichment analysis of abnormally methylated modified mRNAs; B: CC category (top 15) in GO functional enrichment analysis of abnormally methylated modified mRNAs; C: MF category (top 15) in GO functional enrichment analysis of abnormally methylated modified mRNAs; D: KEGG functional enrichment analysis (top 15) of abnormally methylated modified mRNAs. GO: Gene Ontology; KEGG: Kyoto Encyclopedia of Genes and Genomes; BP: biological process; CC: cellular components; MF: molecular function.
Analysis of abnormal methylation-modified DEmRNAs
The intersection of DEmRNAs and abnormally methylated mRNAs was performed to obtain abnormal methylation-modified DEmRNAs. Finally, six hypermethylated–down-regulated DEmRNAs (AOX1, IBSP, QDPR, ABLIM1, CRISPLD2 and ACTC1) and one hypomethylated–up-regulated DEmRNA (EMILIN1) in high-grade IDD were obtained (). However, we also selected annulus fibrosus data from the GSE70362 dataset for differential expression validation of the AOX1, IBSP, QDPR, ABLIM1, CRISPLD2, ACTC1 and EMILIN1. The results showed that the expression trend of these DEmRNAs was consistent with that of the GSE70362 dataset (Supplementary Figure 1). However, QDPR, ABLIM1 and ACTC1 lacked statistical significance and needed further study.
Figure 5. Identification of abnormal methylation-modified DEmRNAs and construction of classification models.
A: Venn diagram of hypermethylated modified mRNAs and down-regulated DEmRNAs; B: Venn diagram of hypomethylated modified mRNAs and up-regulated DEmRNAs; C: RF classification model based on seven abnormal methylation-modified DEmRNAs; D: SVM classification model based on seven abnormal methylation-modified DEmRNAs. RF: random forest; SVM: support vector machine; AUC: area under the curve; ROC: receiver operating characteristic.
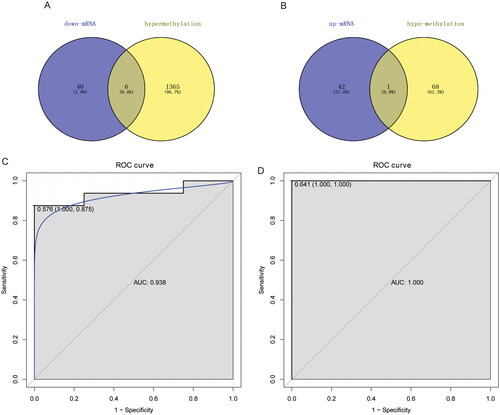
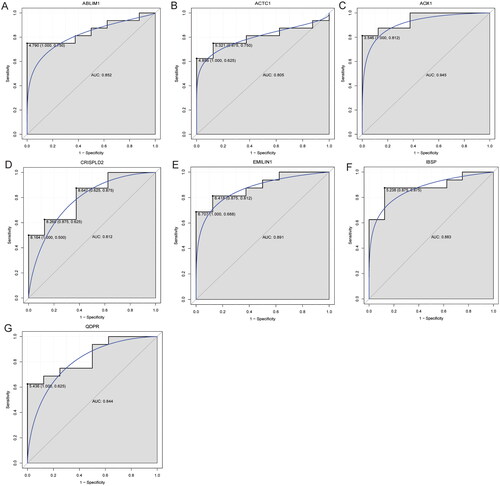
Subsequently, the RF and SVM classification diagnosis models were constructed based on abnormal methylation-modified DEmRNAs (). The results showed that accuracy, sensitivity, specificity and AUC values of RF classification model were 0.875, 0.875, 0.875 and 0.938, respectively. Meanwhile, accuracy, sensitivity, specificity and AUC values of SVM classification model were 0.958, 1.000, 0.875 and 1.000, respectively. These results indicated that the RF and SVM classification models based on seven abnormal methylation-modified DEmRNAs have high diagnostic value and may be novel potential diagnostic biomarkers for IDD. In addition, ROC analysis was also performed for AOX1, IBSP, QDPR, ABLIM1, CRISPLD2, ACTC1 and EMILIN1. The results showed that AUC values were all greater than 0.8 (), which indicated that AOX1, IBSP, QDPR, ABLIM1, CRISPLD2, ACTC1 and EMILIN1 might be potential molecular diagnostic markers in the progression of IDD. However, we found that AUC values of single abnormal methylation-modified DEmRNA were all lower than those of RF and SVM classification diagnosis models, which implied that classification models have higher potential diagnostic value.
Figure 6. ROC analysis of ABLIM1 (A), ACTC1 (B), AOX1 (C), CRISPLD2 (D), EMILIN1 (E), IBSP (F) and QDPR (G).
AUC: area under the curve; ROC: receiver operating characteristic.
Analysis of correlation between immune cells and abnormal methylation-modified DEmRNAs
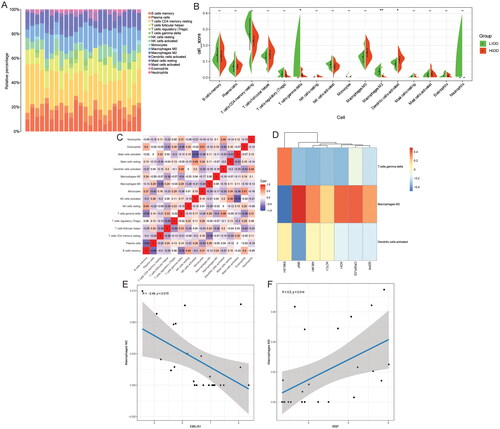
We evaluated the proportion of immune cells in the sample according to the CIBERSORT method to obtain the immune cell scores (). Then, the scores of immune cells were sorted into immune cell infiltration matrix to analyse the difference of immune cell infiltration between low-grade IDD and high-grade IDD groups. The results showed that the infiltration level of gamma delta T cells and macrophage M were significantly decreased, and the increase of dendritic cells activated was significantly increased in the high-grade IDD group (). The correlation between immune cells in IDD was also analysed, and the results showed that mast cells activated and natural killer cells activated had a high negative correlation (). Subsequently, Pearson correlations between gamma delta T cells, macrophages M and dendritic cells activated and abnormal methylation-modified DEmRNAs (AOX1, IBSP, QDPR, ABLIM1, CRISPLD2, ACTC1 and EMILIN1) were analysed. The results showed that macrophages M2 and EMILIN1 had significant negative correlation, while macrophages M2 and IBSP had significant positive correlation ().
Figure 7. Analysis of correlation between immune cells and abnormal methylation-modified DEmRNAs.
A: Stacked histogram of the proportion of each immune cell in the sample analysed by the CIBERSORT method; B: The difference of immune cell infiltration between low-grade IDD and high-grade IDD groups was analysed based on immune cell scores; C: The correlation between immune cells in IDD; D: Pearson correlations between gamma delta T cells, macrophages M and dendritic cells activated and abnormal methylation-modified DEmRNAs (AOX1, IBSP, QDPR, ABLIM1, CRISPLD2, ACTC1 and EMILIN1); E: Macrophages M2 and EMILIN1 was significantly negatively correlated; F: Macrophages M2 and IBSP were significantly positively correlated. LIDD: low-grade intervertebral disc degeneration; HIDD: high-grade intervertebral disc degeneration. *p < .05; **p < .01.
Construction of mRNA–miRNA interaction network
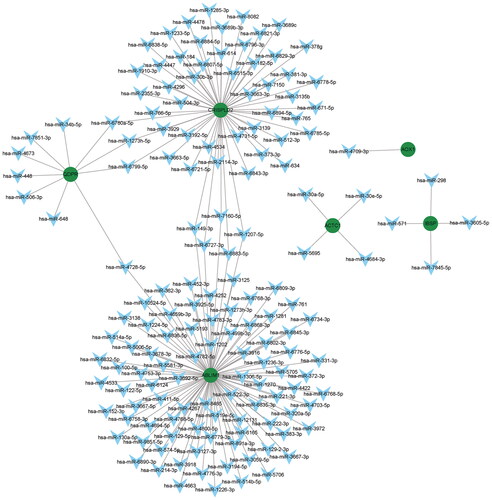
A total of 153 targeted miRNAs were predicted for abnormal methylation-modified DEmRNAs based on TargetScan and miRDB databases. The results were imported into Cytoscape to construct mRNA–miRNA interaction network (). Based on the screening criteria p < .05, 86 DEmiRNAs were identified in the GSE63492 dataset. The intersection of targeted miRNAs and DEmiRNAs was selected. Finally, three targeted DEmiRNAs hsa-miR-4728-5p, hsa-miR-4533 and hsa-miR-4534 were obtained, and the targeted relationship pairs involved were hsa-miR-4728-5p (up-regulated)-QDPR (hypermethylation, down-regulated), hsa-miR-4533 (down-regulated)-ABLIM1 (hypermethylation, down-regulated), hsa-miR-4728-5p (up-regulated)-ABLIM1 (hypermethylation, down-regulated) and hsa-miR-4534 (up-regulated)-CRISPLD2 (hypermethylation, down-regulated).
Figure 8. mRNA–miRNA interaction network.
Real-time PCR validation of the expression levels of AOX1, IBSP, QDPR, ABLIM1, CRISPLD2, ACTC1 and EMILIN1
Real-time PCR was performed based on nine low-grade IDD blood samples and nine high-grade IDD blood samples to verify the expression of AOX1, IBSP, QDPR, ABLIM1, CRISPLD2, ACTC1 and EMILIN1. All primer sequences are shown in . The results of real-time PCR showed that EMILIN1 had up-regulated trend (), and AOX1, IBSP, QDPR, ABLIM1, CRISPLD2 and ACTC1 had down-regulated trend in the high-grade IDD group (), which was consistent with the results of bioinformatics analysis. However, the expression of most mRNAs in real-time PCR results was not significant, which may be caused by small sample size and sample heterogeneity. Therefore, it is necessary to expand the sample size and conduct a series of in vitro experimental verifications in the future.
Figure 9. The expression levels of EMILIN1 (A), AOX1 (B), IBSP (C), QDPR (D), ABLIM1 (E), CRISPLD2 (F) and ACTC1 (G) were verified by real-time PCR.
LIDD: low-grade intervertebral disc degeneration; HIDD: high-grade intervertebral disc degeneration. ***p < .001.
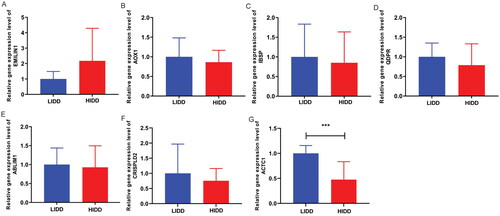
Table 2. All primer sequences for real-time PCR.
Discussion
In this study, six hypermethylated–down-regulated DEmRNAs (AOX1, IBSP, QDPR, ABLIM1, CRISPLD2 and ACTC1) and one hypomethylated–up-regulated DEmRNAs (EMILIN1) in high-grade IDD were obtained. AOX1 is hypermethylated and under-expressed in prostate cancer tissues and cells, and affects the migration and invasion of cancer cells [Citation28]. The level of AOX1 in differentiated bone marrow-derived mesenchymal stem cells was higher and gradually increased. Overexpression of AOX1 significantly increased the expression of osteo-specific genes, which clearly indicated that AOX1 plays an important role in osteogenic differentiation [Citation29]. Oncology studies have shown that regulation of ACTC1 is associated with cancer invasion, migration, and patient prognosis [Citation30,Citation31]. ACTC1 plays an important role in the treatment of skeletal muscle diseases, and increased methylation around the ACTC1 transcription start site is associated with decreased ACTC1 expression [Citation32]. In this study, we found that AOX1 and ACTC1 were hypermethylated in high-grade IDD, and the decreased expression of AOX1 and ACTC1 in high-grade IDD may be caused by hypermethylation modification. We also found that the AUC of AOX1 and ACTC1 were greater than 0.8. Therefore, combined with the results of previous studies, we speculated that abnormal methylation of AOX1 and ACTC1 play an important regulatory role in the progression of IDD, and AOX1 and ACTC1 may be potential molecular markers of IDD.
IBSP is the main structural protein of bone matrix, accounting for about 12% of human bone non-collagen protein, which is mainly expressed by bone cells [Citation33,Citation34]. In addition, IBSP also plays a certain regulatory role in nucleus pulposus cells [Citation35]. EMILIN1 connects the elastic fibre network with collagen fibre formation and is associated with bone and vascular tissue homeostasis [Citation36]. EMILIN1 also plays a role in influencing the pathogenesis of peripheral nervous system diseases [Citation37]. In addition, EMILIN1 methylation abnormalities in uterine carcinosarcoma and rhabdomyosarcoma may be a potential therapeutic target [Citation38,Citation39]. In this study, we found that IBSP and EMILIN1 were abnormally methylated in high-grade IDD. Dysregulation of IBSP and EMILIN1 expression in high-grade IDD may be caused by abnormal methylation modifications and thus play a role in the progression of IDD. We also found that the AUC of IBSP and EMILIN1 were greater than 0.8, which indicated that IBSP and EMILIN1 might be potential molecular diagnostic markers in the progression of IDD. Moreover, Pearson correlation analysis found that macrophages M2 and EMILIN1 had significant negative correlation, while macrophages M2 and IBSP had significant positive correlation. Resting macrophages (M0) exhibit two distinct phenotypes, namely polarized ‘M1’ and ‘M2’ phenotypes, the ‘M2’ macrophages having anti-inflammatory and immunosuppressive effects [Citation40]. A study found that the proportion of macrophage M2 clusters decreased with the progression of IDD [Citation41]. Therefore, we speculated that abnormal methylation of IBSP and EMILIN1 may play an immunomodulatory role in the progression of IDD by regulating macrophage M2. In addition, KEGG analysis also revealed that IBSP was enriched in PI3K-AKT signalling pathway signalling pathway. The PI3K-AKT signalling pathway plays an important role in macrophage activation and M1/M2 polarization [Citation42]. The PI3K-AKT pathway plays a critical role in regulating the megakaryopoiesis-supporting ability of M2 macrophages [Citation43]. In addition, the PI3K-AKT signalling pathway plays an important role in regulating the progression of IDD [Citation44,Citation45]. Therefore, IBSP may regulate the immunomodulatory role of macrophage M2 in IDD by regulating the PI3K-AKT signalling pathway.
QDPR plays an important role in the recycling of tetrahydrobiopterin (BH4) and is closely related to oxidative stress. Its mutation leads to dysregulation of autophagy [Citation46]. Previous studies have found that ABLIM1 is hypermethylated and has low expression in gestational diabetes mellitus, which may be involved in affecting foetal heart development [Citation47]. ABLIM1 may negatively control osteoclast differentiation by regulating actin formation-mediated cell migration and fusion [Citation48]. Skeletal muscle ABLIM1 splicing is abnormal in myotonic dystrophy type 1 patients [Citation49]. In addition, abnormal expression of ABLIM1 in IDD may be a potential biomarker [Citation50]. CRISPLD2 is a secreted protein that is thought to play a role in tissue remodelling and inflammation during development [Citation51]. It is expressed at low levels in septic shock and is associated with procalcitonin [Citation52]. In this study, we found that QDPR, ABLIM1 and CRISPLD2 were hypermethylated and low expressed in high-grade IDD. We speculate that the decreased expression of QDPR, ABLIM1 and CRISPLD2 in high-grade IDD may be caused by hypermethylation and play a regulatory role in disease progression. We also found that the AUC of QDPR, ABLIM1 and CRISPLD2 were greater than 0.8, which indicated that QDPR, ABLIM1 and CRISPLD2 might be potential molecular diagnostic markers in the progression of IDD. Moreover, we found four targeted relationship pairs, namely hsa-miR-4728-5p-QDPR, hsa-miR-4533-ABLIM1, hsa-miR-4728-5p-ABLIM1 and hsa-miR-4534-CRISPLD2. Hsa-miR-4728-5p plays an important regulatory role in the oxidative damage of the lens in patients with age-related cataract [Citation53]. Moreover, hsa-miR-4728-5p is also an important regulator of IDD [Citation54]. Hsa-miR-4534 is up-regulated in diabetic kidney disease (DKD), which may affect FoxO signalling pathway by targeting BNIP3, and maybe a novel biomarker for disease progression of type 2 DKD [Citation55]. Hsa-miR-4534 is overexpressed in prostate cancer and plays its carcinogenic role by down-regulating the tumour suppressor phosphatase and tensin homolog (PTEN) [Citation56]. So far, no relevant studies on hsa-miR-4533 have been found, and this study may be the first relevant research on hsa-miR-4533. In this study, our analysis results suggest that hsa-miR-4728-5p-QDPR, hsa-miR-4533-ABLIM1, hsa-miR-4728-5p-ABLIM1 and hsa-miR-4534-CRISPLD2 may participate in the regulation of IDD progression. However, the specific regulatory mechanism needs further study.
We constructed classification models of RF and SVM based on seven abnormal methylation-modified DEmRNAs. The results show that RF and SVM classification models have high accuracy and AUC value, which indicated that RF and SVM classification models have high diagnostic value and may be novel potential diagnostic biomarkers for IDD. In addition, we found that AUC values of single abnormal methylation-modified DEmRNA were all lower than those of RF and SVM classification diagnosis models, which further implied that classification models have higher potential diagnostic value. In this study, KEGG analysis of DEmRNAs revealed three signalling pathways, ovarian steroidogenesis, mineral absorption and steroid hormone biosynthesis, which were significantly enriched. In addition, KEGG analysis of abnormally methylated modified mRNAs revealed multiple significantly enriched signalling pathways, including PI3K-AKT signalling pathway, osteoclast differentiation and calcium signalling pathway. So far, no relevant studies have been found on ovarian steroidogenesis, mineral absorption, steroid hormone biosynthesis, osteoclast differentiation and calcium signalling pathway in the progression of IDD, and further studies are needed to understand their mechanism of action.
This study also has some limitations. First of all, all the data in this study were from the public database, so the obtained classification diagnosis models need to be verified by collecting a large number of clinical samples in the later stage. Secondly, the specific mechanism of the identified abnormal methylation-modified DEmRNAs and key signalling pathways in the progress of IDD is still unclear, so a lot of in vivo and in vitro validation is needed (e.g. cell experiments or animal model). Thirdly, a large number of nucleus pulposus samples will be collected in the later stage to further validate the abnormal methylation-modified DEmRNAs identified in this study.
Conclusion
In this study, seven abnormal methylation-modified DEmRNAs have high diagnostic accuracy, which indicated that they may be potential molecular diagnostic markers. However, we found that AUC values of single abnormal methylation-modified DEmRNA were all lower than those of RF and SVM classification diagnosis models, which implied that classification models have higher potential diagnostic value. Moreover, abnormal methylation of IBSP and EMILIN1 may also play an immunomodulatory role in the progression of IDD by regulating macrophage M2. In addition, IBSP may regulate the immunomodulatory role of macrophage M2 in IDD by regulating the PI3K-AKT signalling pathway. In conclusion, the identification of abnormal methylation-modified DEmRNAs and the construction of classification models in this study were helpful for the diagnosis and management of IDD progression, and lay a theoretical foundation for understanding the pathological mechanism of IDD.
Authors contributions
Conception and design: X.X. and G.Z. Administrative support: G.Z. Provision of study materials or patients: X.X. and N.L. Collection and assembly of data: X.X., G.Z. and N.L. Data analysis and interpretation: X.X., G.Z. and N.L. All authors have made important contributions to data analysis, drafting the article or revising the article.
Ethical approval and consent to participate
This study was approved by the Bioethics Committee of Beijing Friendship Hospital, Capital Medical University (2023-P2-025-01). The written informed consent was obtained from all patients. All participants were informed as to the purpose of this study, and that this study complied with the Declaration of Helsinki.
Consent for publication
Not applicable.
Supplemental Material
Download MS Word (853.5 KB)Acknowledgements
Not applicable.
Disclosure statement
The authors declare that they have no conflict of interest.
Data availability statement
The database analysed during the current study is available in the GEO database, persistent accessible web link to the database is https://www.ncbi.nlm.nih.gov/geo/. Accession numbers of the datasets used in the current study are GSE70362 and GSE129789. All data generated or analysed during this study are included in this published article.
Additional information
Funding
References
- Francisco V, Pino J, González-Gay MÁ, et al. A new immunometabolic perspective of intervertebral disc degeneration. Nat Rev Rheumatol. 2022;18(1):1–16. doi: 10.1038/s41584-021-00713-z.
- Xin J, Wang Y, Zheng Z, et al. Treatment of intervertebral disc degeneration. Orthop Surg. 2022;14(7):1271–1280. doi: 10.1111/os.13254.
- Rivera Tapia ED, Meakin JR, Holsgrove TP. In-vitro models of disc degeneration – a review of methods and clinical relevance. J Biomech. 2022;142:111260. doi: 10.1016/j.jbiomech.2022.111260.
- Buckwalter JA. Aging and degeneration of the human intervertebral disc. Spine (Phila Pa 1976). 1995;20(11):1307–1314. doi: 10.1097/00007632-199506000-00022.
- Shi Q, Xu L, Zeng X. Sirtuin 1 participates in intervertebral disc degeneration via the nicotinamide phosphoribosyl transferase/nicotinamide adenine dinucleotide/sirtuin 1 pathway responsible for regulating autophagy of nucleus pulposus cells. Exp Ther Med. 2022;23(4):267. doi: 10.3892/etm.2022.11193.
- Moore LD, Le T, Fan G. DNA methylation and its basic function. Neuropsychopharmacology. 2013;38(1):23–38. doi: 10.1038/npp.2012.112.
- Ikuno A, Akeda K. Genome-wide analysis of DNA methylation profile identifies differentially methylated loci associated with human intervertebral disc degeneration. PloS One. 2019;14:e0222188. doi: 10.1371/journal.pone.0222188.
- Zhang X, Huang Z, Xie Z, et al. Homocysteine induces oxidative stress and ferroptosis of nucleus pulposus via enhancing methylation of GPX4. Free Radic Biol Med. 2020;160:552–565. doi: 10.1016/j.freeradbiomed.2020.08.029.
- Luo Z, Ma Y, Di T, et al. DNMT3B decreases extracellular matrix degradation and alleviates intervertebral disc degeneration through TRPA1 methylation to inhibit the COX2/Yap axis. Aging (Albany NY). 2021;13(16):20258–20276. doi: 10.18632/aging.203410.
- Tajerian M, Alvarado S, Millecamps M, et al. DNA methylation of SPARC and chronic low back pain. Mol Pain. 2011;7:1744-8069-7-65. doi: 10.1186/1744-8069-7-65.
- Ye F, Lyu FJ, Wang H, et al. The involvement of immune system in intervertebral disc herniation and degeneration. JOR spine. 2022;5:e1196. doi: 10.1002/jsp2.1196.
- Capossela S, Schläfli P, Bertolo A, et al. Degenerated human intervertebral discs contain autoantibodies against extracellular matrix proteins. Eur Cell Mater. 2014;27:251–263; discussion 263. doi: 10.22203/ecm.v027a18.
- Li W, Ding Z, Zhang H, et al. The roles of blood Lipid-Metabolism genes in immune infiltration could promote the development of IDD. Front Cell Dev Biol. 2022;10:844395. doi: 10.3389/fcell.2022.844395.
- Liu Z-H, Sun Z, Wang H-Q, et al. FasL expression on human nucleus pulposus cells contributes to the immune privilege of intervertebral disc by interacting with immunocytes. Int J Med Sci. 2013;10(8):1053–1060. doi: 10.7150/ijms.6223.
- Hai B, Song Q, Du C, et al. Comprehensive bioinformatics analyses reveal immune genes responsible for altered immune microenvironment in intervertebral disc degeneration. Mol Genet Genomics. 2022;297(5):1229–1242. doi: 10.1007/s00438-022-01912-3.
- Jhee JH, Lee S, Park Y, et al. Prediction model development of late-onset preeclampsia using machine learning-based methods. PLoS One. 2019;14(8):e0221202. doi: 10.1371/journal.pone.0221202.
- Peiffer-Smadja N, Rawson TM, Ahmad R, et al. Machine learning for clinical decision support in infectious diseases: a narrative review of current applications. Clin Microbiol Infect. 2020;26(5):584–595. doi: 10.1016/j.cmi.2019.09.009.
- Deo RC. Machine learning in medicine. Circulation. 2015;132(20):1920–1930. doi: 10.1161/circulationaha.115.001593.
- Deng F, Huang J, Yuan X, et al. Performance and efficiency of machine learning algorithms for analyzing rectangular biomedical data. Lab Invest. 2021;101:430–441. doi: 10.1038/s41374-020-00525-x.
- Wu B, Huang X, Zhang M, et al. Significance of immune-related genes in the diagnosis and classification of intervertebral disc degeneration. J Immunol Res. 2022;2022:2616260. doi: 10.1155/2022/2616260.
- Obuchowski NA, Bullen JA. Receiver operating characteristic (ROC) curves: review of methods with applications in diagnostic medicine. Phys Med Biol. 2018;63(7):07tr01. doi: 10.1088/1361-6560/aab4b1.
- Park SH, Goo JM, Jo CH. Receiver operating characteristic (ROC) curve: practical review for radiologists. Korean J Radiol. 2004;5(1):11–18. doi: 10.3348/kjr.2004.5.1.11.
- Šimundić AM. Measures of diagnostic accuracy: basic definitions. EJIFCC. 2009;19(4):203–211.
- Edgar R, Domrachev M, Lash AE. Gene expression omnibus: NCBI gene expression and hybridization array data repository. Nucleic Acids Res. 2002;30(1):207–210. doi: 10.1093/nar/30.1.207.
- Kanehisa M, Goto S. KEGG: Kyoto Encyclopedia of Genes and Genomes. Nucleic Acids Res. 2000;28(1):27–30. doi: 10.1093/nar/28.1.27.
- The Gene Ontology Consortium. The gene ontology resource: 20 years and still GOing strong. Nucleic Acids Res. 2019;47:D330–D338. doi: 10.1093/nar/gky1055.
- Robin X, Turck N, Hainard A, et al. pROC: an open-source package for R and S + to analyze and compare ROC curves. BMC Bioinf. 2011;12(1):77. doi: 10.1186/1471-2105-12-77.
- Wu J, Wei Y, Li T, et al. DNA methylation-mediated lowly expressed AOX1 promotes cell migration and invasion of prostate cancer. Urol Int. 2023;107(5):517–525. doi: 10.1159/000522634.
- Sun L, Ma J, Chen J, et al. Bioinformatics-guided analysis uncovers AOX1 as an osteogenic differentiation-relevant gene of human mesenchymal stem cells. Front Mol Biosci. 2022;9:800288. doi: 10.3389/fmolb.2022.800288.
- Wanibuchi M, Ohtaki S, Ookawa S, et al. Actin, alpha, cardiac muscle 1 (ACTC1) knockdown inhibits the migration of glioblastoma cells in vitro. J Neurol Sci. 2018;392:117–121. doi: 10.1016/j.jns.2018.07.013.
- Ohtaki S, Wanibuchi M, Kataoka-Sasaki Y, et al. ACTC1 as an invasion and prognosis marker in glioma. J Neurosurg. 2017;126(2):467–475. doi: 10.3171/2016.1.jns152075.
- Boutilier JK, Taylor RL, Ram R, et al. Variable cardiac α-actin (Actc1) expression in early adult skeletal muscle correlates with promoter methylation. Biochim Biophys Acta Gene Regul Mech. 2017;1860(10):1025–1036. doi: 10.1016/j.bbagrm.2017.08.004.
- Wu K, Feng J, Lyu F, et al. Exosomal miR-19a and IBSP cooperate to induce osteolytic bone metastasis of estrogen receptor-positive breast cancer. Nat Commun. 2021;12:5196. doi: 10.1038/s41467-021-25473-y.
- Bianco P, Fisher LW, Young MF, et al. Expression of bone sialoprotein (BSP) in developing human tissues. Calcif Tissue Int. 1991;49(6):421–426. doi: 10.1007/bf02555854.
- Veras MA, McCann MR, Tenn NA, et al. Transcriptional profiling of the murine intervertebral disc and age-associated changes in the nucleus pulposus. Connect Tissue Res. 2020;61(1):63–81. doi: 10.1080/03008207.2019.1665034.
- Adamo CS, Beyens A, Schiavinato A, et al. EMILIN1 deficiency causes arterial tortuosity with osteopenia and connects impaired elastogenesis with defective collagen fibrillogenesis. Am J Hum Genet. 2022;109(12):2230–2252. doi: 10.1016/j.ajhg.2022.10.010.
- Iacomino M, Doliana R, Marchese M, et al. Distal motor neuropathy associated with novel EMILIN1 mutation. Neurobiol Dis. 2020;137:104757. doi: 10.1016/j.nbd.2020.104757.
- Li J, Xing X, Li D, et al. Whole-genome DNA methylation profiling identifies epigenetic signatures of uterine carcinosarcoma. Neoplasia. 2017;19(2):100–111. doi: 10.1016/j.neo.2016.12.009.
- Sun W, Chatterjee B, Wang Y, et al. Distinct methylation profiles characterize fusion-positive and fusion-negative rhabdomyosarcoma. Mod Pathol. 2015;28(9):1214–1224. doi: 10.1038/modpathol.2015.82.
- Zhao F, Guo Z, Hou F, et al. Magnoflorine alleviates “M1” polarized macrophage-induced intervertebral disc degeneration through repressing the HMGB1/Myd88/NF-κB pathway and NLRP3 inflammasome. Front Pharmacol. 2021;12:701087. doi: 10.3389/fphar.2021.701087.
- Ling Z, Liu Y, Wang Z, et al. Single-cell RNA-seq analysis reveals macrophage involved in the progression of human intervertebral disc degeneration. Front Cell Dev Biol. 2021;9:833420. doi: 10.3389/fcell.2021.833420.
- Vergadi E, Ieronymaki E, Lyroni K, et al. Akt signaling pathway in macrophage activation and M1/M2 polarization. J Immunol. 2017;198(3):1006–1014. doi: 10.4049/jimmunol.1601515.
- Zhao H-Y, Zhang Y-Y, Xing T, et al. M2 macrophages, but not M1 macrophages, support megakaryopoiesis by upregulating PI3K-AKT pathway activity. Sig Transduct Target Ther. 2021;6(1):234. doi: 10.1038/s41392-021-00627-y.
- Zhao Y, Li A. miR-19b-3p relieves intervertebral disc degeneration through modulating PTEN/PI3K/akt/mTOR signaling pathway. Aging (Albany NY). 2021;13(18):22459–22473. doi: 10.18632/aging.203553.
- Liu W, Niu F, Sha H, et al. Apelin-13/APJ system delays intervertebral disc degeneration by activating the PI3K/AKT signaling pathway. Eur Rev Med Pharmacol Sci. 2020;24:2820–2828. doi: 10.26355/eurrev_202003_20643.
- Si Q, Sun S, Gu Y. A278C mutation of dihydropteridine reductase decreases autophagy via mTOR signaling. Acta Biochim Biophys Sin (Shanghai). 2017;49(8):706–712. doi: 10.1093/abbs/gmx061.
- Chen M, Yan J. Identification of hub-methylated differentially expressed genes in patients with gestational diabetes mellitus by multi-omic WGCNA basing epigenome-wide and transcriptome-wide profiling. J Cell Biochem. 2020;121:3173–3184. doi: 10.1002/jcb.29584.
- Narahara H, Sakai E, Yamaguchi Y, et al. Actin binding LIM 1 (abLIM1) negatively controls osteoclastogenesis by regulating cell migration and fusion. J Cell Physiol. 2018;234(1):486–499. doi: 10.1002/jcp.26605.
- Ohsawa N, Koebis M, Mitsuhashi H, et al. ABLIM1 splicing is abnormal in skeletal muscle of patients with DM1 and regulated by MBNL, CELF and PTBP1. Genes Cells. 2015;20(2):121–134. doi: 10.1111/gtc.12201.
- Wang Y, Dai G, Wang L, et al. Identification of key genes potentially related to intervertebral disk degeneration by microarray analysis. Genet Test Mol Biomarkers. 2019;23(9):610–617. doi: 10.1089/gtmb.2019.0043.
- Jackson RM, Griesel BA, Short KR, et al. Weight loss results in increased expression of anti-inflammatory protein CRISPLD2 in mouse adipose tissue. Obesity (Silver Spring). 2019;27(12):2025–2036. doi: 10.1002/oby.22652.
- Wang T, Wang Z-Q, Wang L, et al. CRISPLD2 is expressed at low levels during septic shock and is associated with procalcitonin. PLoS One. 2013;8(6):e65743. doi: 10.1371/journal.pone.0065743.
- Zhou T, Zhang J, Qin B, et al. Long non‑coding RNA NONHSAT143692.2 is involved in oxidative DNA damage repair in the lens by regulating the miR‑4728‑5p/OGG1 axis. Int J Mol Med. 2020;46(5):1838–1848. doi: 10.3892/ijmm.2020.4707.
- Chang H, Yang X, You K, et al. Integrating multiple microarray dataset analysis and machine learning methods to reveal the key genes and regulatory mechanisms underlying human intervertebral disc degeneration. PeerJ. 2020;8:e10120. doi: 10.7717/peerj.10120.
- Zhao Y, Shen A, Guo F, et al. Urinary exosomal MiRNA-4534 as a novel diagnostic biomarker for diabetic kidney disease. Front Endocrinol (Lausanne). 2020;11:590. doi: 10.3389/fendo.2020.00590.
- Nip H, Dar AA, Saini S, et al. Oncogenic microRNA-4534 regulates PTEN pathway in prostate cancer. Oncotarget. 2016;7(42):68371–68384. doi: 10.18632/oncotarget.12031.