Abstract
Background. There is an unmet need for a straightforward and cost-effective assessment of multiple lipoprotein risk factors for vascular diseases.
Aims. 1) To study the relation of various lipoprotein lipid and apolipoprotein (apo) measures on the Friedewald inputs, i.e. plasma triglycerides (TG), cholesterol (TC), and high-density lipoprotein cholesterol (HDL-C). 2) To build up regression models for the appropriate measures based solely on the Friedewald inputs.
Methods. Data were available for 1,775 plasma samples, from which very-low-density lipoprotein (VLDL), intermediate-density lipoprotein (IDL), low-density lipoprotein (LDL), and HDL were also isolated by ultracentrifugation. For HDL2-C and apolipoproteins, 343 and 247 samples were available, respectively.
Results. Accurate models were obtained for VLDL-TG (cross-validation r=0.98), LDL-C (r=0.91), HDL2-C (r=0.92), apoA-I (r=0.92), and apoB (r=0.95). A semi-quantitative model was obtained for IDL-C (r=0.78). Due to the anticipated role of IDL-C in atherosclerosis, it was still kept within the accepted models and pursued further. The associations of the estimates with premature deaths were studied in 4,084 patients with type 1 diabetes. The associations of IDL-C and LDL-C were markedly different, the best predictors of mortality being apoB, apoB to apoA-I ratio, and IDL-C.
Conclusions. The new models allow identification of clinically relevant lipoprotein profiles with no added cost to the conventional Friedewald formula.
Introduction
Current evidence supports the combined use of various lipoprotein and apolipoprotein (apo) measures to improve the risk assessment of vascular complications Citation[1], Citation[2]. Nevertheless, due to practical labor and cost issues, the Friedewald estimate Citation[3] of low-density lipoprotein cholesterol (LDL-C) still remains the prevailing measure in epidemiology and an essential treatment target in clinical practice Citation[4]. Only plasma triglycerides (TG), plasma C (TC), and high-density lipoprotein (HDL) C measurements are needed in the Friedewald formula, thus avoiding the laborious ultracentrifugation (UCF) procedures Citation[3]. The formula is applicable if plasma TG ≤ 4.52 mmol/L. A fundamental shortcoming, however, is that the estimated values do not represent pure LDL-C but include also the contribution from intermediate-density lipoprotein (IDL).
Recently it has been proposed that apoB and the apoB to apoA-I ratio should be determined in addition to LDL-C Citation[2]. Since one apoB molecule is incorporated in every very-low-density lipoprotein (VLDL), IDL, and LDL particle, the apoB concentration indicates the total number of atherogenic apoB-containing lipoprotein particles. Many studies have shown that apoB can surpass LDL-C and non-HDL-C in cardiovascular risk assessment Citation[2], Citation[5–7]. Interestingly, recent results from the global INTERHEART study indicate that the non-fasting apoB to apoA-I ratio is superior to any of the cholesterol ratios for estimation of the risk of acute myocardial infarction Citation[8].
Key messages
The new computational approach allows estimation of a clinically useful lipoprotein profile—including VLDL-TG, IDL-C, LDL-C, HDL2-C, apoA-I, and apoB—with no additional costs if the conventional Friedewald inputs are available.
The new approach is likely to be valuable in assessing the separate importance of IDL-C and LDL-C, as well as the other lipoprotein measures, as risk factors for macrovascular complications, an issue inherently hampered when using the traditional Friedewald formula.
The new approach is freely accessible to the public via an online service at http://www.computationalmedicine.fi/software/Lipido.
The recent increase in metabolic syndrome and diabetes calls for supplementary data on TG-rich lipoproteins such as VLDL and IDL Citation[9]. However, only a few studies have investigated the IDL fraction and cardiovascular risk. Notably, however, when lipoprotein fractions were experimentally studied, IDL-C, but not LDL-C, was shown to be strongly related to the progression of coronary and carotid artery atherosclerosis Citation[10], Citation[11]. On the other hand, data on the inverse relationship between HDL-C and the risk for vascular complications are abundant Citation[12], Citation[13]. Nevertheless, the HDL subfractions seem to differ in their capacity to confer protection, the HDL2 subfraction being more protective than the HDL3Citation[14].
Abbreviations
Several large-scale epidemiological studies have run out of plasma samples and are left only with data for the Friedewald formula but no other lipoprotein measures. Here, regression models for several individual lipoprotein lipid and apolipoprotein measures were built on plasma TG, TC, and HDL-C, i.e. the Friedewald inputs. Cross-validation showed good quantitative performance for the estimation of VLDL-TG, LDL-C, HDL2-C, apoA-I and apoB. A semi-quantitative model was obtained for IDL-C. Therefore, this new approach is able to provide advanced lipoprotein profiles with no additional cost if the conventional Friedewald inputs are available. The clinical usefulness of the new approach is demonstrated in a population-based cross-sectional study of 4,084 patients with type 1 diabetes.
Materials and methods
Study design
The regression models of the lipid and apolipoprotein variables were developed using data from individuals with a wide range of plasma lipid values Citation[15–19]. For the VLDL, IDL, and LDL measures n=1,775, for the HDL2n=343, and for the apolipoproteins n=249 (Data set I). For each variable an independent regression model was constructed using only the Friedewald inputs. The successfully cross-validated regression models were applied to the Friedewald input data for 4,084 patients with type 1 diabetes from the FinnDiane Study Citation[20] (Data set II). The associations of the measured and estimated lipids and apolipoproteins to the all-cause mortality were also studied within Data set II.
Data set I
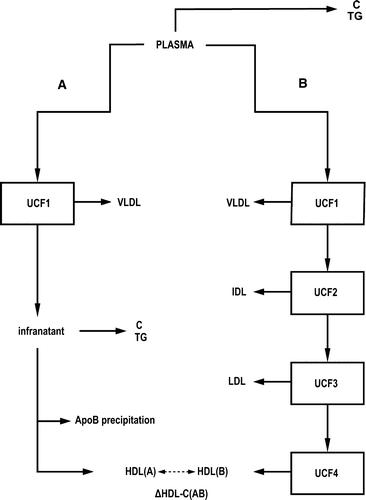
Biochemical data from 1,775 samples for plasma TG, TC, VLDL-TG, IDL-TG, IDL-C, LDL-C, and HDL-C were available Citation[15–19]. The data set contained 863 samples from normolipidemic subjects (TC < 6.0 mmol/L and plasma TG < 2.0 mmol/L), from dietary interventions and with variable alcohol consumption Citation[15], Citation[16], and also individuals with various lipoprotein abnormalities including heterozygote familial hypercholesterolemia Citation[17] and chronic renal failure Citation[18]. The blood samples were drawn after an overnight fast of 12 hours into ethylenediamine tetra-acetic acid (EDTA)-containing tubes, and plasma was separated by centrifugation. Plasma TG and TC were measured and identical samples were analyzed with two different measurement procedures as illustrated in . In procedure A, the HDL-C was measured from plasma after the sequential UCF of VLDL and precipitation of the apoB-containing lipoproteins with heparin-manganese. In procedure B, the VLDL, IDL, LDL, and HDL fractions were isolated by UCF using density ranges of <1.006 g/mL, 1.006–1.019 g/mL, 1.019–1.063 g/mL, and 1.063–1.210 g/mL, respectively. After isolation, the fractions were dialyzed against 0.15 M NaCl solution containing 0.01% EDTA, pH 7.4. The concentrations of TG and C were determined with Specific Chemistry Analyser (Kone, Finland) using enzymatic colorimetric methods (kits by Boehringer Diagnostica, Mannheim GmbH, Germany) Citation[15–19]. The number of samples in which HDL2 was ultracentrifuged, instead of total HDL, was 343. The density range used was 1.063–1.125 g/mL.
Figure 1. Overview of the lipoprotein isolation and measurement procedures for Data set I. Plasma C and plasma TG are measured, and identical samples are also handled through two different procedures. In procedure A the HDL-C is measured after VLDL ultracentrifugation and precipitation of the apoB-containing lipoprotein particles. In procedure B, sequential ultracentrifugation is applied to physically isolate the individual VLDL, IDL, LDL, and HDL fractions. ▵HDL-C(AB) denotes the difference of the measured HDL-C in procedures A and B. (Key for the abbreviations: C = cholesterol; TG = triglycerides; VLDL = very-low-density lipoprotein; IDL = intermediate-density lipoprotein; LDL = low-density lipoprotein; HDL = high-density lipoprotein; UCF = ultracentrifugation.) See also Supplementary .
For another 249 individuals venous blood samples were also obtained after an overnight fast and EDTA-plasma was separated by centrifugation. Plasma TG and TC were determined with an automated Cobas Mira analyzer (Hoffmann-La Roche, Basel, Switzerland) by enzymatic methods (Hoffmann-La Roche kits 0722138 and 0715166, respectively). Plasma HDL-C was quantified by phosphotungstic acid/magnesium chloride precipitation procedures (Hoffman-La Roche kit 0720674), and the concentrations of apoA-I, apoA-II, and apoB were measured by immunoturbidometric methods (for apoA-I: Wako Chemicals GmbH, Neuss, Germany; for apoA-II: Wako Chemicals GmbH and own polyclonal antibody produced in rabbits against human apoA-II; and for apoB: Orion Diagnostica, Espoo, Finland). ApoE concentration was determined using enzyme-linked immunosorbent assay Citation[21]. shows the characteristics of the lipid and apolipoprotein measures for Data set I.
Table I. Characteristics of the lipid and apolipoprotein measures in Data set I.
Estimation of the ultracentrifugation wastage
In Data set I, sequential UCF was used to physically isolate the lipoprotein fractions for subsequent lipid analyses. Each UCF step involves some lipoprotein loss from the original plasma concentration. The loss was estimated from two independent measurements of HDL-C (procedures A and B in ). Procedure A involved only one and procedure B four UCF rounds before the measurement of HDL-C. There were 1,331 samples available with the HDL-C measurements from both procedures. Least squares fitting of these data resulted in wastage of 11% per UCF round (see Supplementary to be found online, at http//www.informaworld.com (10.1080107853890902893392)). The lipoprotein lipid measurements from the UCF-isolated fractions were scaled accordingly before further analyses to represent the original plasma concentrations.
Regression modeling
Artificial neural network (ANN) algorithms were used for the regression analyses Citation[22], Citation[23]. Multilayer perceptron (MLP) networks, which are shown to be effective both in pattern recognition and prediction problems Citation[24], were applied. An MLP network consists of processing elements (neurons), which are organized in layers. The network learns association patterns between the input and output variables from training data and then applies them to new data. The MLP models were trained by back-propagation using scaled conjugate gradient in MATLAB programming environment (Version 7.3.0.267 R2006b) based on the MCMCstuff toolbox (http://www.lce.hut.fi/research/mm/mcmcstuff/). The MLP models were composed of three layers: the input layer (three neurons), one hidden layer (five neurons), and the output layer (one neuron). To avoid overfitting of the models, early stop committees Citation[24] with 20 members were used to regularize the network via dividing the training data set equally to training and validation subsets. The input variables were the Friedewald inputs (plasma TG, TC, and HDL-C), which were scaled to zero mean and unit standard deviation (SD). An independent MLP model was constructed for each output variable.
Data set II
To demonstrate the clinical value of the new approach, the regression models (based on Data set I) were applied to the centrally measured baseline Friedewald input data of 4,084 patients with type 1 diabetes from the FinnDiane Study. The design and details of this population-based cross-sectional study have been described previously Citation[20], Citation[25]. All-cause mortality data were available after an average of 6.6±2.1 years of follow-up (279 deaths).
Statistical analysis
The correspondence between the biochemically measured values and those estimated by the MLP committees was assessed by cross-validation. First, Data set I was randomly divided into subsets of 10 samples. The models were then trained n/10 times, each time leaving one of the subsets out from the training set and using the omitted subset as an independent test to assess the performance of the model. The largest and smallest input values in the data set were each time included in the training data. The results were examined by Pearson correlation coefficients (r) and Bland-Altman plots Citation[26].Cox proportional hazard models Citation[27] were fitted to the measured Friedewald inputs and to the estimated lipoprotein measures to investigate their associations with all-cause mortality in Data set II. Each lipid and apolipoprotein variable was investigated independently using a separate Cox model adjusted for age and sex. Each continuous variable was scaled to zero mean and unit SD before regression analysis. Thus, the observed hazard ratios denote the relative risk associated with one SD increase in the value of the variable in question. In-house MATLAB scripts were used for all statistical analyses.
Results
The extended Friedewald approach
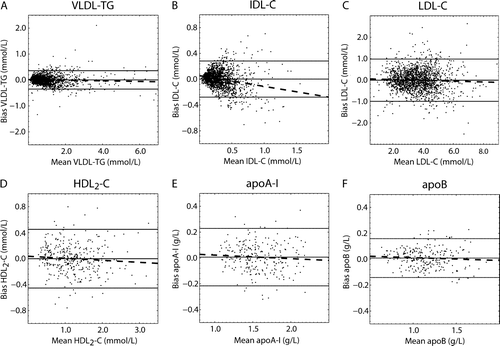
High cross-validated accuracy was achieved for VLDL-TG (r=0.98; n=1,775; P<0.0001), LDL-C (r=0.91; n=1,775; P<0.0001), HDL2-C (r=0.92; n=343; P<0.0001), apoA-I (r=0.92; n=247; P<0.0001), and apoB (r=0.95; n=247; P<0.0001). For IDL-C the association between the measured and estimated concentrations was intermediate (r=0.78), but significant (n=1,775; P<0.0001) (). There was no clear association between the Friedewald inputs and IDL-TG, apoA-II, or apoE (data not shown). The Bland-Altman analyses Citation[26] showed mean bias of 0.0036 mmol/L (VLDL-TG), 0.0022 mmol/L (IDL-C), −0.0046 mmol/L (LDL-C), −0.0017 mmol/L (HDL2-C), 0.0067 g/L (apoA-I), and 0.0089 g/L (apoB) (). also shows that the estimates of VLDL-TG, LDL-C, HDL2-C, apoA-I, and apoB were not biased over a wide range of concentrations. For IDL-C there was a statistically significant (P<0.0001) negative intercept (−0.019 mmol/L) and correlation (r= − 0.23) indicating a slightly biased model. The limits of agreement (95% confidence intervals for the estimations) were −0.35–0.36 mmol/L (VLDL-TG); −0.28–0.28 mmol/L (IDL-C); −0.99–0.98 mmol/L (LDL-C); −0.45–0.45 mmol/L (HDL2-C); −0.22–0.23 g/L (apoA-I), and −0.14–0.16 g/L (apoB).
Figure 2. Correlation plots for the cross-validation results for the ANN-estimated variables (Data set I; ). The dashed lines represent the actual regression lines, and the solid lines identify the 1:1 line. An r stands for the Pearson correlation coefficient between the measured and estimated variables. The equations for the regression lines are: A) y = 0.93x + 0.05; B) y = 0.61x + 0.11; C) y = 0.89x + 0.36; D) y = 0.88x + 0.14; E) y = 0.90x + 0.17; and F) y = 0.92x + 0.10.
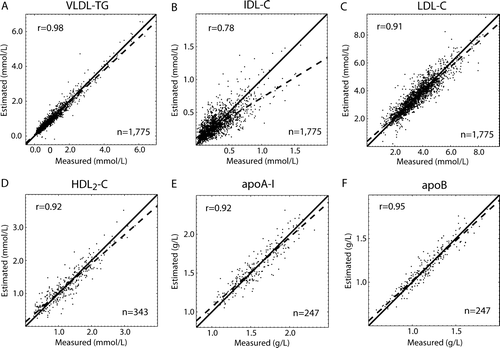
Figure 3. Bland-Altman plots for the cross-validation results for the ANN-estimated variables (Data set I; ). The solid line in the middle represents the mean bias and the two others the mean±2 SD. The dashed lines represent the regression lines for the biases. A) Bias as a function of VLDL-TG: y = − 0.012x + 0.015 with r=0.054; B) bias as a function of IDL-C: y = − 0.17x + 0.055 with r=0.23; C) bias as a function of LDL-C: y = − 0.019x + 0.063 with r=0.042; D) bias as a function of HDL2-C: y = − 0.031x + 0.036 with r=0.079; E) bias as a function of apoA-I: y = − 0.027x + 0.050 with r=0.068; and F) bias as a function of apoB: y = − 0.022x + 0.034 with r=0.069.
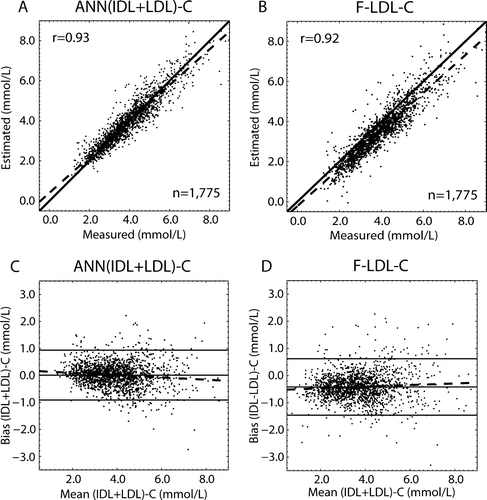
An ANN regression model of (IDL + LDL)-C was also constructed to assess the performance with respect to the Friedewald formula (F-LDL-C). The correlation plots and the Bland-Altman plots are shown in . The correlation between the estimated and the measured values was high for both approaches: r=0.93 (P<0.0001) for the ANN and r=0.92 (P<0.0001) for the Friedewald formula. The mean bias was 0.01 mmol/L for the ANN model and −0.42 mmol/L for the Friedewald formula. Both models were slightly biased: r= − 0.11 (P<0.0001) for the ANN and r=0.07 (P=0.003) for the Friedewald formula. Thus, the ANN model slightly overestimates at low (IDL + LDL) − C concentrations and slightly underestimates at high concentrations. For the Friedewald estimations the situation is opposite. The limits of agreement were −0.91–0.94 mmol/L and −1.46–0.62 mmol/L for the ANN model and for the Friedewald formula, respectively. Thus, the ANN regression approach performed similarly to the Friedewald formula but without systematic underestimation of the measures.
Figure 4. Correlation and Bland-Altman plots for the (IDL + LDL)-C estimates calculated via the Friedewald formula (F-LDL-C) and via the (cross-validated) ANN regression models. The dashed lines in the correlation figures (A and B) represent the regression lines, and the solid lines denote the 1:1 lines. An r stands for the Pearson correlation coefficient between the measured and estimated variables. In the Bland-Altman plots (C and D) the solid line in the middle represents the mean bias and the two others the mean±2 SD. The dashed lines represent the regression lines for the biases. The equations for the regression lines are: A) y = 0.90x + 0.40; and B) y = 0.94x − 0.22. C) Bias as a function of (IDL + LDL)-C: y = − 0.04x + 0.18 with r=0.11; and D) bias as a function of F-LDL-C: y = 0.03x − 0.53 with r=0.070.
The use of the ANN regression models is limited by the training data Citation[24]. Cross-validation tests showed that 10% extensions of the Friedewald input limits outside the values in the training data set did not significantly affect the performance of the ANN models (data not shown). Thus, 10% extensions were used and implemented into the software (see ). For example, the upper limit for plasma TG to estimate the lipid and apolipoprotein measures is 9.60 mmol/L and 6.60 mmol/L, respectively. Furthermore, the ANN estimates of the lipoprotein lipid and apolipoprotein measures enable the calculation of some additional measures of potential clinical importance, such as HDL3-C (=HDL-C minus HDL2-C) and apoB to apoA-I ratio.The cross-validated performance of linear regression models for the above-mentioned lipoprotein lipid and apolipoprotein measures was slightly worse than obtained via the ANN models (data not shown). With different numbers of hidden neurons the ANN approach produced essentially the same results (data not shown). An online interface to apply the ANN regression models is freely available at http://www.computationalmedicine.fi/software/Lipido.
Associations between mortality and the lipid and apolipoprotein measures
shows the results from the Cox proportional hazard regression analyses between the various lipoprotein measures and all-cause mortality in Data set II. The ANN-estimated apoB and IDL-C were the strongest single lipoprotein predictors of premature death in the set of 4,084 patients with type 1 diabetes. In addition, the apoB to apoA-I ratio was strongly associated with mortality, and a positive association was found for VLDL and plasma TG. However, pure LDL-C did not associate with mortality, although a slight association was seen for the F-LDL-C. Increased HDL-C and HDL2-C were significantly associated with a reduced risk of mortality. No statistically significant association was found for HDL3-C.
Table II. The distributions of 14 plasma lipid and lipoprotein measures in Data set II consisting of 4,084 patients with type 1 diabetes Citation[20], Citation[25]. The presented Cox hazard regression coefficients and hazard ratios for all-cause mortality are adjusted for age and sex.
Discussion
Analytical aspects
This work introduces a new approach to estimating several lipoprotein lipid and apolipoprotein variables from the traditional Friedewald inputs. Improvements to the Friedewald formula itself have been studied rather broadly previously (Citation[28] and references therein), but none of the modified methodologies have gained popularity, since the original formula already provides competitive performance. This was also true here; the ANN and the Friedewald estimates for (IDL + LDL)-C were almost equally accurate, even though there was a slight bias towards underestimation in the case of the Friedewald formula. Here we have applied the rationale behind the original Friedewald formula Citation[3] to other lipoprotein measures that are difficult to measure, thus maintaining the maximum applicability but nevertheless extending the biological significance. Thus, no other inputs than plasma TG, TC, and HDL-C were needed Citation[29], Citation[30].
We performed extensive regression modeling of large data sets in which both the Friedewald inputs and various other lipoprotein measures were available. To our knowledge, this is the first study of the predictive power of the Friedewald inputs on other lipoprotein measures than (IDL + LDL)-C. The results are encouraging: if the conventional Friedewald inputs are available in a study, no additional costs would arise to extend the F-LDL-C estimates to a lipoprotein profile including VLDL-TG, IDL-C, LDL-C, HDL2-C, apoA-I, and apoB. These measures, together with the Friedewald inputs, also enable the calculation of clinically relevant derivatives such as HDL3-C and apoB to apoA-I ratio.The ANN models of VLDL-TG, LDL-C, (IDL + LDL)-C, HDL2-C, apoA-I, and apoB show similar or slightly better performance than the original Friedewald formula for F-LDL-C. In contrast to the Friedewald values, there is no systematic bias in the above-mentioned ANN estimates ( and , and 4). The observed underestimation of (IDL + LDL)-C values by the Friedewald formula corroborates previous studies in which directly measured LDL-C values were compared to the Friedewald estimates Citation[31], Citation[32].
The applicability of the Friedewald formula is limited to plasma TG = 4.52 mmol/L. This limit is related to the structural integrity of VLDL particles and the approximation of VLDL-C via the measured plasma TG (VLDL-C in mmol/L ∼ plasma TG/2.2) Citation[3]. In the ANN models some structural variability can be accounted for by inherent non-linear modeling. Although the ANN models are known to perform well in interpolation, they are unreliable in extrapolation Citation[24]. Thus, the use of the ANN regression models is limited by the training data; the specific Friedewald input limits for each ANN-estimated lipoprotein measure are given in and incorporated into the freely available software.
The ANN regression model of IDL-C can only be considered semi-quantitative. A small bias was observed, and the association between the measured and estimated values is only moderate (r=0.78). However, studies that exist on the role of the IDL fraction on cardiovascular risk clearly indicate that IDL-C is strongly associated with the progression of atherosclerosis Citation[10], Citation[11]. This seems not to be the case for pure LDL-C Citation[10], Citation[11]. Therefore, the estimation of the IDL-C was included as a part of the ANN-estimated lipoprotein profile, especially since it is unlikely that direct measurements of IDL-C (or LDL-C) will become routine in large clinical studies Citation[33]. Even if direct measurements were feasible, the computational approach is the only way to study IDL-C in long-running studies with no sample material left. This notion is strongly supported by the results from the application of the ANN approach in the case of the 4,084 patients with type 1 diabetes.
Application prospects
The 14 lipoprotein variables studied () include the three Friedewald inputs and their derivatives F-LDL-C, non-HDL-C, and TC to HDL-C ratio. The ANN regression models were applied to estimate VLDL-TG, IDL-C, LDL-C, HDL2-C, apoA-I, and apoB, which then also allowed the calculation of two further lipid measures, i.e. HDL3-C and apoB to apoA-I ratio. The ANN-estimated apoB and IDL-C were the single lipoprotein measures most strongly associated with mortality in Data set II. In contrast, pure LDL-C did not show any statistically significant association with mortality in this patient population. The F-LDL-C showed a slight association which, based on the strong association obtained for IDL-C, is likely to arise from the incorporation of IDL-C within the F-LDL-C values. In addition, the apoB to apoA-I ratio was strongly associated with mortality, while HDL-C and HDL2-C were significantly associated with a reduced risk of death. The inverse association between HDL2-C and mortality may be stronger than is directly evident from the hazard ratio (HR) in since the ANN regression estimate for HDL2-C could not be calculated due to too small HDL-C for 114 patients (2.8%), of which 22 had died (7.9% of all deaths).
Most premature deaths of patients with type 1 diabetes are related to macrovascular events Citation[20], Citation[34–36]. The observed strong association of IDL-C with mortality agrees with similar evidence for non-diabetic individuals Citation[10], Citation[11]. Also, the levels of circulating IDL in kidney disease may be 2- to 3-fold higher than those of healthy subjects Citation[37], and it has been shown that IDL is the lipoprotein fraction most closely associated with aortic atherosclerosis in patients with chronic renal failure Citation[38]. Thus, despite the semi-quantitative nature of the ANN-based IDL-C estimate, the results agree well with the known aspects of the underlying lipoprotein metabolism in the set of patients with type 1 diabetes and diabetic kidney disease Citation[20], Citation[39]. These findings further support the use of the ANN-based IDL-C estimates if direct experimental measures are not available.
There is increasing evidence that apoB would be a better indicator for the risk of macrovascular complications than F-LDL-C, LDL-C, TC, and non-HDL-C Citation[2], Citation[5–7]. In addition, the apoB to apoA-I ratio seems to be more informative than the TC to HDL-C ratio Citation[40]. The results of this study are consistent with these conclusions. The findings are likely to be affected by the high incidence of metabolic syndrome (MetS) in patients with type 1 diabetes Citation[39]. Thus, plasma TG alone associates quite strongly with all-cause mortality in this set of patients (). Also, apoB measures the accumulation of atherogenic TG-rich lipoprotein particles and, in combination with apoA-I, indicates the increased risk in MetS (increased TG, decreased HDL). Plasma lipids, F-LDL-C, or LDL-C cannot accurately describe these metabolic changes that are linked to obesity and, from a population perspective, to the type 2 diabetes pandemic Citation[41].
In summary, the validity and biological significance of the ANN regression models was demonstrated in a realistic clinical situation for a large set of patients with type 1 diabetes. In particular, IDL-C and LDL-C showed markedly different behavior in this clinical context. We expect this approach to be valuable in assessing the separate importance of IDL-C and LDL-C, as well as the other lipoprotein measures, as risk factors for macrovascular complications, an issue inherently hampered when using the traditional Friedewald formula. The new approach is freely accessible to the public (online service at http://www.computationalmedicine.fi/software/Lipido) and involves no additional cost if plasma TG, TC, and HDL-C, i.e. the conventional Friedewald inputs, are available.
Acknowledgements
We thank the FinnDiane Study Group for providing the clinical and biochemical data (see Supplementary Data, to be found online, at http://www.informaworld.com (10.1080/0753890902893392)). This work was supported by the Academy of Finland Centre of Excellence program for 2006–2011 (KK and MAK), the Jenny and Antti Wihuri Foundation (VPM), the Sigrid Jusélius Foundation (MJ), the Finnish Foundation for Cardiovascular Research (MJ), Folkhälsan Research Foundation (PHG), and Wilhelm and Else Stockmann Foundation (PHG). Wihuri Research Institute is maintained by Jenny and Antti Wihuri Foundation. Declaration of interest: The authors report no conflicts of interest. The authors alone are responsible for the content and writing of the paper.
Supplementary Data
Download PDF (80.4 KB)Supplementary Figure 1
Download GIF Image (87.9 KB)
References
- Carmena R, Duriez P, Fruchart JC. Atherogenic lipoprotein particles in atherosclerosis. Circulation 2004; 109: 2–7
- Mudd JO, Borlaug BA, Johnston PV, Kral BG, Rouf R, Blumenthal RS, et al. Beyond low-density lipoprotein cholesterol. J Am Coll Cardiol 2007; 50: 1735–41
- Friedewald WT, Levy RI, Fredrickson DS. Estimation of the concentration of low-density lipoprotein cholesterol in plasma, without use of the preparative ultracentrifuge. Clin Chem 1972; 18: 499–502
- Warnick GR, Myers GL, Cooper GR, Rifai N. Impact of the third cholesterol report from the adult treatment panel of the national cholesterol education program on the clinical laboratory. Clin Chem 2002; 48: 11–17
- Walldius G, Jungner I, Holme I, Aastveit AH, Kolar W, Steiner E. High apolipoprotein B, low apolipoprotein A-I, and improvement in the prediction of fatal myocardial infarction (AMORIS study): a prospective study. Lancet 2001; 358: 2026–33
- Pischon T, Girman CJ, Sacks FM, Rifai N, Stampfer MJ, Rimm EB. Non-high-density lipoprotein cholesterol and apolipoprotein B in the prediction of coronary heart disease in men. Circulation 2005; 112: 3375–83
- St-Pierre A, Cantin B, Dagenais GR, Mauriege P, Bernard PM, Despres JP, et al. Low-density lipoprotein subfractions and the long-term risk of ischemic heart disease in men. 13-year follow-up data from the Quebec Cardiovascular Study. Arterioscler Thromb Vasc Biol 2005; 25: 553–9
- McQueen MJ, Hawken S, Wang X, Ounpuu S, Sniderman A, Probstfield J, et al. Lipids, lipoproteins, and apolipoproteins as risk markers of myocardial infarction in 52 countries (the INTERHEART study): a case-control study. Lancet 2008; 372: 224–33
- Ginsberg HN. New perspectives on atherogenesis: role of abnormal triglyceride-rich lipoprotein metabolism. Circulation 2002; 106: 2137–42
- Hodis HN, Mack WJ, Dunn M, Liu CR, Liu CH, Selzer RH, et al. Intermediate-density lipoproteins and progression of carotid arterial wall intima-media thickness. Circulation 1997; 95: 2022–6
- Phillips NR, Waters D, Havel RJ. Plasma lipoproteins and progression of coronary artery disease evaluated by angiography and clinical events. Circulation 1993; 88: 2762–70
- Majeed F, Miller M. Low high-density lipoprotein cholesterol: an important consideration in coronary heart disease risk assessment. Curr Opin Endocrinol Diabetes Obes 2008; 2: 175–81
- Bruckert E, Hansel B. HDL-C is a powerful lipid predictor of cardiovascular diseases. Int J Clin Pract 2007; 11: 1905–13
- Morgan J, Carey C, Lincoff A, Capuzzi D. High-density lipoprotein subfractions and risk of coronary artery disease. Curr Atheroscler Rep 2004; 6: 359–65
- Savolainen MJ, Rantala M, Kervinen K, Järvi L, Suvanto K, Rantala T, et al. Magnitude of dietary effects on plasma cholesterol concentration: role of sex and apolipoprotein E phenotype. Atherosclerosis 1991; 86: 145–52
- Hannuksela M, Marcel YL, Kesäniemi YA, Savolainen MJ. Reduction in the concentration and activity of plasma cholesteryl ester transfer protein by alcohol. J Lipid Res 1992; 33: 737–44
- Savolainen MJ, Korhonen T, Aalto-Setälä K, Kontula K, Kesäniemi YA. Screening for a prevalent LDL receptor mutation in patients with severe hypercholestrolaemia. Hum Genet 1991; 87: 125–8
- Hörkkö S, Huttunen K, Korhonen T, Kesäniemi YA. Decreased clearance of low-density lipoprotein in patients with chronic renal failure. Kidney Int 1994; 45: 561–70
- Ala-Korpela M, Korhonen A, Keisala J, Hörkkö S, Korpi P, Ingman LP, et al. 1H NMR-based absolute quantitation of human lipoproteins and their lipid contents directly from plasma. J Lipid Res 1994; 35: 2292–304
- Mäkinen VP, Forsblom C, Thorn L, Wadén J, Gordin D, Heikkilä O, et al. FinnDiane Study Group. Metabolic phenotypes, vascular complications and premature deaths in a population of 4,197 patients with type 1 diabetes. Diabetes 2008; 57: 2480–7
- Siggins S, Jauhiainen M, Olkkonen VM, Tenhunen J, Ehnholm C. PLTP secreted by HepG2 cells resembles the high-activity PLTP form in human plasma. J Lipid Res 2003; 44: 1698–704
- Baxt WG. Application of artificial neural networks to clinical medicine. Lancet 1995; 346: 1135–8
- Väänänen T, Koskela H, Hiltunen Y, Ala-Korpela M. Application of quantitative artificial neural network analysis to 2D NMR spectra of hydrocarbon mixtures. J Chem Inf Comput Sci 2002; 42: 1343–6
- Bishop CM. Neural networks for pattern recognition. Oxford University Press, New York 1995
- Tolonen N, Forsblom C, Thorn L, Wadén J, Rosengård-Bärlund M, Saraheimo M, et al. Relationship between lipid profiles and kidney function in patients with type 1 diabetes. Diabetologia 2008; 51: 12–20
- Bland JM, Altman DG. Statistical methods for assessing agreement between two methods of clinical measurement. Lancet 1986; 1: 307–10
- Cox DR. Regression models and life tables. J Royal Stat Soc 1972; 34: 187–220
- Gazi I, Tsimihodimos V, Filippatos TD, Saougos VG, Bairaktari ET, Tselepis AD, et al. LDL cholesterol estimation in patients with the metabolic syndrome. Lipids Health Dis 2006; 5: 8
- Planella T, Cortes M, Martinez-Bru C, Gonzalez-Sastre F, Ordonez-Llanos J. Calculation of LDL-cholesterol by using apolipoprotein B for classification of nonchylomicronemic dyslipidemia. Clin Chem 1999; 43: 808–15
- Wagner AM, Zapico E, Bonet R, Perez A, Ordonez-Llanos J. The effect of VLDL particles on the accuracy of a direct LDL-cholesterol method in type 2 diabetic patients. Clin Biochem 2003; 36: 177–83
- Ran Jun K, Park HI, Chun S, Park H, Min WK. Effects of total cholesterol and triglyceride on the percentage difference between the low-density lipoprotein cholesterol concentration measured directly and calculated using the Friedewald formula. Clin Chem Lab Med 2008; 46: 371–5
- Tighe DA, Ockene IS, Reed G, Nicolosi R. Calculated low density lipoprotein cholesterol levels frequently underestimate directly measured low density lipoprotein cholesterol determinations in patients with plasma triglyceride levels ≤ 4.52 mmol/l: an analysis comparing the LipiDirect magnetic LDL assay with the Friedewald calculation. Clin Chim Acta 2006; 365: 236–42
- McFarlane C, Young IS, Hare L, Mahon G, McEneny J. A rapid methodology for the isolation of intermediate-density lipoprotein: characterization of lipid composition and apoprotein content. Clin Chim Acta 2005; 353: 117–25
- Libby P, Nathan D, Abraham K, Brunzell JD, Fradkin JE, Haffner SM, et al. Report of the National Heart, Lung, and Blood Institute-National Institute of Diabetes and Digestive and Kidney Diseases Working Group of Cardiovascular Complications of type 1 diabetes mellitus. Circulation 2005; 111: 3489–93
- Pambianco G, Costacou T, Orchard T. The prediction of major outcomes of type 1 diabetes: a 12 year prospective evaluation of three separate definitions of the metabolic syndrome, and their components and estimated glucose disposal rate: the Pittsburgh Epidemiology of Diabetes Complications Study experience. Diabetes Care 2007; 30: 1248–54
- Gerstein HC, Mann JF, Yi Q, Zinman B, Dinneen SF, Hooqwerf B, et al. Albuminuria and risk of cardiovascular events, death, and heart failure in diabetic and nondiabetic individuals. JAMA 2001; 286: 421–6
- Shoji T, Nishizawa Y, Kawagishi T, Tanaka M, Kawasaki K, Tabata T, et al. Atherogenic lipoprotein changes in the absence of hyperlipidemia in patients with chronic renal failure treated by hemodialysis. Atherosclerosis 1997; 131: 229–36
- Shoji T, Nishizawa Y, Kawagishi T, Kawasaki K, Taniwaki H, Tabata T, et al. Intermediate-density lipoprotein as an independent risk factor for aortic atherosclerosis in hemodialysis patients. J Am Soc Nephrol 1998; 9: 1277–84
- Mäkinen VP, Soininen P, Forsblom C, Parkkonen M, Ingman P, Kaski K, et al. 1H NMR metabonomics approach to the disease continuum of diabetic complications and premature death. Mol Syst Biol 2008; 4: 167
- Barter PJ, Ballantyne CM, Carmena R, Castro Cabezas M, Chapman MJ, Couture P, et al. Apo B versus cholesterol in estimating cardiovascular risk and in guiding therapy: report of the Thirty-Person/Ten-Country Panel. J Intern Med 2006; 259: 247–58
- Pradhan A. Obesity, metabolic syndrome, and type 2 diabetes: inflammatory basis of glucose metabolic disorders. Nutr Rev 2007; 65: 152–6