Abstract
Volume loading is considered the golden standard of the confirmatory tests in the diagnostics of primary aldosteronism (PA). However, it is time‐consuming, and it is unclear to what extent it improves the diagnostics of PA in comparison to simple screening tests. To study this question, the diagnostics with and without oral sodium loading (OSL) were evaluated by receiver operating characteristic curves analyses in 77 consecutive OSL patients. The final diagnosis was essential hypertension in 39 cases and PA in 38 cases, determined by review of the patient records, biochemical tests, imaging findings, and the response to therapy with spironolactone and/or operation. Plasma aldosterone‐to‐renin‐activity ratio (ARR) and daily urinary aldosterone had a good diagnostic ability that did not significantly improve by accomplishing OSL. Cut‐off values with optimal sensitivity and specificity were ≥1050 pmol/l per ng/ml/h for upright ARR, and ≥45 nmol/day for daily urinary aldosterone. To conclude, carefully conducted outpatient tests are sufficient for the diagnostics of PA, when the diagnosis is justified by the positive response to treatment. However, volume loading serves as an additional diagnostic tool in the most problematic cases, improving slightly the discriminative ability of urinary aldosterone determination.
Introduction
Primary aldosteronism (PA) is the most frequent endocrinological cause for secondary hypertension. Traditionally the estimated frequencies have been about 1% in hypertensive patients. However, recent findings mainly based on elevated plasma aldosterone‐to‐renin ratio (ARR) as a screening test, followed by the aldosterone suppression test, show much higher frequencies – ranging from 5% to 13% in hypertensive populations Citation[1–4]. PA is most commonly due to idiopathic hyperaldosteronism (hyperplasia), or aldosterone‐producing adenoma, with rare causes of glucocorticoid‐remediable aldosteronism or adrenocortical carcinoma. In recent decades, there has been a change so that hyperplasia has become the most frequent cause of PA Citation[1]. The diagnostic challenge to recognize PA aims at targeted pharmacological therapy or surgical intervention.
Typically, the diagnosis is suspected by the concomitant occurrence of refractory hypertension and hypokalemia – either spontaneous or diuretic‐induced. However, subjects with aldosterone‐producing adenomas without hypertension do occur Citation[5–8], as well as subjects with normokalemia Citation[2],Citation[9–11]. Commonly, an incidental adrenal mass is encountered Citation[12] and endocrine function tests are warranted.
The diagnostic background of PA leans to the disruption of renin–aldosterone counter‐regulation, leading to an elevated plasma ARR in the presence of aldosterone overload. The conventional diagnostics of PA is three‐phased including screening, confirming, and subtype‐defining procedures. The oral sodium loading (OSL) test has been widely used in the diagnostics in order to obtain confirmation and subtype definition. In PA, aldosterone production is autonomous, and renin–angiotensin–aldosterone regulation is reduced or lacking. The degree of autonomy is measured by means of urinary aldosterone suppression during volume load induced by the OSL test. The lack of aldosterone suppression during the OSL test has been considered quite specific and sensitive for PA Citation[9],Citation[13]. Various screening cut‐offs for ARR have been recommended Citation[4],Citation[13–16]. According to a recent review by Montori et al., the recommendations for cut‐off limits range from 200 to 2774 pmol/l per ng/ml/h Citation[17]. Bravo Citation[9] suggests a 24‐h urinary aldosterone excretion rate of 38.9 nmol/day (14 µg/day) as a diagnostic limit.
The OSL test is a time‐consuming and costly procedure. It has a long tradition, but the studies on its clinical value are scant. Furthermore, the apparent rise in the prevalence figures of PA requires a non‐time‐consuming diagnostic method with high sensitivity and specificity. The aim of our study was to find out whether the OSL test gives extra benefit beyond the “basic” tests in the diagnostics of PA.
Patients and methods
Patients
The study population consisted of all the patients who were admitted for OSL test to the Kuopio University Hospital inpatient department during the years 1987–1999. The patients with the OSL test were identified either from the hand‐registry for endocrinological examinations or from the hospital discharge registry by the ICD (International Classification of Diagnoses) code for hyperaldosteronism, or co‐existing codes for hypertension and hypokalemia (a total of 245 patients). The search on 245 records yielded 77 patients who had undergone an OSL test. Patients had been referred for PA diagnostics work‐up initially by the concomitant occurrence of hypertension and hypokalemia (77%), treatment‐resistant hypertension (16%), spontaneous or diuretic‐induced hypokalemia (5%), or a pathological adrenal imaging finding (3%). The main purpose for the hormonal testing was to distinguish PA from essential hypertension (EH).
Verification of diagnoses
The case history of each patient was carefully studied and the final diagnosis was recorded. Imaging of adrenals was performed by computed tomography in 70%, with magnetic resonance imaging in 9%, and with scintigraphy in 25% of the whole patient group. Radiological imaging of adrenals was performed in 59% of EH subjects and in 97% of PA subjects. In the posture test, the relative increase of plasma aldosterone was greater than 30% in 67% of EH subjects and in 61% of PA subjects, and greater than 50% in 64%/55% before OSL, respectively. When performed after OSL, it was greater than 30% in 64%/55% and greater than 50% in 54%/71%, respectively. The diagnoses were further verified through blind reading the laboratory data and imaging findings separately by two endocrinologists (L.N. and E.V.). The therapeutic responses were evaluated by the control of hypokalemia and improvement of raised blood pressure with simultaneous reduction of used blood pressure medication. The final diagnoses included 39 cases of EH and 38 cases of PA.
Accomplishment of OSL
The OSL test was performed in a uniform mode for all the patients. Estrogen and spironolactone medications were interrupted 4 weeks previously, and other diuretics, angiotensin‐converting enzyme inhibitors, angiotensin II blockers and beta‐blockers were interrupted 2 weeks previously. The OSL consisted of 270 mol (about 16 g) daily sodium and 0.5 mg fludrocortisone once per day for 3 days during the 5‐day stay in hospital. Potassium was supplemented if necessary. The adequacy of sodium loading and potassium supplementation was assured by plasma and urinary determinations of sodium and potassium.
Laboratory data
The laboratory assays () included measurements of plasma potassium and sodium three to five times per hospital stay. The 24‐h potassium and sodium excretion into urinary was assessed before and during OSL. The response to upright posture was evaluated by determining plasma aldosterone and renin activity in a recumbent (at 08.00 h) and in an upright posture (at 12.00 h) before and during OSL. Further, the urinary aldosterone was assessed before and after OSL. As the methodology for plasma and urinary aldosterone measurement was changed in January 1995, the precedent values were converted to correspond to the new reference values. Plasma and urinary aldosterone were determined by radioimmunoassay. They are expressed in picomoles per liter. Plasma renin activity is expressed in nanograms per milliliter per hour.
Table I. Clinical and biochemical characteristics of the patient groups in subjects with essential hypertension (EH) and in subjects with primary aldosteronism (PA).
Statistical methods
Data analyses were conducted with the SPSS for Windows (release 10.0.5, SPSS Inc.). The differences between means of study groups in baseline characteristics were evaluated by Students t‐test with Bonferroni correction. Receiver operating characteristic (ROC) curves Citation[18] were produced for the various laboratory parameters with and without OSL to evaluate their ability to detect PA in the whole study group (). Areas under the curve (AUC) were compared for inferences. Youden's index Citation[19] was calculated to define the cut‐off points with optimal sensitivity and specificity for the various laboratory parameters.
Table II. The diagnostic ability of laboratory parameters to distinguish primary aldosteronism among all patients
Results
Characteristics of the study groups
The basic characteristics [age, gender, body mass index, systolic and diastolic blood pressure, R‐wave amplitude (mV) of connection aVL on ECG, the duration of hypertension] were not significantly different between EH and PA groups. The difference between groups in the lowest plasma potassium during the hospital stay was no more statistically significant after taking account of Bonferroni correction. The levels of ARRs and daily urinary aldosterone were higher in PA group than in EH group both before and after OSL. The differences were statistically significant ().
The diagnostic ability of the laboratory parameters to recognize PA
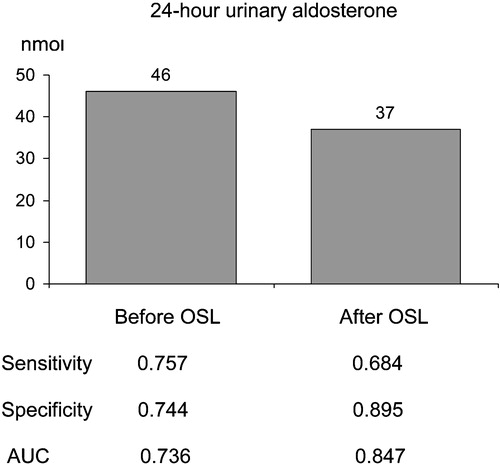
According to the ROC curve analysis, plasma ARRs all had a good diagnostic ability to detect PA (, ), both with good sensitivity and with good specificity. OSL did not improve the discriminative ability of ARRs (AUC at recumbence and upright position 0.794 and 0.830 vs 0.794 and 0.861) (). The excretion rate of urinary aldosterone also had a good diagnostic ability in recognizing PA (, ). OSL improved slightly the discriminative ability of urinary aldosterone (). ARRs in the basal state (before and after posture stimulation) revealed PA more precisely than urinary aldosterone in the basal state (). The ARRs after OSL had about the same discriminative ability as urinary aldosterone after OSL (). The discriminative ability of urinary aldosterone after OSL was slightly better than ARR upright before OSL (). The relative decrease in urinary aldosterone induced by OSL was a poor discriminator for PA compared with the ARRs (). The cut‐off values (pmol/l per ng/ml/h) for ARR suggested by the ROC curve analysis varied according to the posture and the state of volume loading (660 recumbent before OSL, 1050 upright before OSL, 530 recumbent after OSL and 1110 upright after OSL). For the excretion rate of urinary aldosterone (nmol/day), the ROC curve analyses suggested the cut‐off values of 46 before OSL and 37 after OSL ().
Figure 1. Receiver operating characteristics (ROC) curve analyses of the diagnostic ability of plasma aldosterone‐to‐renin activity ratio in recumbent and upright posture, before and after oral sodium loading (OSL).
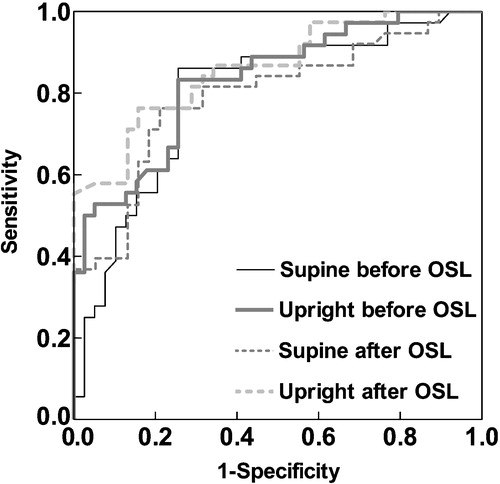
Figure 2. Optimal cut‐off values for plasma aldosterone (pmol/l) to renin activity (ng/ml/h) ratios according to the posture and to the status of the sodium loading (before/after), based on receiver operating characteristics curve analyses. OSL, oral sodium loading. AUC, area under the curve (null hypothesis: true value = 0.5).
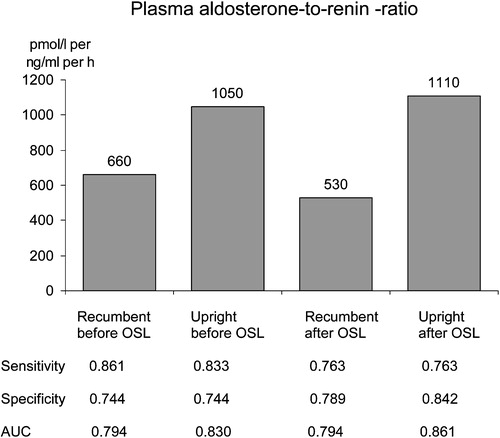
Figure 3. Receiver operating characteristics (ROC) curve analyses of the diagnostic ability of 24‐h urinary aldosterone, before and after oral sodium loading (OSL).
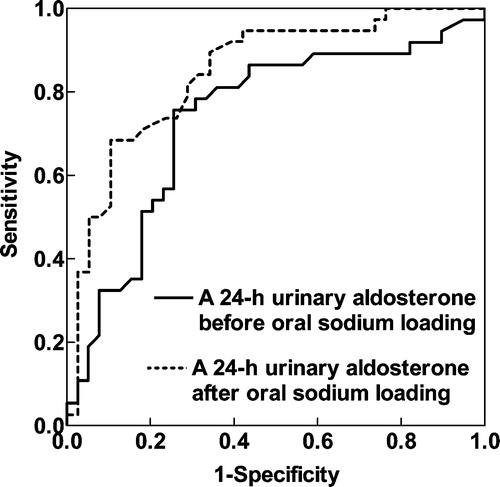
Figure 4. Optimal cut‐off values for 24‐h urinary aldosterone (nmol/day) according to the status of sodium loading (before/after), based on receiver operating characteristics curve analyses. OSL, oral sodium loading. AUC, area under the curve (null hypothesis: true value = 0.5).
Using the combination of upright ARR (>1050 pmol/l per ng/ml/h) and 24‐h urinary aldosterone (>45 nmol/day) without OSL as screening limits, these study subjects yielded two false‐positive PA diagnoses, with normal imaging finding and final EH diagnosis, and one false‐negative PA, with imaging finding suggesting adenoma and with the final histological diagnosis suggesting hyperplasia. Only one of these three false deductions would have been avoided by using OSL test.
Discussion
The main finding was that plasma ARR even without OSL was sensitive and specific for identifying PA. The 24‐h urinary aldosterone also had a good diagnostic ability to differentiate PA from EH, but its discriminatory ability was improved by OSL only slightly. The ROC curve analyses reinforced the importance of ARR determination. The outcome of this study supports the outpatient diagnostic policy. The optimal cut‐off points for ARR seem to be highly dependent on the posture and state of volume loading.
The study group was of a moderate size, but well representative for the catchment area. The ROC curve analyses enabled the comparison of test results before and after OSL test and offered cut‐off values for screening and diagnostic limits. Ranking of the various tests was feasible based on the differences of AUCs.
The drawbacks of this study were the retrospective study design and that selective adrenal vein sampling was not performed. The latter may have lead to misclassification of some cases of true adenomas as hyperplasia. Evidently, this has little affected the main results. It is also conceivable that some patients with final diagnosis of EH may actually have had mild PA. However, the final diagnoses were based both on the biochemical tests and the clinical follow‐up data, and therefore clinically relevant misclassification is not likely.
As the boundary between low‐renin hypertension and adrenal hyperplasia is like a line drawn on the water, we need diagnostic tests identifying those subjects who benefit from treatment with aldosterone antagonist. Among our study subjects, the methods offered by outpatient diagnostics well fulfilled this purpose.
For the screening and the diagnostics of probable PA, we suggest the combination of random upright ARR and a 24‐h urinary aldosterone sample, with screening limits of 1050 (plasma aldosterone as pmol/l and renin activity as ng/ml/h) and 45 (nmol/day) respectively. Thereafter evaluation should proceed by subtype definition and localizing procedures. An OSL test might provide an additional tool for the most problematic diagnostic cases.
References
- Young W. F, Jr. Minireview: Primary aldosteronism – changing concepts in diagnosis and treatment. Endocrinology 2003; 144: 2208–2213
- Loh K. C., Koay E. S., Khaw M. C., Emmanuel S. C., Young W. F. Prevalence of primary aldosteronism among Asian hypertensive patients in Singapore. J Clin Endocrinol Metab 2000; 85: 2854–2859
- Fardella C. E., Mosso L., Gomez‐Sanchez C., Cortes P., Soto J., Gomez L. Primary hyperaldosteronism in essential hypertensives: Prevalence, biochemical profile, and molecular biology. J Clin Endocrinol Metab 2000; 85: 1863–1867
- Lim P. O., Dow E., Brennan G., Jung R. T., MacDonald T. M. High prevalence of primary aldosteronism in the Tayside hypertension clinic population. J Hum Hypertens 2000; 14: 311–315
- Young W. F. Primary aldosteronism: A common and curable form of hypertension. Cardiol Rev 1999; 7: 207–214
- Kono T., Ikeda F., Oseko F., Imura H., Tanimura H. Normotensive primary aldosteronism: Report of a case. J Clin Endocrinol Metab 1981; 52: 1009–1013
- Matsunaga M., Hara A., Song T. S., Hashimoto M., Tamori S., Ogawa K. Asymptomatic normotensive primary aldosteronism. Case report. Hypertension 1983; 5: 240–243
- Vantyghem M. C., Ronci N., Provost F., Ghulam A., Lefebvre J., Jeunemaitre X. Aldosterone‐producing adenoma without hypertension: A report of two cases. Eur J Endocrinol 1999; 141: 279–285
- Bravo E. L., Tarazi R. C., Dustan H. P., Fouad F. M., Textor S. C., Gifford R. W. The changing clinical spectrum of primary aldosteronism. Am J Med 1983; 74: 641–651
- Conn J. W., Rovner D. R., Cohen E. L., Nesbit R. M. Normokalemic primary aldosteronism. A detectable cause of curable “essential” hypertension. Am J Med 1965; 193: 111–116
- Gordon R. D. Primary aldosteronism. J Endocrinol Invest 1995; 18: 495–511
- Kloos R. T., Gross M. D., Francis I. R., Korobkin M., Shapiro B. Incidentally discovered adrenal masses. Endocr Rev 1995; 16: 460–484
- Blumenfeld J. D., Sealey J. E., Schlussel Y., Vaughan E. D., Sos T. A., Atlas S. A. Diagnosis and treatment of primary hyperaldosteronism. Ann Intern Med 1994; 121: 877–885
- Gallay B. J., Ahmad S., Xu L., Toivola B., Davidson R. C. Screening for primary aldosteronism without discontinuing hypertensive medications: Plasma aldosterone–renin ratio. Am J Kidney Dis 2001; 37: 699–705
- Lins P. E., Adamson U. Plasma aldosterone–plasma renin activity ratio. A simple test to identify patients with primary aldosteronism. Acta Endocrinol (Copenh) 1986; 113: 564–569
- Weinberger M. H., Fineberg N. S. The diagnosis of primary aldosteronism and separation of two major subtypes. Arch Intern Med 1993; 153: 2125–2129
- Montori V. M., Young W. F Jr. Use of plasma aldosterone concentration‐to‐plasma renin activity ratio as a screening test for primary aldosteronism. A systematic review of the literature. Endocrinol Metab Clin North Am 2002; 31: 619–632, xi
- Hilden J., Glasziou P. Regret graphs, diagnostic uncertainty and Youden's Index. Stat Med 1996; 15: 969–986
- Biggerstaff B. J. Comparing diagnostic tests: A simple graphic using likelihood ratios. Stat Med 2000; 19: 649–663