
Abstract
A better knowledge of prevalence, management and determinants of hypertension is needed in regions in epidemiological transition to adapt the strategies of public health screening and prevention, and to reduce the burden of cardiovascular diseases. We conducted a prospective cohort study including 4610 participants aged between 18 and 69 years and representative of the general population of La Réunion, a French overseas island located in the western Indian Ocean. The median time between inclusion and follow-up was 7.4 years. Blood pressure data at baseline and follow-up of 3087 participants were analyzed. We found a high prevalence of hypertension, especially in women (36.7% [34.5–39.0]) and in men (40.3% [37.6–43.0]) and in the under 30s (17.1% [14.0–20.5]), with an increase of 10% at follow-up. Treatment rates were very low in men (19.5% versus 39.1% in women) as was awareness of their condition (25.7% versus 44.6%). Blood pressure control rates were similar (18% at baseline and 34% at follow-up for both sexes). Diagnosis of hypertension at follow-up among subjects normotensive at baseline was independently associated with obesity at baseline (relative risk (RR) = 1.40 [1.12–1.75] for BMI between 27 and 30 kg/m2 and 1.72 [1.33–2.25] for BMI ≥30 kg/m2 as compared with BMI <27 kg/m2) and HbA1C (RR =1.12 [1.05–1.19] per %), suggesting a prominent role of insulin resistance in our population. Our study provides original data that cannot be assimilated to any existing model and should guide the implementation of original community-based programs in such countries.
Introduction
Poor control of hypertension is a major cause of cardiovascular mortality including in developing countries. According to international guidelines, reducing the burden of cardiovascular diseases is mainly based on prevention, screening and management of major cardiovascular risk factors, hypertension being the foremost among them. This strategy implies that we have suitable indicators to allow treatment (pharmacological or lifestyle) but also prevention to best fit the epidemiological characteristics of hypertension in the target population. Since the early days of research on hypertension, important disparities in hypertension risk have been found, according to the living area,[Citation1] social status or to the origin of ancestries,[Citation2] including in multiracial societies.[Citation3] Most of the countries where these studies were conducted are now fully industrialized, especially the USA, and few recent data exist on prevalence, control and their changes over time in areas witnessing a rapid epidemiologic and demographic transition and also having a high quality healthcare system.
La Réunion is a French overseas island located in the western Indian Ocean about 800 km east of Madagascar. It has a population of 845 000 inhabitants (2014 census) and a surface area of 2504 km2. La Réunion has been a French colony settled by different peoples arriving in successive waves between the 17th and the 20th centuries. The population is therefore composed of varied ethnic origins, mainly descending from northern or southern India, east Africa, Madagascar, China and mainland France. All of the ethnic groups comprising the island’s population are immigrant populations since the island was originally uninhabited. Over the past decades, La Réunion has been involved in an accelerated epidemiologic transition including a doubling of the population within 50 years, aging, rapid urbanization, socioeconomic changes favoring sedentary habits, weight gain, alcohol consumption, salt intake and others.[Citation3,Citation4] The same period saw the implementation of a high standard of health care, with a “universal” health insurance system available regardless of patient’s income, comparable to that of mainland France. However, the reported prevalence and incidence of cardiovascular disease or renal insufficiency appear to be very high and there is no published data due to the lack of reliable indicators and so the reasons for these high incidences are not fully understood.[Citation5] Similar findings seem to exist concerning risk factors since diabetes is also two to three times more frequent in the French overseas territories in the Indian Ocean than in France.[Citation6] All these characteristics, coupled with the lack of data on hypertension in the general population, make La Réunion a suitable model for study on hypertension in such settings. Moreover, a better knowledge of the outcome of screened hypertensives in the population should help to assess and guide community-based policies and programs.
The aim of the present study was therefore to estimate the prevalence of hypertension in the general population in La Réunion and to study the middle-term outcome of blood pressure (BP) control and the further management subjects with or without hypertension.
Methods
Study design
The RÉunion DIAbetes (RÉDIA) study is a population-based prospective cohort study. Participants were enrolled from May 1999 to September 2001 and the follow-up examination took place from April 2006 to June 2009.
Study population and data collection
First, a representative sample was drawn from the general population of La Réunion. Participants were recruited between 1999 and 2001. The target population was defined as men and women aged 18–69 years, born in La Réunion or having lived for at least 10 years in the island, free of life threatening chronic disease or disability preventing moving. We used a three level random sampling design. First, three areas were selected for their geographic and demographic representativeness. In each area, a number of islets of population (28 in St Pierre, 39 in Le Tampon, 31 in St André), as defined by the National Institute of Statistics and Economic Studies (INSEE), were selected at random. A technician in charge of recruitment visited every household of the selected islet. Men and women aged 18–69 years who fulfilled the inclusion criteria were systematically asked to participate in the survey. Inclusions were conducted in two steps: first 3599 subjects aged 30–69 years and then, given the early age of onset in type 2 diabetes found among surveyed participants, 1011 extra subjects aged 18–29 years were included. Overall, 4610 subjects (2017 men and 2593 women) entered the screening study, representing a participation rate of 78% in females and 83% in males. A trained medical staff following standardized methods screened subjects at home. Participants filled out a questionnaire during a face-to-face interview. Information was collected on demographic variables, the existence of known diabetes or hypertension and current medical treatments. A physical examination was performed including blood pressure measurement and standardized anthropometric measurements (weight, height, waist and hip circumferences). Capillary blood glucose (cBG) was measured with glucose strips and interpreted immediately with a reflectance meter (One Touch II, Life-Scan, Ortho diagnostics, Milpitas, CA). Glycated hemoglobin (HbA1c) was also systematically measured (DCA 2000, Ames, Bayer Diagnostics, Basingstoke, England) as well as looking for proteinuria. Among the 4610 screened subjects, 1005 subjects were subsequently invited to come to a health center for diabetes diagnosis by an oral glucose tolerance test (OGTT), further examination and a larger data collection. These subjects were recruited on the basis of their glycemic status (316 known diabetics, 369 suspected diabetic and 320 controls). In this article, we only used the data from the initial whole sample (n = 4610), considered as fully representative of the general population. Ethical committee agreement was obtained and each recruited subject gave written informed consent. Results of a cross-sectional analysis of the prevalence of diabetes in this sample have been published before.[Citation7] In this report, we present the results of the longitudinal analyses.
BP measurement and definitions
BP was measured with a validated automatic device (Digital Blood Pressure Monitor HEM-907 OMRON Healthcare Co, Kyoto, Japan), after 5 min of rest in the sitting position, with a cuff of dimensions appropriate to arm size, and with the arm at heart level. Hypertension was defined either as known hypertension with current antihypertensive treatment or as a BP of at least 140/90 mmHg. Participants were considered to be aware of their hypertension if they answered “yes” to the question “have you ever been told that you had hypertension”. Treatment of high BP was defined by the use of any antihypertensive drug within the past 15 days. Hypertension was considered to be controlled among treated individuals when systolic BP was <140mmHg and diastolic BP was <90 mmHg, including for diabetic individuals.
The criteria for type 2 diabetes mellitus were based on the American Diabetes Association (ADA) guidelines [Citation8] (fasting plasma glucose level ≥126 mg/dL or glycosylated hemoglobin value of 6.5% or greater). Subjects reporting any antidiabetic treatment (injected or oral) were also considered as diabetic. To ensure comparability along the survey and transposability, we used this definition even if the ADA guidelines were not implemented at the time of the inclusion examination. Obesity was defined as a body mass index (BMI) of 30 kg/m2 or above.
Follow-up
The follow-up of the REDIA study took place between 2006 and 2009. Participants were first contacted again by phone to confirm their agreement, and to arrange an appointment for a home visit. Subjects with normal initial fasting glycemia (n = 2618) were visited at home by a trained nurse and an investigator after having given informed written consent. Socioeconomic and lifestyle data were collected through an individual interview. All the subjects underwent the same standardized physical examination as at baseline, including anthropometric and BP measurements and arterial auscultation. They had cBG and HbA1c measurements as well as urinary tests (proteinuria and microalbuminuria). Subjects with diabetes or with suspect glycemic values at inclusion (n = 478) were invited to go directly for an examination to a health center, created for the purpose of the study. In the latter case, data were collected by a physician, a nurse and an investigator and included a wider variety of data. Participants with abnormal glycemia or HbA1c results at screening were also invited for a supplementary examination (n = 998, total subsample for supplementary examination = 1476). The median follow-up time was 7.4 years (interquartile [7–8 years]).
Among surviving subjects potentially available for follow-up, 624 refused to participate in the survey (overall participation rate for follow-up 83.3%).
Statistical analysis
Since there were only two BP measurements in our cohort study (i.e at inclusion and at follow-up), the date of the onset of hypertension was impossible to determine. Moreover, blood pressure increase is a continuous process and for these reasons it was not possible to run survival analyses for censored data. Data are expressed as means ± SD for continuous variables with normal distribution or as n (%) for proportions. For continuous variables with non-normal distribution, we presented medians and interquartile intervals. Comparisons between groups were evaluated using analyses of variance after normality assumption was verified or by chi square tests. The prevalence rates are given with 95% confidence intervals. Confidence intervals were computed based on logit transformations. Logistic regressions were used to study the cross-sectional associations between the onset of hypertension and potential explicative variables. Poisson regression analysis was used to compare incidence rates of hypertension according to potential predictive variables. Data were analyzed using the STATA 13.0 statistical software (Stata Corporation, College Station, TX).
Results
A schematic participant flow diagram is given in . The initial response-rate was 83% yielding a total of 4610 participants for inclusion in the study at baseline. Of these, 700 were lost to follow-up, another 665 refused to participate in the follow-up, 149 had died and nine were excluded because BP was not recorded. This excluded population was younger (39.3 years versus 41.8 years, p < 0.001) with a higher proportion of men (47.4% versus 41.9%, p < 0.001). The final study population was composed of 3087 participants. The main characteristics of included subjects are given in . The mean age was 42 years at inclusion. As described elsewhere,[Citation7] we found a high prevalence of diabetes and of phenotypic markers classically associated with insulin resistance. During the survey period, participants gained weight and their waist circumference, HbA1C and BP increased.
Figure 1. Flow chart of participants in the REDIA cohort.
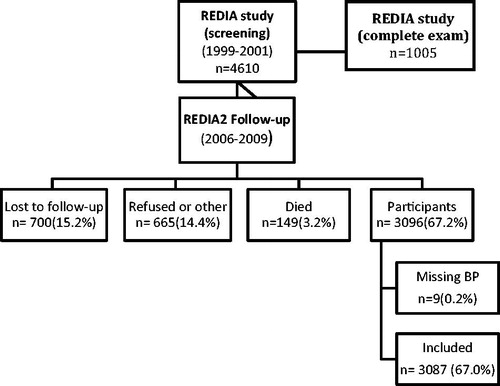
Table 1. Characteristics of participants.
Prevalence of hypertension, awareness, treatment and control at inclusion
The prevalence rates of hypertension are given in . The initial overall prevalence of hypertension was 38.2% [36.5–40.0] and ranged from 12.3% [8.9–16.4] in women under 30 to 71.8% [63.2–79.3] in men above 60. The prevalence of hypertension was higher in men up till the age of 40 with a non-significant trend toward a higher prevalence in women thereafter. Awareness, treatment and control of hypertension at baseline are shown in . Only 19.5% of hypertensive men and 39.1% of women were treated at baseline (p < 0.001) and, among them, only about 18% were considered as having controlled hypertension, with no important sex difference.
Table 2. Prevalence of hypertension at baseline according to age and sex in the REDIA study (3087 participants).
Table 3. Prevalence, awareness, treatment and control of hypertension at baseline and follow-up (3087 participants, median follow-up of 7 years).
Follow-up and outcome according to hypertensive status
Participants were aged 23–78 years at follow-up. Data on prevalence and management of hypertension at follow-up are presented in and and . The absolute overall prevalence of hypertension increased in our sample by 10% in both men and women during the survey time. In the same period, the rate of treated subjects also increased by around 15% and the proportion of treated subjects considered as controlled, also by 15%. At follow-up, women seemed to be more aware of their hypertension than men (58.9% vs. 42.6%, p < 0.001). Among non-hypertensive subjects at baseline, 30.7% were considered hypertensive at follow-up (34.5% of men and 28.1% of women), among them 78.8% received no antihypertensive treatment; only 8.9% of these subjects were aware they had hypertension.
Figure 2. Outcome of participants according to the presence of hypertension at baseline.
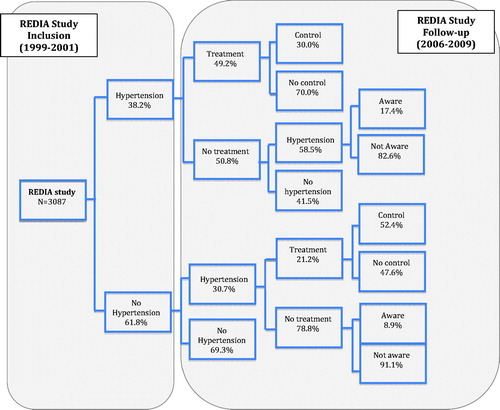
Table 4. Status concerning the existence and treatment of hypertension at follow-up according to the status at baseline in the REDIA study (3087 participants).
Concerning subjects with hypertension at inclusion, 78.9% were subsequently considered hypertensive at follow-up. Among the subjects who were hypertensive at baseline without treatment at follow-up, 58.5% were still hypertensive at follow-up. Seventy percent of untreated hypertensive subjects at inclusion were still categorized hypertensive at follow-up. Among those already treated for hypertension at inclusion, 93.7% were still treated at the end of the study with a higher control rate (33.9% vs. 18.1% at inclusion). The majority of newly diagnosed subjects (no hypertension at baseline and hypertension at follow-up) were untreated (79%).
Relation with diabetes and obesity
At baseline, diabetic subjects (previously diagnosed or not) were more likely to be hypertensive (OR = 4.10 [3.28–5.12]), as were obese subjects (OR = 3.7 [2.9–4.6]). Multivariate analysis of factors associated with hypertension at inclusion is presented in and confirms the role of age, sex, obesity and HbA1C. The factors independently associated with the onset of hypertension at follow-up in longitudinal analyses are given in . HbA1C and BMI at baseline were both associated with the subsequent diagnosis of hypertension, including after adjustment for sex, age and educational level. There was no statistically significant interaction between BMI and HbA1c in this model.
Table 5. Factors associated with hypertension at baseline among 3087 participants.
Table 6. Factors associated with hypertension at follow-up (mean 7 years) among 2907 non-hypertensive persons at baseline in the REDIA study.
Discussion
Prevalence of hypertension
This study is the first to report the burden and the management of hypertension in La Réunion. Overall, we found a prevalence of hypertension of 38% at baseline and 49% at in our cohort (age range 18–69 years) after a mean follow-up of 7 years.
Comparing prevalence between different populations requires an adapted methodology, in particular taking into account the age structure of the underlying populations. Age-standardization was not required in our study since the age structure of our sample is already representative of the age structure of the general population of La Réunion, as defined by data from the last national census. This prevalence is globally much higher than the one reported in mainland France or in some other European countries, and this difference is particularly striking for women. For example, in the IHPAF study,[Citation9] 27% of men and 15% of women were hypertensive (one visit definition, same age range, same period) versus 40% and 31% in our study. In the group aged 35–64 years, hypertension prevalence in our study was about 45% in both men and women versus 41% in men and only 27% in women from the French general population using the same definitions.[Citation10] Our prevalence rate was also higher than in other French overseas territories (29% in Guadeloupe, 28% in Martinique, 18% in Guyana, 25% in French Polynesia).[Citation11] These territories are located in different geographic areas (Atlantic or Pacific Ocean) and have different ethnic origins. In other countries located in the Indian Ocean, results more similar to ours have been reported: i.e. a prevalence of 27% (1987) and 41% (2009) in Mauritius [Citation12] and a prevalence of 40% (1989) and 40% (2004) in the Republic of Seychelles.[Citation13] Another original result is the high prevalence in young subjects: we found a prevalence in the under 30s of 24% in men and 12% in women (respectively 9% and 2% in the French Caribbean [Citation14]). Similar results were found in Mayotte, another French overseas territory in the Indian Ocean located 1500 km from La Réunion, where 33% of the youngest age group (30–39 years) were hypertensive.[Citation15]
This high prevalence of hypertension may be due to socioeconomic disparities and to health inequalities since La Réunion is an area where high rates of unemployment or precarious employment are observed and where 42% of the population lives under the poverty threshold. Unfortunately, due to the practical difficulties of carrying out our study at home, few data were recorded for the whole sample at inclusion and this limited information was not detailed enough to permit discussion and clarification of the role of socioeconomic conditions. Nevertheless, as expected, the prevalence of hypertension varies in our study by a factor of two across educational level groups.
The role played by ethnic origins is also complex and needs to be discussed. The excess of hypertension among blacks has been recognized since early in the past century and explains a substantial portion of the black health disadvantage.[Citation16] In multiracial societies, particularly in the USA, many studies also found a higher prevalence of hypertension among persons of African origin compared to those of Caucasian descent.[Citation17] The causes of this black-white disparity are still debated and are not fully understood. Several explanations have been proposed and a well-developed theoretical framework supports a role for chronic exposure to racial discrimination as a pathway to hypertension.[Citation18] Other research on the African diaspora has also demonstrated that particular environmental exposure is required to induce a high rate of hypertension occurrence.[Citation19] Moreover, several studies conducted in other multiracial societies found no or only a weak association between hypertension and ethnic origins.[Citation20,Citation21] In our study, because of the high rate of interbreeding in the island, and because French laws limit the use of ethnic data in population surveys, ethnicity could not be included in this report and it is therefore impossible to contribute to this debate. Nevertheless, given the great ethnic intermixing in La Réunion, we do not think that an African origin of the participants can explain our high prevalence rates.
Management and outcome
Proportions of pharmacological treatment and control rates were overall 30% and 18%. Pharmacological treatment was more frequently observed in women with no difference in control rate and improved at follow-up by more than 30%. Better control rates in women have already been described before and in various populations, including in mainland France,[Citation9,Citation22] but this was not the case in our study. Different hypotheses have been raised, including differences in vascular wall properties or in the susceptibility to antihypertensive drugs. We also think that some sociocultural factors may be involved in La Réunion, such as a higher frequency of medical appointments and a better health preoccupation in women. The improvement in control rates may be due to an awareness effect of the inclusion visit, the implementation of prevention population strategies or an improvement of the local health system over the time of the survey.
Our results also show a positive and significant association between BMI and diabetes on the one hand and prevalence and incidence of hypertension on the other. Our data are consistent with cross-sectional studies from Guadeloupe [Citation11] and confirm this association in longitudinal analyses.
Limitations
The main limitation in our study is the definition of hypertension. Recommendations of experts indicate the need for measuring BP levels on several occasions before the diagnosis of hypertension is accepted. Important changes have been described in previous epidemiological studies when hypertension is defined on the basis of BP assessed by two different measurements. A poorer BP control has been shown in a one-measure assessment as compared with 24-h ambulatory BP measurement.[Citation23] On the other hand, estimates of prevalence can be expected to be higher with a single measurement. In the present study, a subsample of 1476 subjects had two standardized BP measurements at follow-up. This sub-sample was not considered as representative of the general population because enrollment depended on their glycemic status. In this group, the estimated prevalence was 42.2% using a single BP definition, and 40.3% using a two BP definition. As expected, a single measure overestimated the prevalence, but to a lesser extent than in previous studies [Citation9,Citation14] and we think that this limitation cannot explain the gender differences we observed. Moreover, 98% of treated subjects at baseline were still considered hypertensive at follow-up.
A second problem should be underlined in the definition of hypertension. As in most studies, a person being treated with BP lowering drugs is considered hypertensive. Overtreatment of hypertension could therefore have led to an overestimation in the prevalence of hypertension. This has already been described particularly among young subjects.[Citation24] Moreover, in our study, this could account for a part of an increase in the frequency of hypertension in the follow up of our sample by an increase in the proportion of treated hypertension (by one third). Thus, the longitudinal increase in the prevalence of hypertension with this widely accepted definition is not strictly equivalent with incident cases and therefore we did not use the term “incidence”. An increase in the prevalence is therefore not necessarily a negative finding and should be handled with caution for population-based strategy implementation.
Strengths
The strengths of this study include the large representative sample of the general population in a complex environment, the prospective design of the study, and the lack of available data in this area. Moreover, subjects were not included in their workplace but at home, unlike in previous studies in mainland France or in Caribbean islands.[Citation9,Citation14] Although this made the practical execution of the study more difficult, it nevertheless allowed us to avoid a potential “healthy worker effect” bias in a population where the unemployment rate in remarkably high (30%, more than in mainland France). Lastly, we were also able to avoid in our study a commonly observed bias due to seeking care since the participants were freely visited at home and did not have to be affiliated with any health insurance to be included.
Clinical implications
In summary, our study provides original indicators in a population in epidemiological transition with a high standard of health care, which has not been studied before. We found in our study high absolute prevalence rates of hypertension, especially in younger subjects, with very little difference between men and women, and this was confirmed at follow up with an important proportion of onset of hypertension. Our study also points out major gender-related issues in the prevalence as well as in the treatment, awareness and outcome, such as a higher prevalence of hypertension in women after 50 and a low awareness and very low treatment rate in men despite a universal health insurance system. We also found significant cross-sectional and longitudinal associations between obesity, diabetes and hypertension suggesting a possible role of insulin resistance in our population.
In spite of several similarities with other published data, our results cannot be assimilated to any existing population model. This points to the need to dispose precise and complete epidemiological data in regions experiencing recent emergence of cardiovascular risk factors in order to guide the implementation of adapted strategies of prevention.
Acknowledgements
The authors would like to thank Dr Mary Osborne-Pellegrin for help in editing this manuscript.
Disclosure statement
The authors report no conflicts of interest. The authors alone are responsible for the content and writing of this article.
References
- Global Burden of Disease Study 2013 Collaborators. Global, regional, and national incidence, prevalence, and years lived with disability for 301 acute and chronic diseases and injuries in 188 countries, 1990-2013: a systematic analysis for the global burden of disease study 2013. Lancet. 2015;386:743–800.
- Cooper R, Cutler J, Desvigne-Nickens P, et al. Trends and disparities in coronary heart disease, stroke, and other cardiovascular diseases in the United States: findings of the national conference on cardiovascular disease prevention. Circulation. 2000;102:3137–3147.
- Cooper RS, Forrester TE, Plange-Rhule J, et al. Elevated hypertension risk for African-origin populations in biracial societies: modeling the epidemiologic transition study. J Hypertens. 2015;33:473–480.
- Aubert L, Bovet P, Gervasoni JP, et al. Knowledge, attitudes, and practices on hypertension in a country in epidemiological transition. Hypertension. 1998;31:1136–1145.
- Stengel B, Jaussent I, Guiserix J, et al. High prevalence of chronic kidney disease in La Reunion island and its association with the metabolic syndrome in the non-diabetic population: La Reunion diabetes (REDIA) study. Diabetes Metab. 2007;33:444–452.
- Papoz L. Type 2 diabetes mellitus in the French overseas departments and territories: the syndrome of Nauru. Diabetes Metab. 2002;28:505–507.
- Favier F, Jaussent I, Moullec NL, et al. Prevalence of Type 2 diabetes and central adiposity in La Reunion island, the REDIA study. Diabetes Res Clin Pract. 2005;67:234–242.
- American Diabetes Association. Diagnosis and classification of diabetes mellitus. Diabetes Care. 2010;33:S62–S69.
- Lang T, de Gaudemaris R, Epidemiology Group of the Societe Francaise d'Hypertension Artérielle and the IHPAF Working Physicians Group, et al. Prevalence and therapeutic control of hypertension in 30,000 subjects in the workplace. Hypertension. 2001;38:449–454.
- Wagner A, Sadoun A, Dallongeville J, et al. High blood pressure prevalence and control in a middle-aged French population and their associated factors: the MONA LISA study. J Hypertens. 2011;29:43–50.
- Inamo J, Daigre JL, Boissin JL, et al. High blood pressure and obesity: disparities among four French overseas territories. J Hypertens. 2011;29:1494–1501.
- Magliano DJ, Soderberg S, Zimmet PZ, et al. Explaining the increase of diabetes prevalence and plasma glucose in Mauritius. Diabetes Care. 2012;35:87–91.
- Bovet P, Romain S, Shamlaye C, et al. Divergent fifteen-year trends in traditional and cardiometabolic risk factors of cardiovascular diseases in the Seychelles. Cardiovasc Diabetol. 2009;8:34.
- Inamo J, Lang T, Atallah A, et al. Prevalence and therapeutic control of hypertension in French Caribbean regions. J Hypertens. 2005;23:1341–1346.
- Solet JL, Baroux N, Pochet M, et al. Prevalence of type 2 diabetes and other cardiovascular risk factors in Mayotte in 2008: the MAYDIA study. Diabetes Metab. 2011;37:201–207.
- Cooper R, Rotimi C. Hypertension in blacks. Am J Hypertens. 1997;10:804–812.
- Comstock GW. An epidemiologic study of blood pressure levels in a biracial community in the southern United States. 1956. Am J Epidemiol. 1995;141:584–628.
- Krieger N, Sidney S. Racial discrimination and blood pressure: the CARDIA Study of young black and white adults. Am J Public Health. 1996;86:1370–1378.
- Cooper R, Rotimi C, Ataman S, et al. The prevalence of hypertension in seven populations of west African origin. Am J Public Health. 1997;87:160–168.
- Ordunez P, Munoz JL, Espinosa-Brito A, et al. Ethnicity, education, and blood pressure in Cuba. Am J Epidemiol. 2005;162:49–56.
- Sichieri R, Oliveira MC, Pereira RA. High prevalence of hypertension among Black and Mulatto women in a Brazilian survey. Ethn Dis. 2001;11:412–418.
- Wolf-Maier K, Cooper RS, Kramer H, et al. Hypertension treatment and control in five European countries, Canada, and the United States. Hypertension. 2004;43:10–17.
- Mancia G, Sega R, Milesi C, et al. Blood-pressure control in the hypertensive population. Lancet. 1997;349:454–457.
- Myers MG, Reeves RA, Oh PI, et al. Overtreatment of hypertension in the community? Am J Hypertens. 1996;9:419–425.