
Abstract
Objectives: High-normal blood pressure and visit-to-visit blood pressure variability are common in clinical settings. They are associated with cardiovascular outcomes. No population based studies have assessed the association between these two phenomena. Our objective was to test the relationship of high-normal blood pressure with visit-to-visit blood pressure variability.
Design: A cross-sectional study.
Methods: We used data from the cross-sectional Third National Health and Nutrition Examination Survey to test the relationship between high-normal blood pressure and visit-to-visit blood pressure variability; we conducted multivariable regression analyses to evaluate the relationship between these two variables.
Results: The analysis included 6,071 participants. The participants’ mean age was 37.16 years. The means of visit-to-visit systolic and diastolic blood pressure variability were 5.84 mmHg and 5.26 mmHg. High-normal blood pressure was significantly associated with systolic and diastolic blood pressure variability (p values <0.05).
Conclusions: High-normal blood pressure is associated with visit-to-visit blood pressure variability. Additional research is required to replicate the reported results in prospective studies and evaluate approaches to reduce blood pressure variability observed in clinical settings among patients with high-normal blood pressure to reduce the subsequent complications of blood pressure variability.
Introduction
High-normal blood pressure (HNBP) and visit-to-visit blood pressure variability (VVBPV) are two phenomena related to arterial blood pressure.[Citation1,Citation2] HNBP – defined as systolic blood pressure (SBP) > 120 to < = 139 mmHg or diastolic blood pressure (DBP) > 80 to < = 89 mmHg – is common in the USA; its prevalence in the American population is about 37%.[Citation3] HNBP has clinical significance. First, it is associated with cardiovascular morbidity, such as ischemic heart disease, stroke, peripheral vascular diseases, and cardiovascular mortality.[Citation4–6] Second, it is also linked to renal failure and impairment.[Citation7–10]
Epidemiologic studies showed the following results: First, VVBPV is a non-random phenomenon;[Citation11] blood pressure undergoes profound and spontaneous oscillations over time. Second, VVBPV is common among hypertensive patients.[Citation1] Third, VVBPV is significantly associated with several cardiovascular outcomes: ischemic heart disease, heart failure, stroke, peripheral vascular diseases and cardiovascular mortality.[Citation12–19] Researchers reported a significant positive relationship between hypertension and VVBPV;[Citation19] however, to our knowledge, investigators have never tested the relationship between HNBP and VVBPV in a representative sample before. Thus, we analyzed NHANES III data to explore the relationship between these two conditions.
Materials and methods
Between 1988 and 1994, the National Center for Health Statistics conducted the Third National Health and Nutrition Examination Survey (NHANES III). This cross-sectional study consisted of a multistage, stratified, clustered probability sample of the civilian non-institutionalized US population. Appropriate probability sampling weights were assigned to produce correct population estimates. We used these weights while we were analyzing the data to produce unbiased national estimates.
Measurement of arterial blood pressure
NHANES III consisted of the following team members: trained Research Assistants (RAs) administered a standardized questionnaire to the study participants at their homes; and physicians examined them (participants) in a Mobile Examination Center (MEC). The RAs and the physicians measured participants’ blood pressure by mercury sphygmomanometer; the study participant was sitting all the way to the back of the chair so that his/her spine is straight according to the standardized blood pressure measurement protocols as the American Heart Association recommended. Blood pressure was measured three times during the in-home interview (first visit) and three additional times during the MEC visit (second visit). The RAs and the physicians waited at least 1 min between readings. The MEC visit was scheduled within 1 month of the in home interview. Additional details regarding blood pressure measurement and quality-control procedures are provided in the NHANES III manual of operations (http://www.cdc.gov/nchs/data/nhanes/nhanes3/cdrom/nchs/manuals/bpqc.pdf). We used participants’ arterial blood pressure to assign them to one of the following groups: [Citation1] normotensive group: SBP < =120 mmHg, DBP < = 80 mmHg; [Citation2] high-normal blood pressure group: SBP >120 – 139 mmHg, DBP >80 < = 89 mmHg. We used standard deviation as the only indicator for blood pressure variability because a recent study has revealed that intra-individual visit-to-visit gauged by standard deviation is tightly correlated with the other measures.[Citation20] We calculated the following measures: [Citation1] the average systolic blood pressure of each visit (A1, A2), Ai = (systolic blood pressure reading1 + reading2 + reading3)/3;} [Citation2] the mean systolic blood pressure of the two visits, x = (A1, A2)/2; [Citation3] the standard deviation (a measure of systolic blood pressure variability), . We reused the previous formulas to calculate diastolic blood pressure variability.
Measurements of metabolic cardiovascular risk factors
In the MEC, a fasting venous blood specimen was drawn from each participant according to a standardized protocol: [Citation1] Plasma glucose was measured, at the University of Missouri Diabetes Diagnostic Laboratory, by using a hexokinase enzymatic method. [Citation2] Total cholesterol, high-density lipoprotein cholesterol (HDL), low-density lipoprotein cholesterol and triglycerides were measured at other centralized laboratories. We used the Adult Treatment Panel III guidelines to define the following medical conditions: low HDL, HDL <40 mg/dl for men and <50 mg/dl for women; high triglycerides, triglycerides >150 mg/dl; impaired blood glucose, fasting blood glucose >100 mg dl; large waist circumference >102 cm for men and >88 cm for women. For each participant, we added up his/her metabolic cardiovascular risk factors—diabetes mellitus or impaired blood glucose concentration, large waist circumference, high triglycerides, high LDL and low HDL—to create a new composite variable (number of metabolic cardiovascular risk factors).
Data collection of other risk factors
We used cotinine concentration in the blood—a metabolite of nicotine—to classify participants into groups of current and non-current smokers. We defined current smokers as those who had cotinine levels >3 ng/ml; whereas those with serum cotinine < = 3 ng/ml were classified as non-current smokers. Self-reported data collected at the home interview relevant to the proposed analysis include demographics (age, sex and race).
Statistical analysis
We included the following individuals in the statistical analysis: (A) Persons who had complete information on three arterial blood pressure readings obtained during the in-home visit and the additional three readings that were documented in the MEC visit. (B) Individuals who had SBP < =139 mmHg; and DBP < = 89 mmHg. (C) Individuals who fasted for at least 8 h. We used Stata version 12 to calculate study estimates; we also used probability weights, so that these estimates reflect the general US population. We tested the fitness of the study outcome (systolic and diastolic blood pressure variability) for normal, gamma and log-normal distributions; goodness-of-fit tests showed that the gamma distribution was the best fitting distribution to our study outcome.
We calculated the mean systolic blood pressure variability and its standard errors under the gamma distribution. We conducted univariate generalized linear model (gamma family; identity link) to evaluate the effect of age, sex, race, smoking, and metabolic cardiovascular risk factors on systolic blood pressure variability separately. Then, we fit a multivariable model; we included the following covariates in this model: age, sex, race, number of cardiovascular risk factors and smoking—family, gamma; link, identity—to adjust for their effect while assessing the effect of HNBP on systolic blood pressure variability. We set the significance level of all the analyses at 5%. We repeated the previous statistical steps to test the relationship between HNBP and diastolic blood pressure variability.
Results
The study included 6071 participants. Their mean age was 37.16 years. The means of visit-to-visit systolic blood pressure variability (VVSBPV) and visit-to-visit diastolic blood pressure variability (VVDBPV) were 5.84 and 5.26 mmHg. Females, smokers, participants with HNBP and older people tended to have larger VVSBPV (); in addition, VVPBP increased as the number of metabolic cardiovascular risk factors increased (). In the unadjusted analysis, the following variables were significant predictors of VVSBPV: HNBP, age, sex and the number of metabolic cardiovascular risk factors (). In the adjusted analysis, the previous variables remained significant predictors of VVSBPV (). In regard to VVDBPV, participants with larger VVDBPV were more likely to have HNBP, smokers, females and black (). In the unadjusted analysis, the following variables were significant predictors of VVDBPV: HNBP, smoking, sex and race (). In the adjusted analysis, the following variables were the only significant predictors of VV DBPV: HNBP, smoking and race (). As shown in , the study participants with HNBP had greater adjusted means of VVSBPV (6.61 mmHg) and VVDBP variability (5.49 mmHg) than normotensive participants: VVSBPV, 5.75 mmHg; VVDBPV, 5.10 mmHg.
Figure 1. Adjusted means of VVSBPV and VVDBPV of high-normal and normal blood pressure groups.
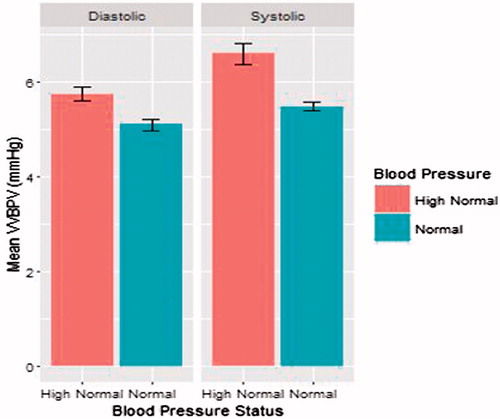
Table 1. The relationship between blood pressure status and blood pressure variability (unadjusted analysis).
Table 2. The relationship between blood pressure status and blood pressure variability (adjusted analysis).
Discussion
In this study, patients with HNBP were at higher risk of having visit-to-visit blood pressure variability than normotensive persons; HNBP remained significantly associated with VVBPV after adjusting for the effect of the potential confounders. In the multivariable analysis, we adjusted for effect of the number of the cardiovascular risk factors instead of the effect of each cardiovascular factor because these variables are highly correlated. Thus, if we included all of them in a regression model, we would have calculated biased estimates and confidence intervals (collinearity). As we mentioned, we used standard deviation as the only indicator for blood pressure variability because a study has revealed that intra-individual visit-to-visit gauged by standard deviation is tightly correlated with the other measures.[Citation20] Second, calculating several metrics that capture the same aspect of visit-to-visit blood pressure variability will not convey additional data on the relationship with outcome.[Citation20] We included only fasting participants in the analysis because pre-prandial blood triglycerides and glucose concentrations can detect cases with elevated triglycerides and glucose concentrations more accurately than post-prandial glucose and triglycerides concentrations.[Citation14,Citation21,Citation22]
HNBP can lead to arterial stiffness.[Citation23–25] Many studies reported that inflammatory markers—such as tumor necrosis factor a, c-reactive protein, and homocysteine—are elevated in patients with HNBP;[Citation23–25] these elevated markers are important mediators in the process of atherosclerosis which leads to arterial stiffness; arterial stiffness is an important cause for arterial blood pressure variability.[Citation26] Hence, we speculate that the arterial stiffness might explain the noticed association between HNBP n and VVBPV.
Hypertensive patients suffer from oscillations in their blood pressure among their clinical visits i.e. VVBPV is prevalent among hypertensive patients. HNBP and VVBPV are also common in clinical settings.[Citation15,Citation26–29] The two phenomena are associated with cardiovascular morbidity, such as ischemic heart disease, stroke, peripheral vascular diseases; and cardiovascular mortality.[Citation12–19] Yet, to our knowledge, the relationship between HNBP and VVBPV has not been explored before in any representative sample.
This study demonstrated that patients with HNBP had larger long-term blood pressure variability than that of normotensive persons. Because HNBP can increase the risk for atherosclerosis and visit-to-visit blood pressure variability is an indicator of arterial stiffness (atheroscleorsis), we suggest that physicians use visit-to-visit blood pressure variability as a clinical sign to identify atherosclerosis in individuals with HNBP. However, they need to conduct laboratory (total cholesterol HDL, LDL) and ultrasonic (carotid ultrasound) investigations to confirm the presence of atherosclerosis. They can recommend patients with HNBP to reduce their body weights, exercise regularly and consume more healthy food. These recommendations might reduce the large oscillation in the blood pressure between visits and their patients’ cardiac adverse events.
This study has some limitations:[Citation1] We could not prove temporality between the two phenomena because the study was cross sectional.[Citation2] Although we noticed a statistically significant association between HNBP and VVBPV, we cannot conclude that HNBP causes VVBPV.[Citation3] RAs took the first set of blood pressure measurements during an in-home; physicians collected and recorded the other set of measurements in the second visit; thus, measurement errors might have happened. However, the physicians and the RAs followed a standardized study protocol when they measured participants’ blood pressure; they also used identically calibrated equipment for the same purpose (measuring arterial blood pressure). It is important to mention that the lack of standardization of blood pressure measurements in clinical practice might lead to a wide error and variation in blood pressure measurement; therefore, it is difficult to compare blood pressure readings across visits. Second, the effect of a medical intervention on blood pressure variability may not be accurately evaluated: false positive or negative effect. Thus, we strongly recommend that primary care physicians standardize the screening for and diagnosis of HNBP, and measurement of blood pressure to avoid these shortcomings.[Citation4] We used only two visits (three blood pressure measurements in each visit) to calculate VVBPV; therefore, the estimated blood pressure variability might not be as reliable as VVBPV that could have been calculated from a larger number of visits.[Citation5] The observed difference might have statistical but not clinical significance. However, the literature has shown that individuals with larger visit-to-visit blood pressure variability have a higher risk for cardiovascular outcomes when they are compared with individuals with low blood pressure variability irrespective of blood pressure cutoffs used and the magnitude of observed differences in variability:[Citation30,Citation31] Higher blood pressure variability leads to a higher cardiovascular risk.[Citation6] We had no chance to evaluate the relationship between VVBPV and cardiovascular morbidity and mortality in the analysis, because of the small number of these events in the NHANES III dataset (lack of statistical power).
Despite the previous limitations, the study had points of strength: First, we used the Historical NHANES III survey, conducted between 1988 and 1994, which had the following advantages: (1) It had high-quality data because a comprehensive study protocol and rigorous quality control measures were used while the data were collected. (2) It collected information on the variables that enabled us to calculate VVBPV. (3) It collected information on many covariates, which enabled us to adjust for the effect of these variables and calculate more precise estimates. (4) The sample of NHANES III survey had an adequate number of persons with high-normal blood pressure, which provided us with sufficient power to detect a small but important association between HNBP and VVBPV. Second, findings from studies using NHANES data are representative of the US noninstitutionalized civilian population. Hence, we may generalize our findings to US adults because NHANES III is a large probability sample of the general population.
In summary, this study documents a significant association between HNBP and VVBPV. Primary care physicians might consider their patients with HNBP at risk of having long-term blood pressure variability; therefore, we suggest that they periodically measure these patients’ arterial blood pressure to detect this clinical problem early. Nevertheless, investigators need to confirm and translate our findings into clinical practice and evaluate the clinical role of VVV in patients with HNBP in prospective studies.
Disclosure statement
All the authors have no conflict of interest.
References
- Ruilope LM. Understanding visit-to-visit blood pressure variability. J Clin Hypertens (Greenwich). 2014;16:8–9.
- Egan BM, Lackland DT, Jones DW. Prehypertension: an opportunity for a new public health paradigm. Cardiol Clin. 2010;28:561–569.
- Qureshi AI, Suri MF, Kirmani JF, et al. Prevalence and trends of prehypertension and hypertension in United States: national health and nutrition examination surveys 1976 to 2000. Med Sci Monit. 2005;11:CR403–CR409.
- Pal GK, Pal P, Nanda N, et al. Cardiovascular dysfunctions and sympathovagal imbalance in hypertension and prehypertension: physiological perspectives. Future Cardiol. 2013;9:53–69.
- Gupta AK, McGlone M, Greenway FL, et al. Prehypertension in disease-free adults: a marker for an adverse cardiometabolic risk profile. Hypertens Res. 2010;33:905–910.
- Suri MF, Qureshi AI. Prehypertension as a risk factor for cardiovascular diseases. J Cardiovasc Nurs. 2006;21:478–482. quiz 83–84.
- Cao X, Xie X Zhou J,Y, et al. Relationship between prehypertension and incidence of chronic kidney disease in a general population: a prospective analysis in central south China. Int Urol Nephrol. 2014;46:2183–2189.
- Kim MJ, Lim NK, Park HY. Relationship between prehypertension and chronic kidney disease in middle-aged people in Korea: the Korean genome and epidemiology study. BMC Public Health. 2012;12:960.
- Yano Y, Fujimoto S, Sato Y, et al. Association between prehypertension and chronic kidney disease in the Japanese general population. Kidney Int. 2012;81:293–299.
- Crews DC, Plantinga LC, Miller ER 3rd, et al. Prevalence of chronic kidney disease in persons with undiagnosed or prehypertension in the United States. Hypertension. 2010;55:1102–1109.
- Parati G, Stergiou GS, Asmar R, et al. European society of hypertension guidelines for blood pressure monitoring at home: a summary report of the second international consensus conference on home blood pressure monitoring. J Hypertens. 2008;26:1505–1526.
- Okada R, Okada A, Okada T, et al. Visit-to-visit blood pressure variability is a marker of cardiac diastolic function and carotid atherosclerosis. BMC Cardiovasc Disord. 2014;14:188.
- Faramawi MF, Fischbach L, Delongchamp R, et al. Obesity is associated with visit-to-visit systolic blood pressure variability in the US adults. J Public Health (Oxf). 2015;37:694–700.
- Faramawi MF, Delongchamp R, Said Q, et al. Metabolic syndrome is associated with visit-to-visit systolic blood pressure variability in the US adults. Hypertens Res. 2014;37:875–879.
- Diaz KM, Tanner RM, Falzon L, et al. Visit-to-visit variability of blood pressure and cardiovascular disease and all-cause mortality: a systematic review and meta-analysis. Hypertension. 2014;64:965–982.
- Okada H, Fukui M, Tanaka M, et al. Visit-to-visit variability in systolic blood pressure is a novel risk factor for the progression of coronary artery calcification. Hypertens Res. 2013;36:996–999.
- Shimbo D, Newman JD, Aragaki AK, et al. Association between annual visit-to-visit blood pressure variability and stroke in postmenopausal women: data from the women's health initiative. Hypertension. 2012;60:625–630.
- Okada H, Fukui M, Tanaka M, et al. Visit-to-visit variability in systolic blood pressure is correlated with diabetic nephropathy and atherosclerosis in patients with type 2 diabetes. Atherosclerosis. 2012;220:155–159.
- Muntner P, Shimbo D, Tonelli M, et al. The relationship between visit-to-visit variability in systolic blood pressure and all-cause mortality in the general population: findings from NHANES III, 1988 to 1994. Hypertension. 2011;57:160–166.
- Levitan EB, Kaciroti N, Oparil S, et al. Relationships between metrics of visit-to-visit variability of blood pressure. J Hum Hypertens. 2013;27:589–593.
- Faramawi MF, Sall M, Abdul Kareem MY. The association of the metabolic syndrome with T-wave axis deviation in NHANES III. Ann Epidemiol. 2008;18:702–707.
- Faramawi MF, Wildman RP, Gustat J, et al. The association of the metabolic syndrome with QTc interval in NHANES III. Eur J Epidemiol. 2008;23:459–465.
- King DE, Egan BM, Mainous AG 3rd, et al. Elevation of C-reactive protein in people with prehypertension. J Clin Hypertens (Greenwich). 2004;6:562–568.
- Kim BJ, Seo M, Huh JK, et al. Associations of plasma homocysteine levels with arterial stiffness in prehypertensive individuals. Clin Exp Hypertens. 2011;33:411–417.
- Chrysohoou C, Pitsavos C, Panagiotakos DB, et al. Association between prehypertension status and inflammatory markers related to atherosclerotic disease: the ATTICA study. Am J Hypertens. 2004;17:568–573.
- Faramawi MF, Delongchamp R, Lin YS, et al. Environmental lead exposure is associated with visit-to-visit systolic blood pressure variability in the US adults. Int Arch Occup Environ Health. 2015;88:381–388.
- Muntner P, Levitan EB. Visit-to-visit variability of blood pressure: current knowledge and future research directions. Blood Press Monit. 2013;18:232–238.
- Gupta P, Nagaraju SP, Gupta A, et al. Prehypertension - time to act. Saudi J Kidney Dis Transpl. 2012;23:223–233.
- Guo X, Zou L, Zhang X, et al. Prehypertension: a meta-analysis of the epidemiology, risk factors, and predictors of progression. Tex Heart Inst J. 2011;38:643–652.
- Parati G, Pomidossi G, Albini F, et al. Relationship of 24-hour blood pressure mean and variability to severity of target-organ damage in hypertension. J Hypertens. 1987;5:93–98.
- Noshad S, Mousavizadeh M, Mozafari M, et al. Visit-to-visit blood pressure variability is related to albuminuria variability and progression in patients with type 2 diabetes. J Hum Hypertens. 2014;28:37–43.