
Abstract
Purpose: We applied cluster analysis to identify discrete patterns of concomitant responses of systolic (SBP), diastolic (DBP) and pulse pressure (PP) during intensive BP lowering; and to evaluate their clinical relevance and association with risk of mortality, major vascular events (MVEs), and stroke.
Material and methods: We used an unsupervised cluster procedure to identify distinct patterns of BP change during the first 9 months of anti-hypertensive therapy intensification among 1,331 participants in the Secondary Prevention of Small Subcortical Strokes Trial who were previously randomized to lower BP target (SBP < 130 mm Hg) after lacunar stroke.
Results: The cluster procedure partitioned participants into three groups in the lower SBP target arm, persons with: 1) mildly elevated baseline SBP and minimal visit-to-visit BP variability (mild reducers); 2) moderately elevated baseline SBP and moderate visit-to-visit BP variability (moderate reducers); and 3) very elevated baseline SBP with very large visit-to-visit BP variability during intensification (large reducers). In the lower SBP target group, moderate reducers had a higher risk of death (adjusted HR 1.6 [95% CI 1.0–2.7]), MVE (adjusted HR 2.1 [95% CI 1.4–3.2]), and stroke (adjusted HR 2.6[95% CI 1.7–4.1]) compared to mild reducers. Large reducers had the highest risk of death (adjusted HR 2.3 [95% CI 1.2–4.4]), but risk of MVE (HR = 1.7 [95%CI 0.9–3.1]) and stroke (HR = 1.6 [95%CI: 0.8–3.5]) were not statistically significantly different compared to mild reducers.
Conclusions: Among persons with prior lacunar stroke, baseline BP levels, and BP variability in the setting of intensive BP lowering can identify discrete groups of persons at higher risk of adverse outcomes.
Keywords:
Background
Blood pressure (BP) lowering has been a mainstay of therapy for cardiovascular risk reduction, yet the optimal BP target remains an issue of active debate. For example, the Secondary Prevention of Small Subcortical Strokes (SPS3) trial previously demonstrated a potential benefit of intensive BP lowering (SBP < 130 mmHg) compared to a usual BP target of <140 mm Hg in persons with prior lacunar stroke, but this finding was not statistically significant [Citation1]. In the Action to Control Cardiovascular Risk in Diabetes trial, intensive BP lowering was not associated with a statistically significant reduction in the risk of cardiovascular events in type II diabetes [Citation2]. In contrast, the Systolic Blood Pressure Intervention Trial (SPRINT) demonstrated a cardiovascular and mortality benefit in lowering systolic BP (SBP) to a target of <120 mm Hg in persons at elevated cardiovascular risk [Citation3]. However, intensive BP lowering in SPRINT was also associated with a higher risk of adverse effects, such as hypotension, syncope, acute kidney injury, and electrolyte abnormalities [Citation3]. Given the potential risks associated with an intensive BP lowering strategy, the participants who may benefit the most from aggressive BP lowering remains a subject of debate.
During active and intensive BP lowering, changes in systolic (SBP), diastolic (DBP), and pulse pressure (PP) are likely to occur simultaneously, but the magnitude of change may differ by BP component and baseline BP [Citation4]. While there has been significant effort to determine the optimal BP level for cardio-protection, less attention has been paid to patterns of change in BP components during treatment intensification. Different patterns of BP response during intensive BP lowering could potentially have different prognostic implications, and may eventually help identify select populations for whom intensive BP lowering may have a higher risk-to-benefit ratio.
In prior studies, baseline and achieved SBP, DBP, PP, as well as visit-to-visit BP variability are all known to associate individually with risk of adverse outcomes, including cardiovascular events and death [Citation4–11]. Exactly how all of these BP components may jointly define distinct patterns of BP response during intensive anti-hypertensive therapy has not been thoroughly examined. Synthesizing the multitude of BP components into recognizable yet distinct patterns of BP change can be challenging using traditional statistical approaches. Machine learning is a method that has been used in many fields to allow computers to distinguish distinct groupings and predict future events by applying statistical methods to existing large datasets [Citation12]. Analyses can be performed in an unsupervised and unbiased fashion, with the goal of identifying natural patterns or groups within data that may not be easily recognized. These identifiable patterns can then be used to predict specific longitudinal outcomes of interest in a supervised fashion, using more traditional statistical methods [Citation12].
In this study, we used machine learning to evaluate whether discrete patterns of BP response are discernible among SPS3 trial participants who were previously randomized to intensive BP lowering after lacunar stroke [Citation1,Citation13]. We then validated these patterns of BP response in the participants previously randomized to the higher SBP target. Finally, we examined the association of these patterns with risk of death, major vascular events (MVEs), and stroke in each BP treatment group of SPS3 trial.
Methods
SPS3 trial
SPS3 was a large 2×2 factorial trial of 3,020 patients with a history of symptomatic lacunar stroke who were randomized to lower (SBP < 130 mm Hg) versus higher (SBP 130–149 mm Hg) BP targets between 2003–2011 [Citation1,Citation13]. Participants were also simultaneously randomized to aspirin plus clopidogrel versus aspirin therapy alone. Details of SPS3 trial have been previously published [Citation1]. All participants signed informed consent, and the trial was approved by the appropriate institutional review board.
We first focused our analysis on all SPS3 participants who were randomized to the lower-target group (N = 1,331) and who had BPs measured at a minimum of three separate visits between month 0 and month 9 (period of active intensification of anti-hypertensive therapy during SPS3 trial) [Citation1,Citation8]. We included only persons randomized to the lower target group for cluster construction, because our aim was to study patterns of BP change during active intensification of anti-hypertensive therapy. Participants who did not receive any anti-hypertensive medications during the intensification period or who had fewer than three BP measurements (N = 170) were excluded from our analysis.
We subsequently used the same rules derived from the lower SBP target group to assign cluster membership to the participants assigned to a higher SBP target (N = 1,207) during SPS3 trial. Participants who did not receive any anti-hypertensive medications and participants who had fewer than three BP measurements (N = 312) were excluded from our analysis. Titration of anti-hypertensive medications was performed at the discretion of local physicians in both treatment groups.
Blood pressure variable definitions
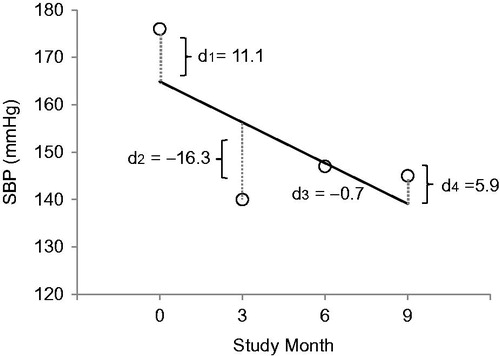
Baseline BP was determined using the mean of the three BP measurements taken at time of randomization. Achieved BP was determined using the mean of the month 6 and month 9 BP measurements as previously defined by SPS3 [Citation8,Citation13]. PP was defined as SBP minus DBP. Briefly, to assess visit-to-visit BP variability, we first regressed intra-individual BP measures on study visit and calculated residuals from the regression line, and then defined the absolute value of each residual as the ‘deviation’ (see and Appendix). We used this approach because this measure of variability is less dependent on baseline BP [Citation14]. We used four approaches to estimate BP variability for each participant: the mean of each subject’s BP deviations (average deviation), standard deviation (SD) of each subject’s BP deviations (SD of deviation), coefficient of variation of each subject’s BP deviations (CV of dev), and maximum BP deviation for each subject (max dev) [see ].
Figure 1. Illustration of BP variability calculation1. For each observed BP measurement (xi), the deviation (di) is defined as the distance to the regression line, or the absolute value of the residual (observed minus predicted value).
1Deviation variables were calculated as follows:


Identification of patterns of BP responses to intensive BP lowering (cluster derivation)
To identify patterns of BP response, we used unsupervised cluster analysis, which is a method that partitions subjects into different groups based on the levels of a predictor (in this case levels of BP and BP variability). This is in contrast to supervised analysis, which uses the outcome of interest to guide the partitioning.
A priori, we chose baseline, follow-up, change, and visit-to-visit BP variability as candidate variables for cluster construction, because each of these measures has been associated with adverse cardiovascular outcomes [Citation4,Citation6,Citation7,Citation11]. Because we had a total of 26 candidate variables, many of which were correlated, we first used principal component analysis to reduce the predictor space for preliminary cluster construction (shown in Appendix Table 1). We used the SAS FASTCLUS procedure to identify outliers and reduce their effect on cluster centers, using the strict option and cubic clustering criterion to inform the number of clusters. LASSO and Bayesian Model Averaging were used to determine which of the 26 candidate variables were the strongest predictors of the initial cluster assignment. Final cluster assignments were made using an unsupervised group-based cluster method, using the most distinguishing BP variables within the lower BP target group. We then applied our cluster construction rules to participants randomized to the higher SBP target in order to assign cluster membership to these participants. More details of cluster construction are provided in the Appendix.
Table 1. Summary of candidate BP measures selected a priori for the derivation of cluster membership (among SPS3 participants in lower SBP target group).
Statistical analyses
We first compared demographic and clinical characteristics of the study population at baseline by BP cluster in the lower BP target group. We then compared characteristics by cluster in the higher BP target group because we were specifically interested in understanding whether applying the same cluster construction rules based on BP values would yield groups with similar characteristics. We also compared the class of anti-hypertensive medication usage by cluster at baseline and follow-up (month 9). We then used Cox proportional hazards regression models to examine the association of cluster membership with risk of death, MVEs (stroke, myocardial infarction, or vascular death), and stroke (ischemic or hemorrhagic). These models were computed first in the lower target group, then validated in the higher target group of SPS3 trial. Fine-Gray models were used for the outcomes of major vascular events (MVE) or stroke, in order to account for the competing risk of death. Models were adjusted for baseline demographic characteristics including age, sex, race, and education (model 1), and additionally adjusted for cardiovascular risk factors (smoking, total cholesterol, diabetes, body mass index, and presence of congestive heart failure or coronary heart disease) in model 2.These analyses were performed in an intention-to-treat approach.
In additional analysis, we used multivariable Cox models to examine the association between individual baseline BP parameters (such as baseline SBP or achieved SBP) and their association with death, MVE, or stroke to provide a comparative basis to the data derived using our cluster-based approach.
LASSO and Bayesian Model Averaging were performed using the R packages glmnet and mlogitBMA. All other analyses were conducted using SAS version 9.4 (SAS Institute Inc., Cary, NC, USA). IRB approval was obtained at University of California San Francisco for secondary data analysis.
Results
Identification and description of distinct clusters of BP response
Among persons randomized to intensive BP lowering, our cluster procedure identified three distinct patterns of BP response, which were informed by a combination of nine BP variables: baseline SBP, change in SBP, two measures of variability in SBP, and five measures of variability in DBP (). While each of the nine variables showed significant correlations with cluster membership, the strongest correlations were seen for measures of BP deviation (for example, Spearman r = 0.88 for standard deviation of DBP; r = 0.85 for average deviation of DBP; and r = 0.84 for maximum deviation of DBP deviation), followed by baseline SBP (r = 0.44) and SBP change (r= −0.41)).
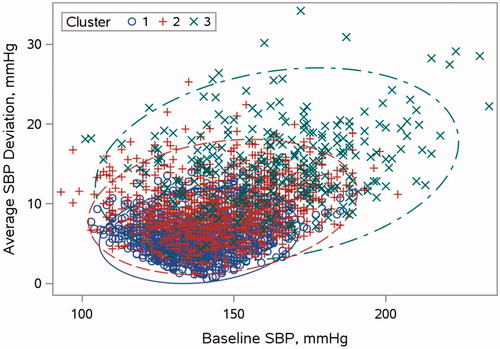
Comparisons of baseline characteristics of participants in the lower target group who were included and excluded from our analyses are shown in Supplemental Table 1. The BP parameters within each of the patterns of BP response are summarized in . Participants in the first cluster had the lowest baseline levels of SBP, DBP, and PP on average relative to cluster 2 and 3. BP levels in cluster 2 were intermediate. Persons in cluster 3 had the highest baseline BP levels and highest SBP and DBP variability during intensification of therapy. While achieved levels of SBP, DBP, and PP at follow-up were similar across the three clusters, there were substantial differences in BP variability. The distribution of baseline SBP and SBP variability (two of the strongest predictors of cluster membership) are depicted in across the three clusters.
Figure 2. Association of baseline SBP with SBP variability, stratified by cluster membership. Blue open circles and solid line denote cluster 1. Red plus symbols and dashed line denote cluster 2. Green x symbols and dash/dot line denote cluster 3. Elliptical curves denote 95% confidence regions for each cluster.
The baseline demographic and clinical characteristics of SPS3 participants included for analyses are shown in , stratified by cluster and BP treatment strategy. Overall in the lower SBP target group, the median age of participants was 62 years, 61% were male, 16% were black, 38% had diabetes, 48% were on only one anti-hypertensive agent, and 67% achieved the target SBP at 9 months. Participants were similar in terms of age and sex across the 3 clusters. Those in cluster 3 ('large reducers') were more often Black and less often Non-Hispanic White relative to the other clusters in the lower target group. There were no significant differences in body mass index, prevalence of baseline diabetes, or prevalent cardiac disease between the clusters in the lower BP group.
Table 2. Baseline characteristics of SPS3 participants by cluster stratified by lower and higher BP target groups.
The number of anti-hypertensive medications used at baseline was lowest in cluster 1 and highest in cluster 3 in lower target group. While the prevalence of antihypertensive use increased significantly during the intensification period in all three clusters, participants in cluster 3 remained significantly more likely to be on three or more agents (68%) relative to cluster 2 (45%) and cluster 1 (32%) as seen in . Across all clusters, the use of major classes of anti-hypertensive agents (diuretics, beta-blockers, calcium channel blockers, and ACE-I/ARBs) increased over time, with the largest increase in usage of all classes of medications noted in cluster 3. For example, the use of ACE-I and ARBs increased from 78% at baseline to 86% at month 9, and use of diuretics increased from 43% at baseline to 83% at month 9 in cluster 3. In cluster 1, use of diuretics increased from 39% to 59% by month 9, and use of ACE-Is/ARBs increased from 71% to 79% between baseline and follow-up in cluster 3.
We then assigned cluster membership to participants randomized to the higher target group using the cluster construction rules derived from the lower SBP target group. Characteristics of participants within each cluster in the higher BP target group were very similar to those in the same cluster that were randomized to the lower BP target group ().
Association between patterns of BP response and adverse outcomes
Among persons in the lower target group, during a median-follow-up of 3.8 years [IQR 2.2–5.4], there were 89 deaths, 129 MVEs, and 100 strokes. The mild reducers (cluster 1) had the lowest rates of death, MVE, and stroke compared to moderate or large reducers. In demographic adjusted analysis, compared to mild reducers, moderate reducers (cluster 2) had a higher risk of death, MVE and stroke (). Further adjustment for cardiovascular risk factors in multi-variable models did not significantly attenuate these associations. Compared with mild reducers (cluster 1), persons in cluster 3 (large reducers) had a 2.3 times higher risk of death (), and associations were not attenuated after adjustment. Rates of MVE and stroke were somewhat higher in large reducers relative to mild reducers, but the associations were not statistically significant.
Table 3. Association of cluster with outcomes in SPS3 participants (among participants in the lower BP target group).
We then repeated the analyses using the higher BP target group as a validation cohort. Among persons in the higher target group, during a median-follow-up of 3.8 years [IQR 2.1–5.3], there were 73 deaths, 144 MVEs, and 118 strokes. Our multi-variable analysis in the higher target group confirmed that mild reducers had the lowest rates for death, MVE and stroke. In contrast to findings in the lower target group, moderate reducers in the higher target group were at no increased risk for death, MVE or stroke compared with mild reducers. We confirmed that large reducers in the higher target group had the highest risk for death compared to mild reducers, as seen in the lower target group. Large reducers also had higher rates of MVE and stroke compared to mild reducers, but there were no statistically significant differences between the groups, which was similar to findings in the lower target group ().
In additional analyses, we also examined the association between each baseline BP parameter included in our cluster construction and risk of death, MVEs, and stroke in the lower BP target group in order to provide comparisons to our cluster-based approach. Substantial variations were noted between each individual BP parameter and its association with outcomes of interest. For example, every 10 mm Hg increase in baseline SBP was associated with a 1.38 times higher risk of death (95% CI 1.13–1.68), but was not associated with the risk of MVE (HR 1.12 [95% CI 0.96–1.31]) or stroke (HR 1.06 [95% CI 0.88–1.26]) in the lower BP target arm. Change in average deviation of SBP between randomization and month 9 was associated with a 1.21 times higher risk of death in the lower target arm (95% CI 1.03–1.42), but was not statistically significantly associated with risk of death in the higher target arm (HR 1.15 [95% CI 0.95–1.38]). Change in SBP between randomization and month 9 was not associated with risk of death (HR =0.89 [95% CI 0.72–1.10]), MVE (HR 1.03 [95% CI 0.85–1.27]), or stroke (HR 1.02 [95% CI 0.82–1.27]) in the lower BP target arm.
Discussion
Among persons with a history of lacunar stroke who were previously randomized to lower BP targets, we identified three distinct patterns of BP responses during intensive BP lowering in the first nine months of SPS3 trial. These patterns were best distinguished by the combination of baseline SBP and its change, in addition to visit-to-visit SBP and DBP variability. Moreover, these distinct patterns of BP response were associated with a differential risk of adverse outcomes in the lower BP target group. Specifically, we found that persons with lower baseline SBP and the lowest BP variability during intensification of therapy had the lowest risk of death, MVE, and stroke. Persons who started with the highest baseline SBP and exhibited the greatest visit-to-visit BP variability during intensification of therapy had the highest risk of death. This cluster also had somewhat higher rates for MVE and stroke compared with low reducers, but these were not statistically significant. These findings were similar when we applied the cluster rules to persons randomized to the higher BP target group. Taken together, our findings suggest that discrete patterns of BP response are identifiable during active intensification of anti-hypertensive therapy, and that these patterns may identify persons who are at higher risk for adverse clinical outcomes, particularly death.
To our knowledge, no prior study has described whether there are different phenotypes of BP response during the intensification of anti-hypertensive therapy. Methodologically, it can be challenging to develop an approach capable of assessing concomitant changes in all components of BP during intensification of therapy. Using machine learning, we showed that incorporating baseline levels and changes in SBP and DBP during active intensification of antihypertensive treatment can identify distinct phenotypes of BP response during treatment. This classification is important, as these patterns may represent different vascular phenotypes and appear to associate differentially with risk of adverse outcomes, particularly death. Our findings using a machine learning approach are consistent with other studies which have also found that both elevated baseline BP and BP variability parameters are important determinants of stroke risk [Citation15].
In our study, we found that persons in cluster 1 had the lowest risk for adverse events whether or not they had been previously randomized to lower or higher BP targets. On the other hand, large reducers had the highest risk of death, and these findings were consistent among persons randomized to the lower and higher BP target. Both BP target groups did experience a lowering of their BPs during the trial, albeit to different degrees based on the different BP targets. Our cluster approach was able to identify subgroups of participants at the highest risk of death (large reducers), regardless of the treatment target. Recent data from SPRINT suggest that the benefits and risks of BP lowering may vary based on baseline characteristics [Citation16]. Our findings support the notion that persons with higher BP at baseline are at increased risk for adverse events. Whether or not such individuals derive greater benefit than harm is beyond the scope of the current analyses, as we are limited in our power to detect interaction between cluster assignment and BP treatment strategy.
Our findings on the association of cluster 2 membership with MVE and stroke were less consistent - specifically cluster 2 had a higher risk of MVE and stroke in the lower, but not higher BP target group, although findings in both groups did not achieve statistical significance. While the reasons for this finding are unclear, the lack of association between cluster membership with the outcomes of MVE or stroke may be due to the lower number of events in this cluster.
The use of the concept of machine learning to allow computers to detect patterns in large data that may not be readily detected is relatively novel in the field of hypertension. Given the vast literature which has supported the importance of multiple different components of BP in determining the risk of adverse outcomes, a machine learning approach may help synthesize data and identify patterns of BP changes that cannot be detected using traditional statistical approaches [Citation12]. Application of machine learning in hypertension may be especially useful in the era of widespread electronic medical health record systems, given that BP pattern detection could potentially be embedded into such systems to help identify patients with differing risk of adverse events during BP intensification.
A particular strength of SPS3 is the availability of repeated BP measures, well-characterized persons undergoing BP intensification in the setting of a clinical trial, and long-duration of follow-up. Another strength was our ability to validate our findings in the lower BP target group using the higher BP target group, since both groups experienced a lowering of their BPs during the trial. The strength in our cluster approach was reflected especially in its ability to identify clusters with similar baseline characteristics in the higher BP target group (compared to that in the lower target group) during our validation process. Limitations to our study include the observational nature of the data and generalizability of our results to the non-trial population, who may differ from trial participants. Our data are most applicable to persons with a history of lacunar stroke who do not have other significant cardiovascular co-morbidities such as chronic kidney disease or congestive heart failure.
Further studies are needed to corroborate our findings in other at-risk populations, and to determine whether persons who start with very elevated baseline SBP derive the same benefit from aggressive BP lowering compared to those with lower baseline SBP. Attention to patterns of BP change (especially baseline BP and BP variability during intensification of therapy) during intensive BP lowering may be helpful in identifying patients with a higher risk of adverse outcomes during intensive BP lowering, and patients with the greatest potential for benefit from intensive BP lowering.
Supplemental_content.zip
Download Zip (145.3 KB)Acknowledgements
EK was supported by NIH KL2 TR00014 and K23 HL131023. CP was funded by NIH 1R01AG046206.
Disclosure statement
SPS3 was sponsored by the National Institutes of Health/National Institute of Neurological Disorders and Stroke. RS received an honorarium from Merck for participating in a Renal Expert Input Forum; this honorarium was donated to the Northern California Institute for Research and Education to support kidney research. CP provides consulting for Vital Labs and Cricket Health. The other authors report no conflicts.
Additional information
Funding
Related Research Data
References
- Benavente OR, Coffey CS, Conwit R, et al. Blood-pressure targets in patients with recent lacunar stroke: the SPS3 randomised trial. Lancet. 2013;382:507–515.
- Group TAS. Effects of intensive blood-pressure control in type 2 diabetes mellitus. N Engl J Med. 2010;362:1575–1585.
- Wright JT Jr, Williamson JD, Whelton PK, et al. A randomized trial of intensive versus standard blood-pressure control. N Engl J Med. 2015;373:2103–2116.
- Wang JG, Staessen JA, Franklin SS, et al. Systolic and diastolic blood pressure lowering as determinants of cardiovascular outcome. Hypertension. 2005;45:907–913.
- Muntner P, Shimbo D, Tonelli M, et al. The relationship between visit-to-visit variability in systolic blood pressure and all-cause mortality in the general population: findings from NHANES III, 1988 to 1994. Hypertension. 2011;57:160–166.
- Muntner P, Whittle J, Lynch AI, et al. Visit-to-visit variability of blood pressure and coronary heart disease, stroke, heart failure, and mortality: a cohort study. Ann Intern Med. 2015;163:329–338.
- Pastor-Barriuso R, Banegas JR, Damian J, et al. Systolic blood pressure, diastolic blood pressure, and pulse pressure: an evaluation of their joint effect on mortality. Ann Intern Med. 2003;139:731–739.
- Pergola PE, White CL, Szychowski JM, et al. Achieved blood pressures in the secondary prevention of small subcortical strokes (SPS3) study: challenges and lessons learned. Am J Hypertens. 2014;27:1052–1060.
- Poortvliet RK, Ford I, Lloyd SM, et al. Blood pressure variability and cardiovascular risk in the PROspective Study of Pravastatin in the Elderly at Risk (PROSPER). PLoS One. 2012;7:e52438.
- Rothwell PM, Howard SC, Dolan E, et al. Prognostic significance of visit-to-visit variability, maximum systolic blood pressure, and episodic hypertension. Lancet. 2010;375:895–905.
- Vaccarino V, Berger AK, Abramson J, et al. Pulse pressure and risk of cardiovascular events in the systolic hypertension in the elderly program. Am J Cardiol. 2001;88:980–986.
- Deo RC. Machine Learning in Medicine. Circulation. 2015;132:1920–1930.
- Benavente OR, White CL, Pearce L, et al. The Secondary Prevention of Small Subcortical Strokes (SPS3) study. Int J Stroke. 2011;6:164–175.
- Suchy-Dicey AM, Wallace ER, Mitchell SV, et al. Blood pressure variability and the risk of all-cause mortality, incident myocardial infarction, and incident stroke in the cardiovascular health study. Am J Hypertens. 2013;26:1210–1217.
- Rothwell PM, Howard SC, Dolan E, et al. Effects of beta blockers and calcium-channel blockers on within-individual variability in blood pressure and risk of stroke. Lancet Neurol. 2010;9:469–480.
- Patel KK, Arnold SV, Chan PS, et al. Personalizing the intensity of blood pressure control: modeling the heterogeneity of risks and benefits from SPRINT (Systolic Blood Pressure Intervention Trial). Circ Cardiovasc Qual Outcomes. 2017;10:e003624.