
Abstract
Background: Low serum 25-hydroxyvitamin D (25(OH)D) levels have consistently been associated with hypertension. During the last decades there has been an unexplained reduction in blood pressure (BP) in Western countries. We therefore examined the relation between serum 25(OH)D and BP in the 7th survey of the Tromsø study 2015/2016.
Methods: Blood pressure and serum 25(OH)D were measured and life-style factors registered in 15,951 subjects not using BP medication.
Results: In unadjusted analyses there was a significant negative association between serum 25(OH)D and systolic and diastolic BP that disappeared after adjusting for relevant confounders. This finding is in contrast to our previous reports on 25(OH)D and BP. We therefore cross-sectionally re-analyzed non-smoking (due to interference by smoking in the 25(OH)D assay) subjects not using BP medication from the 4th survey in 1994/1995 (n = 4108), 6th survey in 2007/2008 (n = 7553) and 7th survey 2015/2016 (n = 13,413). Adjusting for age and BMI, there were significant inverse relations between BP and 25(OH)D in the 4th, to a lesser degree in the 6th, and none in the 7th survey. For males the age- and BMI-adjusted differences in systolic BP between those with serum 25(OH)D < 25 nmol/L versus serum 25(OH)D > 100 nmol/L were 6.2 mmHg, 4.1 mmHg and −0.1 mmHg, for the 4th, 6th and 7th surveys, respectively.
Conclusions: Concomitant with a substantial reduction in BP from 1994 to 2015, there has been a loss of relation between 25(OH)D and BP which is hard to explain.
Introduction
Vitamin D is important for skeletal health, but vitamin D deficiency has also been linked to cardiovascular disease, immunological diseases, infections and cancer [Citation1]. For cardiovascular diseases this might be explained by an association between low serum levels of 25-hydroxyvitamin D (25(OH)D) (currently the preferred measure of vitamin D status) and the cardiovascular risk factors dyslipidemia, hypertension and insulin resistance.
Except for rickets, it has been difficult to show a causal relation between vitamin D deficiency and diseases, which could be due to reverse causality [Citation2, Citation3]. Another explanation could be confounding by age, body weight and life style factors, as we have recently shown for the association between serum 25(OH)D and lipids [Citation4].
On the other hand, the association between 25(OH)D and blood pressure (BP) appears to be consistent, even after adjusting for all relevant confounders [Citation5–8]. However, there has been a reduction in BP in Western societies during the last decades [Citation9, Citation10], in spite of increasing body mass index (BMI) and decreasing physical activity [Citation11, Citation12]. This reduction can hardly be explained by increased use of BP medication [Citation10, Citation13], and it is uncertain which life-style or environmental factor(s) are responsible. We therefore found it worthwhile to re-examine the relation between serum 25(OH)D and BP in the last survey in the Tromsø study that was performed in 2015/2016 and included more than 21,000 subjects.
Methods
Study populations
The Tromsø Study started in 1974 and is conducted in the municipality of Tromsø, Northern Norway at 69° North [Citation14]. Since then it has been repeated with 5–8 years intervals. In the 4th survey of the Tromsø Study, performed in 1994/1995, all individuals aged 25 years or older were invited to participate, and 27,158 persons (77%) attended the first visit. All men aged 55–74 years, all women aged 50–74 years, and a sample of 5–10% of the remaining age groups between 25 and 84 years were invited to undergo more extensive clinical examinations (second phase), and 7965 persons (78%) attended. The 6th survey was preformed in 2007/2008. Those who participated in the second phase of the 4th survey, a random 10% sample of subjects 30–39 years old, all subjects 40–42 and 60–87 years old, and a random 40% sample of subjects 43–59 years old, were invited. In total, 12,984 subjects (65.7%) attended. The 7th survey was performed in 2015/2016. All citizens aged 40 years and above living in the municipality of Tromsø were invited and 21,083 (64.7%) attended.
Measurements
The subjects filled in questionnaires on use of BP medication, cod liver oil, physical activity, smoking and alcohol habits (all surveys); and Omega-3 capsules (fish oil, seal oil), supplements containing vitamin D, sunny holidays and use of solarium (6th and 7th survey). Intake of fat fish was asked for in all surveys but the questionnaire in the 4th survey differed slightly from that in the 6th and 7th surveys. A physical activity score was created based on reported frequency, intensity and duration (7th survey). BP was measured three times by trained personnel with 1 min intervals after a 2 min seated rest with an oscillometric digital device (in the 4th survey with Dinamap Vital Signs Monitor, Critikon Inc, Tampa, FL, USA; in the 6th and 7th survey with Dinamap ProCare 300 monitor, GE Healthcare, Oslo, Norway). The mean of the two last measurements was used in the analyses. Non-fasting blood samples were drawn and in the 4th and 6th survey analyzed for 25(OH)D in batch with ECLIA (Roche) using an automated clinical chemistry analyzer (Modular E170, Roche Diagnostics). This assay overestimates serum 25(OH)D levels in smokers and where serum 25(OH)D levels from the 4th and 6th survey are used, smokers are excluded [Citation15]. In the 7th survey serum 25(OH)D measurements were performed with an LC-MSMS method [Citation16]. In non-smokers these two methods give very similar results with a correlation coefficient r of 0.81 [Citation15]. Serum creatinine was measured with an enzymatic colorimetric method using an automated clinical chemistry analyzer (Cobas 6000, Roche Diagnostics, Mannheim, Germany).
Statistical analyses
Normal distribution was tested with kurtosis, skewness and inspection of histograms, and found normal for the dependent variables systolic BP (SBP), diastolic BP (DBP) and 25(OH)D. Predictors of SBP, DBP and serum 25(OH)D were evaluated with linear regression models with covariates as appear in the tables. Due to interactions between serum 25(OH)D and sex regarding SBP, and between age and sex regarding serum 25(OH)D, all analyses were done sex-specific. Month of attendance was adjusted for with the use of dummy variables. Trends across groups were tested with linear regression as appear in the tables. The validity of the regression models was tested with residual plots that were found to have normal distribution. Correlations were evaluated with Pearson’s correlation coefficient r. Data are shown as mean (SD). All tests were done two-sided, and p < .05 was considered as statistical significant. All statistical analyses were performed using IBM SPSS version 24 software (SPSS INC, Chicago, Illinois, USA).
Ethics
The Tromsø Study is approved by the Regional Committee for Medical Research Ethics (REK) and the investigation is covered by this approval. All included subjects provided informed written consent.
Results
Cross-sectional analyses, the 7th survey
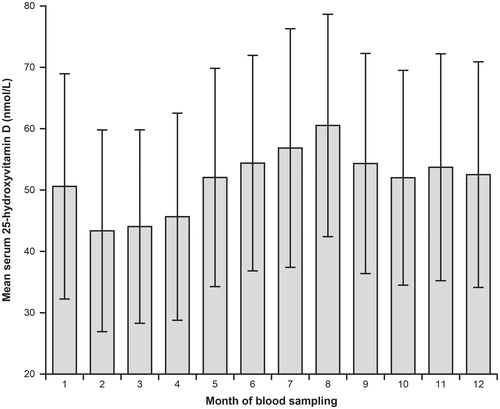
Among the 21,083 subjects who attended the 7th survey in the Tromsø study, 20,922 had valid serum 25(OH)D measurements. Among these, 15,951 (8549 females, 7402 males) had valid BP measurements and reported no use of BP medication, and were included in the analyses. Most of the subjects attended during the spring/summer/autumn months (Supplemental Figure 1). Their mean serum 25(OH)D levels were 65.2 nmol/L (females) and 59.6 nmol/L (males) with expected distribution () and seasonal variation ().
Figure 1. Distribution of serum 25-hydroxyvitamin D in 15,951 subjects not using blood pressure medication in the 7th survey of the Tromsø Study.
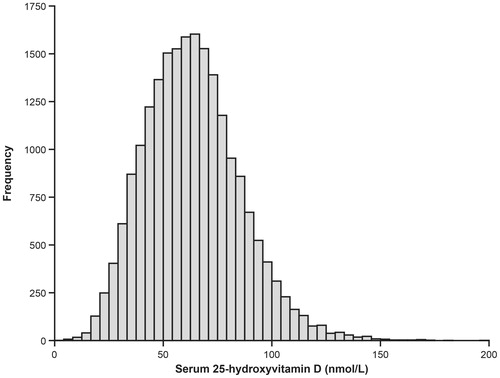
Figure 2. Mean serum 25-hydroxyvitamin D in relation to month of blood sampling in 11,855 subjects not using blood pressure medication, not recently been on a sunny vacation, and not using cod liver oil of vitamin D supplements. The error bars show SD.
In both women and men, there was in general an increase in serum 25(OH)D and BP with age, a decrease in serum 25(OH)D and increase in BP with increasing BMI, an increase in serum 25(OH)D without corresponding change in BP with increased intake of fat fish, cod liver oil, omega 3 capsules, vitamin D supplements, sunny vacations, use of solarium and intake of alcohol. There was an increase in serum 25(OH)D and a decrease in BP with increasing physical activity (). In linear regression models with serum 25(OH)D, SBP and DBP as dependent variables, the background variables came out as significant predictors similar as in the above stratified analyses (Supplemental Table 1).
Table 1. Serum 25(OH)D and blood pressure in subjects not using blood pressure medication. The 7th survey of the Tromsø study.
In males, there was a positive correlation between serum 25(OH)D and SBP (r = 0.040, p < .001) and a negative correlation between serum 25(OH)D and DBP (r = −0.037, p > .01), corresponding values in females r = 0.089 (p < .001) and r = 0.019 (ns). However, after adjusting for age, BMI and the other background variables, no significant associations between serum 25(OH)D and BP remained. The importance of adjusting for age and BMI is shown in detail for males in , where the effects of step-wise inclusion of the background variables are shown. Thus, adjusting for season, intakes containing vitamin D, sun exposure, serum creatinine, smoking, alcohol and physical activity hardly had any effect on the serum 25(OH)D and BP relation, whereas this changed markedly with inclusion of age and in particular BMI.
Table 2. Standardized β coefficient for serum 25(OH)D as predictor of systolic and diastolic blood pressure in 7402 male subjects without blood pressure medication in regression models with successive and additive inclusion of covariates in the models. The 7th survey of the Tromsø study.
In search of subgroup effects, separate analyses were performed for subjects with serum 25(OH)D levels ≥50 nmol/L, < 50 nmol/L, < 40 nmol/L and <30 nmol/L; SBP <130 mmHg, ≥ 130 mmHg, > 140 mmHg and >150 mmHg; and combination of vitamin D insufficiency (serum 25(OH)D < 50 nmol/L) and hypertension (SBP >140 mmHg). This did not reveal any significant associations in the females, whereas in males there were significant inverse associations between serum 25(OH)D and DBP in subjects with serum 25(OH)D < 50 nmol/L, in subjects with SBP >130 mmHg and in those with combined vitamin D insufficiency and hypertension. For SBP no such significances (or trends towards significance) were found (Supplemental Table 2).
Comparisons between cross-sectional analyses of the 4th, 6th and 7th surveys
The percentage of subjects with serum 25(OH)D measurement, smoking habits, and use of BP medication differed between the surveys. The characteristics of all the subjects, those with valid serum 25(OH)D measurement, and those who in addition were non-smokers and not using BP medication, are therefore shown in . After excluding smokers (due to interference by smoking in the 25(OH)D assay used in the 4th and 6th surveys) and those using BP medication, there was in the 7th survey 9% more males and mean age was 4 years lower than in the 4th survey. Mean BMI and serum 25(OH)D were 0.7 kg/m2 and 10.4 nmol/L higher in the 7th than the 4th survey, whereas mean SBP and DBP were 16.2 mmHg and 7.3 mmHg lower (). Use of cod liver oil (sometimes or daily) were reported in 41.6%, 43.4%, and 45.0% of the subjects in the 4th, 6th, and 7th surveys, respectively. In the 6th and 7th survey 51.6% and 40.4% used Omega 3 capsules sometimes or daily. The intake of fat fish was very similar in the 6th and the 7th surveys (Supplemental Table 3).
Table 3. Characteristics of the subjects in the Tromsø study surveys in relation to inclusion criteria for the analyses
Age, BMI, SBP, and SBP adjusted for age and BMI in the three surveys are shown in relation to serum 25(OH)D (groups in steps of 25 nmol/L) in . Except for BMI in the males in the 6th survey, there was across these serum 25(OH)D groups in all three surveys a significant decrease in BMI with increasing serum 25(OH)D. In the 6th and 7th survey there was an increase in age with increasing serum 25(OH)D, whereas there was a decrease in age with increasing serum 25(OH)D in the females in the 4th survey.
Table 4. Age, BMI and systolic blood pressure in relation to serum 25(OH)D in the 4th, 6th, and 7th survey in the Tromsø study in non-smoking subjects not using BP medication
In the 4th survey there was a significant decrease in SBP with increasing serum 25(OH)D in both sexes, with a difference in age and BMI adjusted SBP of ∼8 mmHg between those with serum 25(OH)D 0–24 nmol/L and those with 25(OH)D > 100 nmol/L. In the 6th survey there was in the females a decrease in SBP with increasing serum 25(OH)D up a level of 100 nmol/L, and thereafter a slight increase in SBP. In males this relation appeared more clearly U-shaped with the lowest SBP in those with serum 25(OH)D in the range 50–74 nmol/L. In the 7th survey, no significant relations between SBP and 25(OH)D were found after adjusting for age and BMI (). Similar results were seen for the relation with DBP (data not shown).
Longitudinal studies
To examine if the lost 25(OH)D and BP association was due to inclusion of new participants, those who had participated in all three surveys, the 4th and 6th surveys, and the 6th and 7th surveys were analyzed separately. Thus, of the 2572 females included in the analyses of the 4th survey, 973 were included in the analyses of the 6th survey, and among these, 450 were included in the analyses of the 7th survey. The corresponding figures for the males were 1536, 542, and 230, respectively. Among the 3951 females included in the analyses of the 6th survey, 2341 were also included in the analyses of 7th survey. Corresponding figures for the males were 3602 and 2014, respectively. This reduced the statistical power considerably, and few of the 25(OH)D and BP associations reached statistical significance. However, there appeared to be a general trend for the negative associations between 25(OH)D and BP seen in the 4th and 6th surveys to become (more) positive in the 7th survey (Supplemental Table 4).
Discussion
In the present population-based survey from 2015/2016 there were no consistent associations between serum 25(OH)D and BP after adjusting for age and BMI, in contrast to similar surveys in 1994/1995 and 2007/2008 [Citation8].
In most previous studies there has been a cross-sectional association between serum 25(OH)D and BP, which has been confirmed in several meta-analyses and review papers [Citation5–7]. This is plausible since the vitamin D receptor (VDR) and the vitamin D activating 1-alpha-hydroxylase enzyme are widely distributed and found in vascular smooth muscle cells [Citation17]. Animal studies also suggest that vitamin D deficiency may stimulate the BP regulating renin-angiotensin system [Citation18].
The inverse relation between 25(OH)D and BP could also be caused by confounders like sex, age and lifestyle factors. However, in our study, when males and females were analyzed separately, the results were basically the same. There was with increasing age an increase in both 25(OH)D and BP, which would favor a positive and not a negative 25(OH)D – BP association. Furthermore, strong predictors of serum 25(OH)D like intake of fat fish, cod liver oil and vitamin D supplements, alcohol consumption and UVB exposure were only marginally related to BP. Even physical activity, that was associated with increasing serum 25(OH)D levels and decreasing BP, did not affect the 25(OH)D – BP association in the regression analyses. On the other hand, adjusting for BMI, that was a strong negative predictor of serum 25(OH)D and a strong positive predictor of BP, made the 25(OH)D and BP association disappear.
As pointed out by Ke et al. there has been a discussion on whether to include BMI as a confounder in the regression analyses for the relation between BP and vitamin D, as vitamin D previously was thought to have a causal effect on adipose mass [Citation6]. This does not seem to be the case, as shown in Mendelian randomization studies. Thus, single nucleotide polymorphisms (SNPs) that affect BMI also affect serum 25(OH)D, whereas SNPs primarily affecting serum 25(OH)D do not affect BMI [Citation19]. Adjusting for BMI therefore appears justified.
Our present results are in contrast with what we have previously published regarding 25(OH)D and BP. Thus, in the 4th survey of the Tromsø study we found an inverse association between serum 25(OH)D and BP, with a difference between those in the lowest and highest 25(OH)D quartile of 3.6 mmHg for SBP and 1.0 mmHg for DBP, after adjustment for age, gender, BMI and physical activity [Citation18].
We therefore analyzed data from the 4th, 6th, and 7th surveys using similar inclusion criteria (non-smokers not using blood pressure medication), stratified for sex, and adjusted for the two only important confounders, age and BMI. With this approach there was from the survey in 1994/1995 to the last in 2015/2016 an apparent loss of the 25(OH)D – BP relation that is difficult to explain. Thus, the three cohorts were fairly similar regarding age and BMI, but the percentage of excluded smokers was lower and percentage excluded BP medication users higher, in the last survey. However, including subjects on BP medication did not change the overall results.
The intake of cod liver oil was similar in the three surveys, whereas the intake of Omega 3 capsules was slightly lower in the 7th than the 6th survey. In the 4th survey, the questions and answers regarding intake of fat fish differed from the 6th and 7th surveys, making intakes difficult to compare. However, these intakes in the 6th and 7th surveys were fairly similar, and moreover, the analysis of the data from the 7th survey showed that the 25(OH)D-increasing lifestyle factors had little or no impact on the 25(OH)D – BP relation.
One possible explanation for the loss of a 25(OH)D and BP relation, could be the inclusion of new subjects in the 6th and 7th surveys. We therefore separately analyzed subjects who had participated repeatedly in the surveys, and the results indicated that the loss of this association was also seen in these longitudinal cohorts. However, this must be viewed with caution as the statistical power in these subgroup-analyses was low.
The subjects in the 7th survey had higher serum 25(OH)D levels and lower BP than in the previous surveys. It is unlikely that the higher serum 25(OH)D levels were due to differences in the 25(OH)D assays. Probably it was due to increased vitamin D intake as well as increased sun-exposure as reported in other populations [Citation20]. The reduction in BP in the Tromsø study has previously been described in detail by Hopstock et al. [Citation13], and has also been found in other Western populations [Citation9, Citation10]. Thus, in the Tromsø study there has been a decrease in SBP in the age group 40–49 years of 10.6 mmHg in women and 4.5 mmHg in men from 1979 to 2008 [Citation13]. Similarly, in the HUNT study from the middle part of Norway, there has been a decrease in SBP from 1995 to 2006 of 7.7 mmHg in women and 6.3 mmHg in men [Citation10]. These decreases can only to a minor degree be explained by increased use of BP medication [Citation10], and in view of the increasing prevalence of obesity and inactivity they are difficult to understand [Citation11, Citation12]. Suggested explanations have been lower intake of salt, increased intake of fruit and vegetables, and, since there in the same period has been a reduction in heart rate, a reduction in the white-coat phenomenon [Citation10].
The increase in serum 25(OH)D and reduction in BP could potentially mask a relation between 25(OH)D and BP since it is likely that additional vitamin D (if relevant for BP) would be most important in those with vitamin D deficiency and/or hypertension. We therefore did subgroup-analyses according to vitamin D status and BP. This did not reveal significant 25(OH)D and BP associations (or even trends) in the females, whereas in the males with vitamin D insufficiency and/or increased BP, there was an inverse relation between 25(OH)D and DBP, but not SBP. Accordingly, these changes in 25(OH)D levels and BP can only partially explain the lost 25(OH)D and BP association.
It is tempting to speculate that there could be a connection between the substantial (and unexplained) decrease in BP and the apparent lost relation between serum 25(OH)D and BP. Hypothetically, a factor that increased BP and at the same time confounded the 25(OH)D – BP relation may have been lost; or a factor that reduces BP and masks the 25(OH)D – BP relation may have appeared. Which factor (or factors) this could be is hard to imagine, as the most obvious lifestyle factors (food intake and physical activity) appear not to be involved. The emergence (or disappearance) of some sort of environmental pollutant(s), which may have BP as well as endocrine effects [Citation21–23], could at least theoretically be such a factor.
It should be noted that most of the subjects in the studies included in the reviews and meta-analyses on 25(OH)D and BP were examined 10–20 years ago [Citation5–7], as is the case with two very large 25(OH)D and BP studies recently published. Thus, in the study by Afzal et al. serum 25(OH)D was measured in 35,517 subjects, and subjects with serum 25(OH)D < 25 nmol/L had 2.56 mmHg higher SBP than those with serum 25(OH)D ≥ 50 nmol/L [Citation24]. However, the subjects were included during 1981–1983, 2004–2005, and 2009–2011 and thus correspond to our findings from the 4th and 6th sixth surveys in the Tromsø study. Similarly, in the study by Vimaleswaran et al. that included 49,363 individual person data from 19 studies, increased serum 25(OH)D concentration was associated with reduced SBP (β per 10% increase, – 0.12 mmHg) [Citation25]. But again, most of these 19 studies were performed before or at the time of the 6th Tromsø study, and thus not in contrast, but in agreement with our findings. However, it must be acknowledged that these two studies also included genetic data for Mendelian association analysis, and both found that vitamin D genetic scores showed an association with BP. This was, however, very modest so that a genetically determined 10 nmol/L lower 25(OH)D concentration was associated with a 0.68 mmHg higher SBP and a 0.36 mmHg higher DBP [Citation24]. On the other hand, meta-analyses of RCTs have not shown a convincing BP lowering effect of vitamin D supplementation [Citation26, Citation27]. Thus, Witham et al. found a non-significant 3.6 mmHg reduction in SBP and a significant 3.1 mmHg reduction in DBP in their meta-analysis that included 716 subjects from 11 studies [Citation26]. However, in the study by Beveridge et al. that included 4541 participants from 46 trials, the effect size by vitamin D on SBP was 0.0 mmHg and on DBP – 0.1 mmHg (ns). Similar results were found in the 3092 participants where individual data were available. Even subgroup analyses according to baseline factors did not reveal a better response to vitamin D supplementation [Citation27]. Together with our finding of a lack of cross-sectional association between 25(OH)D and BP, we therefore find the clinical relevance of the Mendelian analyses questionable.
Our study has several limitations. We used different serum 25(OH)D assays in the surveys, and due to interference with smoking in the Roche assay used in the 4th and 6th surveys, had to exclude smokers when comparing the surveys and in the longitudinal analyses. We did not have accurate measurements of food intake, in particular fruits and vegetables, use of salt and use of oils rich in mono- and poly-unsaturated fatty acids that may affect BP. We did not have sufficient data on other indices of calcium homeostasis like serum calcium and parathyroid hormone, which could have added value to our analyses. All three surveys were population based, but we still cannot exclude the possibility of sampling error, nor can we exclude latent confounding that was not measured. Accordingly, our observation of a lost relation between serum 25(OH)D and BP should be viewed with caution until confirmed in other studies. Furthermore, it must be stressed that our tentative explanations for this lost relation are highly speculative.
However, our study also has strengths as it is, to our knowledge, the largest and longest lasting with repeated serum 25(OH)D measurements. Thus, the large number of subjects in the 7th survey excludes lack of power as explanation for not finding a statistically significant and consistent relation between serum 25(OH)D and BP. The expected relations found between serum 25(OH)D and its predictors like intake of fat fish and cod liver oil, sun exposure and BMI, and between BP and its predictors age and BMI, also give the results internal validity.
In conclusion, concomitant with a substantial reduction in BP from 1994 to 2015, there has in the Tromsø study been a loss of relation between 25(OH)D and BP which is hard to explain.
Data availability statement:
Access to the data that support the findings are available by application to the Tromsø Study steering group (http://tromsoundersokelsen.uit.no/tromso/)
Legend_to_supplementary_figure.docx
Download MS Word (11.8 KB)Supplemental_figure_1.tif
Download TIFF Image (171.3 KB)Supplemental_Table_4.110918.docx
Download MS Word (14.7 KB)Supplemental_Table_3.110918.docx
Download MS Word (12.6 KB)Supplemental_Table_2.110918.docx
Download MS Word (14.6 KB)Supplemental_table_1.110918.docx
Download MS Word (24.1 KB)Acknowledgements
The superb assistance from the staff running the Tromsø Study is gratefully acknowledged.
Additional information
Funding
Related Research Data
References
- Holick MF. Vitamin D deficiency. N Engl J Med. 2007;357:266–281.
- Theodoratou E, Tzoulaki I, Zgaga L, et al. Vitamin D and multiple health outcomes: umbrella review of systematic reviews and meta-analyses of observational studies and randomised trials. BMJ. 2014;348:g2035.
- DeLuca HF. Overview of general physiologic features and functions of vitamin D. Am J Clin Nutr. 2004;80(6 Suppl):1689S–1696S.
- Jorde R, Grimnes G. Exploring the association between serum 25-hydroxyvitamin D and serum lipids-more than confounding? Eur J Clin Nutr. 2018;72:526–533.
- Burgaz A, Orsini N, Larsson SC, et al. Blood 25-hydroxyvitamin D concentration and hypertension: a meta-analysis. J Hypertens. 2011;29:636–645.
- Ke L, Mason RS, Kariuki M, et al. Vitamin D status and hypertension: a review. Integr Blood Press Control. 2015;8:13–35.
- Pilz S, Tomaschitz A, Ritz E, et al. Vitamin D status and arterial hypertension: a systematic review. Nat Rev Cardiol. 2009;6:621–630.
- Jorde R, Figenschau Y, Emaus N, et al. Serum 25-hydroxyvitamin D levels are strongly related to systolic blood pressure but do not predict future hypertension. Hypertension. 2010;55:792–798.
- Tunstall-Pedoe H, Connaghan J, Woodward M, et al. Pattern of declining blood pressure across replicate population surveys of the WHO MONICA project, mid-1980s to mid-1990s, and the role of medication. BMJ. 2006;332:629–635.
- Holmen J, Holmen TL, Tverdal A, et al. Blood pressure changes during 22-year of follow-up in large general population - the HUNT Study, Norway. BMC Cardiovasc Disord. 2016;16:94.
- Jacobsen BK, Aars NA. Changes in body mass index and the prevalence of obesity during 1994-2008: repeated cross-sectional surveys and longitudinal analyses. The Tromsø Study. BMJ Open. 2015;5:e007859.
- Morseth B, Jacobsen BK, Emaus N, et al. Secular trends and correlates of physical activity: The Tromsø Study 1979-2008. BMC Public Health. 2016;16:1215.
- Hopstock LA, Bønaa KH, Eggen AE, et al. Longitudinal and secular trends in blood pressure among women and men in birth cohorts born between 1905 and 1977: the Tromsø study 1979 to 2008. Hypertension. 2015;66:496–501.
- Jacobsen BK, Eggen AE, Mathiesen EB, et al. Cohort profile: the Tromso study. Int J Epidemiol. 2012;41:961–967.
- Grimnes G, Almaas B, Eggen AE, et al. Effect of smoking on the serum levels of 25-hydroxyvitamin D depends on the assay employed. Eur J Endocrinol. 2010;163:339–348.
- Jorde R, Sollid ST, Svartberg J, et al. Vitamin D 20,000 IU per week for five years does not prevent progression from prediabetes to diabetes. J Clin Endocrinol Metab. 2016;101:1647–1655.
- Merke J, Milde P, Lewicka S, et al. Identification and regulation of 1,25-dihydroxyvitamin D3 receptor activity and biosynthesis of 1,25-dihydroxyvitamin D3. Studies in cultured bovine aortic endothelial cells and human dermal capillaries. J Clin Invest. 1989;83:1903–1915.
- Li YC, Kong J, Wei M, et al. 1,25-Dihydroxyvitamin D(3) is a negative endocrine regulator of the renin-angiotensin system. J Clin Invest. 2002;110:229–238.
- Vimaleswaran KS, Berry DJ, Lu C, et al. Causal relationship between obesity and vitamin D status: bi-directional Mendelian randomization analysis of multiple cohorts. PLoS Med. 2013;10:e1001383.
- Jääskeläinen T, Itkonen ST, Lundqvist A, et al. The positive impact of general vitamin D food fortification policy on vitamin Dstatus in a representative adult Finnish population: evidence from an 11-y follow-up based on standardized 25-hydroxyvitamin D data. Am J Clin Nutr. 2017;105:1512–1520.
- Sanidas E, Papadopoulos DP, Grassos H, et al. Air pollution and arterial hypertension. A new risk factor is in the air. J Am Soc Hypertens. 2017;11:709–715.
- Carré J, Gatimel N, Moreau J, et al. Does air pollution play a role in infertility?: a systematic review. Environ Health. 2017;16:82.
- McLachlan JA. Environmental signaling: from environmental estrogens to endocrine-disrupting chemicals and beyond. Andrology. 2016;4:684–694.
- Afzal S, Nordestgaard BG. Vitamin D, hypertension, and ischemic stroke in 116,655 individuals from the general population: a genetic study. Hypertension. 2017 Jul 31. pii: HYPERTENSIONAHA.117.09411. doi: 10.1161/HYPERTENSIONAHA.117.09411. [Epub ahead of print]
- Vimaleswaran KS, Cavadino A, Berry DJ; LifeLines Cohort Study investigators, et al. Association of vitamin D status with arterial blood pressure and hypertension risk: a mendelian randomisation study. Lancet Diabetes Endocrinol. 2014;2:719–729.
- Witham MD, Nadir MA, Struthers AD. Effect of vitamin D on blood pressure: a systematic review and meta-analysis. J Hypertens. 2009:27;1948–1954.
- Beveridge LA, Struthers AD, Khan F, et al. Effect of vitamin D supplementation on blood pressure: a systematic review and meta-analysis incorporating individual patient data. JAMA Intern Med. 2015;175:745–754.