
 ?Mathematical formulae have been encoded as MathML and are displayed in this HTML version using MathJax in order to improve their display. Uncheck the box to turn MathJax off. This feature requires Javascript. Click on a formula to zoom.
Abstract
Background: Non-invasive tests leading to elective coronary angiography (CAG) have low diagnostic yield for obstructive coronary heart disease (CHD). Aortic stiffness, an independent predictor of CHD events can be easily measured by pulse wave velocity (PWV). We aimed at retrospectively evaluating the diagnostic accuracy PWV index to detect CHD in consecutive patients with suspected CHD that underwent CAG.
Method: In population of 86 healthy patients with available PWV data, a theoretical PWV was derived. In different population of 62 individuals who underwent CAG for suspected CHD, PWV index was calculated as index [(measured PWV – theoretical PWV)/theoretical PWV]. Logistic regression and comparisons between ROC curves were used to add value of CAG indication performance of PWV index.
Results: Out of 62, seventeen patients presented obstructive CHD and 22 patients had non-obstructive CHD. PWV index and severity of CHD were positively correlated (p < 0.0001). After applying several models that included classical CHD predictor, the higher performance to detect abnormal CAG was obtained with the combined classifier PWV index/carotid plaque with 87% sensitivity, 93% specificity, 0.92 accuracy and 0.31 threshold. To detect obstructive CAG, individual classifier PWV index presents 94% sensitivity, 91% specificity, 0.95 accuracy and 0.46 threshold.
Conclusion: PWV index is individualized approach that optimizes CHD diagnostic strategies and thus might be clinically useful for reducing the rate of unnecessary invasive CAG.
Introduction
Coronary heart disease (CHD) is an important cause of death and remains a worldwide public health problem [Citation1]. Older age, male gender, the presence of hypertension, diabetes mellitus, dyslipidemia as well as of current smoking, are the main risk factors associated with CHD [Citation2]. Diagnostic invasive elective coronary angiography (CAG) is indicated after careful triaging, the latter including clinical symptoms, cardiovascular (CV) risk assessment and non-invasive cardiac stress testing. Nevertheless, in a recent nationwide cohort study, just slightly over one-third of patients without established CHD who underwent diagnostic CAG presented obstructive coronary artery lesions [Citation3]. Therefore, there is a growing need for finding further appropriate easy to apply, non-invasive tests and biomarkers that will increase the yield of diagnostic CAG.
A non-invasive measure of subclinical arterial disease could improve the accuracy of the necessity of the use of invasive CAG. In particular, arterial stiffness is the result of aging process and arteriosclerosis [Citation4]. The measure of arterial stiffness provides some prognostic information about future cardiovascular events [Citation5]. Increased arterial stiffness is associated with an increased risk of CV morbidity and mortality [Citation6]. Carotid to femoral pulse wave velocity (PWV) is the gold standard biomarker used for non-invasive measurement of arterial stiffness. Moreover, it is highly reproducible, widely applied, and an independent predictor of primary coronary events [Citation5,Citation7].
However, PWV measurement is not currently used in routine clinical practice, in part due to the difficulty of determining a non-pathological threshold value. The high risk cut off value of 10m/sec that has been proposed by the expert consensus document on arterial stiffness measurement [Citation8] is valid mainly for middle age individuals. Moreover, normal references values for PWV have been reported by the European consortium, the individualization highly depends on age and blood pressure level [Citation9]. These data allow identification of people in whom PWV is abnormal and whom might warrant more intensive follow-up, however, whether the reference values should be used as cut-off values for treatment remains to be proven.
Numerous studies have shown that age, gender, blood pressure (BP) and heart rate (HR) are strong determinants of aortic stiffness [Citation10]. A theoretical PWV, based on these determinants, was previously calculated to determine the individual relevance of aortic stiffness assessment [Citation11]. Also, a PWV index was proposed [Citation11] and calculated as ((measured PWV– theoretical PWV)/theoretical PWV) to determine those patients with increased aortic stiffness as well as to quantify the deviation from “normal”, independently of age, gender, mean BP, and HR.
In the present study, our working hypothesis was that the new proposed index [Citation12], i.e. the PWV index would be stronger and more predictive of CHD as detected by CAG than the calculated CV risk which is derived from the equation-based estimation of the 10-year CHD incidence based on classic CHD risk factors [Citation13]. Therefore, the aim of this study was (i) to assess retrospectively the accuracy of the diagnosis of CAG in patients with suspected CHD by non-invasive vascular biomarkers and (ii) to assess the correlation between aortic PWV index and the severity of CHD reported by CAG.
Methods
Study population
The present study included consecutive patients from January 2013 to September 2017, both genders, with or without previous CV events. The patients were eligible in this cross-sectional study during their follow-up at the Paris Hôtel-Dieu University Hospital. The patients were recruited after visiting the Diagnosis and Therapeutic Center of Hôtel-Dieu University Hospital. Most of the patients were in-hospital source of patients, with routine cardiovascular follow-up, and the others were referred by their general practitioner for a cardiovascular check-up because of the presence of one or more CV risk factors. Exclusion criteria were: age under 18, acute medical conditions, presence of atrial fibrillation and unwilling to sign the participation agreement.
The study complies with the Declaration of Helsinki. The study was registered in the French National Agency for Medicines and Health Products Safety (No. 2013-A00227-38) and was approved by the Advisory Committee for Protection of Persons in Biomedical Research.
Laboratory and clinical parameters
A question-form was filled out at inclusion during the day-hospital for cardiovascular screening and included age, gender, weight, height (respectively by a stadiometer fixed to a wall and Tanita scale with digital read-out), BMI (weight (kg) divided by height (m2)) by standardized methods, family (first-degree relatives) history of premature cardiovascular events, personal history of dyslipidemia (defined as a total/HDL-cholesterol ratio >5 after an overnight fast or the presence of lipid-lowering medications), hypertension (treated or untreated), smoking habits, previous diseases, and use of medications including antidiabetics, and antihypertensive drugs. Previous CV events were retrospectively assessed by using scan imaging-documented stroke for cerebrovascular disease; past medical history of documented myocardial infarction, coronary revascularization, or coronary heart disease diagnosed by coronary angiograms for patients with symptoms or typical electrocardiographic modifications for coronary heart disease; ankle-brachial pressure index value less than 0.90, imaging-documented atherosclerotic vascular disease, including asymptomatic severe carotid artery stenosis, peripheral vascular disease, and abdominal aortic aneurysm, arterial revascularization, or lower limb amputation. Left ventricular hypertrophy (LVH) was calculated according to the Penn convention (LV mass index >136 g/m2 for men wand >110 g/m2 for women).
Hypertension was defined as SBP at least 140 mmHg and/or DBP at least 90 mmHg, according to guidelines by the European Society of Cardiology, and/or antihypertensive drug used. Diabetes mellitus is defined as a glycosylated hemoglobin (HbA1c) 6.5% and/or fasting glucose
7 mmol/l and/or the use of oral hypoglycemic agents or insulin therapy.
Laboratory parameters included plasma glucose and glycated hemoglobin, cholesterol (total, low-density lipoprotein, and high-density lipoprotein) and triglycerides, plasma creatinine and calculated glomerular filtration rate (c-GFR) (by MDRD formula, MDRD: modification of diet in renal disease, by mL/min/1.73 m2; c-GFR <60 mL/min/1.73 m2 defined chronic kidney disease (CKD)), and presence of albuminuria (on 24-hour urine collection): as normo-albuminuria (<30 mg/24h), microalbuminuria (30–300 mg/24h) and proteinuria (>300 mg/24h).
Hemodynamic parameters
Hemodynamic measurements were performed in the morning after an overnight fast in a supine position. Brachial SBP and DBP were measured in both arms using an automatic BP monitor (OMRON 705 CP II IT) with cuffs of appropriate sizes after 5 min of rest. Five measurements 2 min apart were averaged, and HR was recorded.
After BP determination, aortic PWV was performed non-invasively by applanation tonometry using an automatic device (SphygmoCor AtCor, Sydney, NSW, Australia) with simultaneous three-lead orthogonal ECG. This technique is considered as the standard direct and non-invasive measurement for aortic stiffness determination [Citation14]. Aortic PWV was calculated as the direct distance between carotid and femoral arteries divided by the time interval between the feet of the pressure waves at the recording sites. Direct distance was multiplied by a scaling factor of 0.8 [Citation9]. The reproducibility of these measurements, in our group and in others, has been previously published in detail [Citation11,Citation12].
Determination of PWV index: in patients, free of hypertension, diabetes mellitus and non-previous CV events
Parameters influencing PWV measurement can be evaluated independently of sex, age, BP and HR [Citation15]. A nomogram of aortic PWV was constructed as previously described [Citation11,Citation12]. Based on the normotensive non-diabetic and non-previous CV events population of this study and according to the known determinants of the PWV, we derived individualized theoretical aortic PWV values based on age, gender, mean BP and HR. The factors included in the analysis were: patient’s age, mean BP, heart rate, and gender (male = 1 and female = 0). The equation derived from the multivariate analysis was then applied to a different set of patients of the same cohort who had classical CV risk factors, to obtain for reach one of them an individualized theoretical PWV value according to their age, BP, gender, and HR ().
Table 1. Multiple regression analysis of aortic PWV in normotensive, nondiabetic and non-previous cardiovascular events (N = 86).
Equation
Then the aortic PWV index was calculated for each patient: a PWV index defined as (measured PWV – theoretical PWV/theoretical PWV) adjusted on these parameters for each patient. The aortic PWV index was considered abnormal when positive.
Estimated 10-year CHD risk
An estimation of the risk of CHD over 10-year period was provided by the Framingham risk function equation calibrated to the French population [Citation13]. This risk was based on age, gender, agegender interaction, current smoking status, diabetes mellitus status, systolic blood pressure (SBP) and total and high-density lipoprotein (HDL).
where:
with gender = 1 for men and 0 for women, and smoking status is for current smokers = 1, no current smokers = 0. The output of this equation is an estimate of cumulative 10-year risk expressed as a percentage.
Obstructive CHD diagnosis
Elective invasive angiography was performed within 30 days of non-invasive cardiac testing. Results included location and degree of CHD as reported by the performing physicians. According to previous studies [Citation3,Citation16], CHD was defined by the degree of stenosis, which was classified as:
No apparent CHD: no stenosis
20%;
Non-obstructive CHD:
Obstructive CHD: any stenosis
Statistical analysis
Characteristics of the study population were described as means with standard deviation (SD) for continuous variables. Categorical variables were described as absolute numerical values and proportions. Comparisons between groups were performed using Student’s test for continuous variables. Pearson’s χ2 test was performed for categorical variables.
Logistic regressions models were obtained by stepwise selection, containing all variables that were significantly correlated in univariate analysis (p < 0.05) and based on their pathophysiological plausibility.
ROC (Receiver Operating Characteristic) analysis was performed for individual classifiers regarding their ability to detect CHD. For each classifier, the ability of the logistic regression models to allow discrimination was quantified by the area under the ROC curve (AUC). Cut-off values with the optimal trade-off between sensitivity and specificity were identified as decision thresholds for the discrimination.
Next, combined classifiers were identified by the optimum combination of determinant classifiers that provided the maximum discrimination. Combined ROC analysis was performed for the classifiers resulting from the combination of predictive independent parameters using logistic regression multivariate effect likelihood ratio tests [Citation17] to assess the discriminatory performance (AUC) for detecting CHD. The classifiers used for the combination of classifiers were identified among those previously screened with the ROC analysis for predictive individual classifiers with a level of p < 0.05.
Differences between the AUC values of ROC curves were tested for significance using a bivariate χ2 test to determine the highest differential diagnostic performance (AUC) of individual or combined classifiers to detect CHD.
Statistics were performed using SAS software (version 9.4; SAS Institute, Carry, NC). Significance was defined by a p value < 0.05.
Results
In our study population, 86 patients were free of hypertension, diabetes mellitus and non-previous CV events which served for the determination of theoretical PWV value. 62 patients had CAG. Clinical, biological and hemodynamic parameters of the overall population cohort are given in .
Table 2. Clinical, biological and hemodynamic parameters of the overall study population (N = 148).
A minority of these patients had obstructive CHD. 17 patients (28%) presented with obstructive CHD. 45 patients (72%) presented with non-obstructive coronary artery lesions from which 23 patients (38% of the study cohort) had normal CAG. Clinical, biological and hemodynamic parameters of the patients who underwent elective CAG are given in .
Table 3. Clinical, biological and hemodynamic parameters of the patients underwent CAG (N = 62).
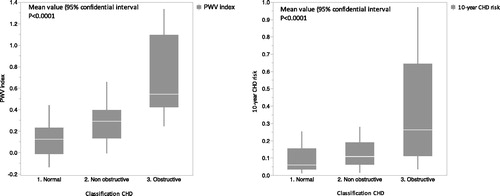
The presence of diabetes mellitus (p = 0.004), but not hypertension (p = 0.15), was associated with the severity of coronary artery lesions. Glycated hemoglobin level was positively correlated with the severity of coronary artery lesions (p = 0.04). Presence of carotid plaque was positively correlated with the severity of coronary artery lesions (p = 0.03). Observed aortic PWV, PWV index and 10 year-CHD risk were positively correlated with the severity of coronary artery lesions (p < 0.0001) (). Average PWV index was 0.14 (0.23) in normal CAG group, 0.28 (
0.18) in non-obstructive CAG group and 0.59 (
0.34) in obstructive CAG group (p < 0.0001). Respectively in the three groups, 10-year CHD risk was 10.01% (
10.36), 12.49% (
8.23) and 37.38% (
29.91) (p < 0.0001).
Figure 1. PWV index and 10-year CHD risk according to the CAG status (CHD: coronary heart disease, CAG: coronary angiography, PWV: pulse wave velocity).
PWV index (<0.0001), 10-year CHD risk (p < 0.0001), glycaemia (p = 0.02) and carotid plaque (p = 0.04) were significantly different between normal and abnormal (non-obstructive and obstructive) CAG groups.
PWV index (p < 0.0001), 10-year CHD risk (p = 0.0001), c-CGR < 60 (p = 0.08) and carotid plaque (p = 0.01) were different between normal and obstructive CAG groups.
Multivariate analysis of determinants associated with abnormal CAG
PWV index (p = 0.0008) and carotid plaque (p = 0.04) were independently and significantly modulating abnormal CAG with a positive correlation ().
Table 4. Multivariate analysis of parameters for abnormal and obstructive CAG.
Multivariate analysis of determinants associated with obstructive CAG
PWV index (p = 0.003) was the only independent and significant modulator of obstructive CAG ().
Accuracy of individual classifiers
Individual classifiers used were derived from the results of the multivariate analysis. AUC obtained from ROC curves for individual classifiers are shown in . Sensitivity and specificity of the different classifiers in the determination of CAG status, were assessed by ROC curves ().
Figure 2. ROC curves for individual and combined classifiers to detect abnormal (non-obstructive and obstructive) CAG and obstructive CAG vs normal CAG. (A) ROC curve of individual PWV index classifier for abnormal CAG. (B) ROC curve of combined (PWV index/Carotid plaque) classifier for abnormal CAG. (C) ROC curve for individual classifier to detect obstructive CAG vs normal CAG. AUC: area under the curve; CAG: coronary angiography; PWV: pulse wave velocity.
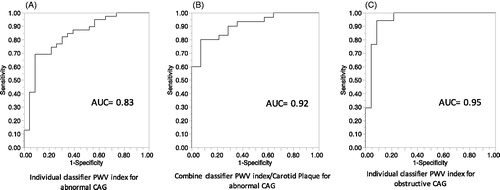
Table 5. Accuracy of individual and combine classifiers (area under ROC curve: AUC), and decision thresholds, to detect CAG status.
For determination of abnormal CAG compared to normal CAG, the accuracy of the classifier PWV index (AUC = 0.81, 69% sensitivity and specificity 92%) presented a significant difference with accuracy of carotid plaque classifier (AUC = 0.70, 82% sensitivity and 61% specificity) (p = 0.01) ().
For determination of obstructive CAG compared to normal CAG, the accuracy of the classifier PWV index presented AUC = 0.95, 94% sensitivity and specificity 91% (, ).
Accuracy of combined classifier
The accuracy obtained from combined ROC curves showed that the combined classifier (PWV index/Microalbuminuria) had a significantly higher accuracy (AUC = 0.92, sensitivity 87% and 93% specificity) as compared to those of individual classifiers PWV index and Carotid Plaque (p = 0.001, p < 0.0001 respectively) in the determination of abnormal CAG (, ).
Discussion
The main finding of our study was that PWV index could improve the accuracy of noninvasive indication of CAG by underestimating the presence of obstructive coronary artery lesions. In patients with CHD, PWV measurement is inversely correlated with the time until ischemia expands [Citation18]. PWV values are considered as independent predictors of CHD events [Citation7,Citation12]. PWV values are considered as markers of CHD, thus the PWV index could be useful for noninvasive diagnosis of CHD.
Moreover, PWV index was constructed on PWV values: mean BP and age, and it may be considered as an integrator of these two major risk factors, as hypertension and aging. It is well documented that age is correlated with higher risk of CHD for both men and women [Citation19]. A low risk of CHD is observed with the lowest SBP values (90–114 mmHg) and in the lowest DBP values (60–74 mmHg) in patients aged 30–79 years [Citation20]. Similarly, patients >80 years present the lowest risk of CHD with lower SBP values (90–114 mmHg). Above the age of 60, DBP values are correlated negatively with CHD [Citation21]. In addition to BP values, CHD is depending on other risk factors such as age, and gender [Citation22].
Advancing age may be the main potent independent predictor of future CV events. The relationship between time exposure and CV events is not fully explained by time-related changes in CV risk factors. Even if chronological age is mainly and independently associated with CV risk, the biological age of vessels may be different. Repeated exposure to potentially CV risk factors may lead to differences in vascular function and structure and then leads to a dissociation between biological and chronological age. These observed differences may be correlated with inter-individual differences in vascular health. Define an integrative measure of vascular structure adjusted on age may provide prediction of the real biological age of arteries [Citation23]. PWV index calculation could appear as an interesting integrator risk factor correlated with time exposure of CHD risk factors and a marker of severity of CHD [Citation24]. Aortic wall stiffness increases PWV, the main determinant of increased central SBP and PP. Progression of atherosclerotic damage is driven by pressure pulsatility and is related to the expression of lipid arterial wall infiltration. Numerous studies have shown a correlation between central PP and extent of coronary artery plaque.
Atherosclerosis is a systemic inflammatory vascular dysregulation process involved in numerous arterial beds [Citation25]. According to previous studies, patients with CHD present inflammation of the carotid arteries beyond the coronary bed [Citation26]. Therefore, the inflammation in the coronary/carotid artery plaque may be a mechanistic link between coronary and carotid artery diseases [Citation27]. Moreover, the association between carotid plaque and CHD has been well established in the literature [Citation28,Citation29]. Numerous epidemiologic and clinical studies have shown a strong correlation between CHD and carotid plaque [Citation30–32]; and carotid plaque is considered as an independent predictor of CV mortality [Citation33]. Carotid plaque and CHD are frequently detected concurrently in clinical practice. Furthermore, carotid plaque predicts a stronger increased risk in myocardial infarction than in stroke [Citation34].
Clinical implications
Several studies have shown a relationship between aortic stiffness and the severity of CHD. Increased PWV index could also be considered a marker of coronary atherosclerotic damage. The equation used to estimate theoretical PWV was based on “healthy” patient’s age, mean BP, gender and HR. These factors are considered as the main determinants of aortic wall stiffening [Citation9]. Thus, the calculation of PWV index for each patient allows the estimation of the attributable part of aortic stiffness as a marker of CHD adjusted on these parameters.
It remains unclear if percutaneous angioplasty of severe coronary artery stenosis, in association with optimal medical therapy, improves outcomes in patients with stable CHD [Citation35]. The concept of vulnerable plaque is one of the main precursors of acute coronary syndrome [Citation36]. Nevertheless, the evaluation of coronary stenosis severity during CAG remains inadequate to predict the location or the time of a future myocardial infarction [Citation37]. Pending further methods to identify those coronary plaques that are on the evolution toward a vulnerable state for targeted therapeutic interventions, the pan arterial approach could serve as an aid to identify at-risk patients. The degree of pulsatile stress, which is closely related to aortic stiffness, appears to be associated with risk of plaque disruption [Citation38]. Central pulsatility is considered the main powerful hemodynamic predictor of CV risk in coronary patients [Citation39]. The aortic PWV index may therefore represent a candidate marker of arterial damage that may be indicative of the presence of vulnerable plaque prone to rupture.
PWV index was associated with severity of CHD according to the degree of stenosis. Thus, it may also be considered a marker of the presence of non-obstructive atherosclerotic coronary lesions. Patients with non-obstructive lesions present a greater 1-year risk of myocardial infarction and all cause of mortality compared with patients with no apparent lesions [Citation40]. Increased PWV index in association with non-obstructive CHD could be indicative of a high-risk population for CV events.
In our study, 28% of the patients who underwent CAG had obstructive coronary lesions and 38% had non-CHD. These results are in line with previous data showing a low diagnostic yield of elective CAG [Citation3,Citation41]. PWV index was significantly increased in patients presented obstructive coronary lesions and was positively associated with the severity of coronary artery stenosis. Calculation of the PWV index before the indication of CAG may be considered clinically useful for reducing the rate of unnecessary CAG (23 normal CAG in our study may have been avoided).
However, the main limitation of our study was the modest number of study participants. Due to recruitment in medical care, it is difficult to found “healthy patients” with no hypertension, diabetes mellitus neither previous CV diseases. Future studies should include more “healthy patients” or develop multicenter trials to improve the power of the determination of the theoretical PWV and thus the PWV index calculation. A minority of our medical care patients had a CAG due to the invasive nature of this test. Nevertheless, future prospective studies could use a PWV index in the consideration or not of CAG for CHD risk patients and then present a higher number of patients with CAG.
Limitations
The present study has limitations inherent to the cross-sectional design, especially in establishing cause-effect relationships between PWV index and CHD. Moreover, the calculation of an index is dependent on the theoretical evaluation, which is expected to be different in another population study and potentially depends on the method used to measure PWV. However, the derivation of the theoretical PWV algorithm was done from a sub-cohort that included only “patients free of hypertension, diabetes and non-previous CV events”, which may strengthen the individual relevance of PWV index assessment. Patients were recruited from a hospital setting, which is a center of excellence in hypertension and is a primary care center including general practitioners. Thus, the study population is not representative of the general population, but this double medical care center may limit population selection bias compared to hyper-specialized centers. Our study population had various CV risk factors, such as dyslipidemia and active-smoking. These life behaviors may enhance theoretical PWV values when compared to healthy populations. However, these life behaviors are also observed in the general population and can thus reflect a theoretical PWV close to reality.
Conclusion
The present study examined the clinical relevance of aortic PWV index by evaluating its ability to detect CHD as assessed by CAG. Epidemiological and pathophysiological evidence suggest that this marker of arterial damage may have the potential to improve patient care. This approach is expected to assist the physician in invasive CAG decisions in the CHD diagnostic pathway.
Disclosure statement
No potential conflict of interest was reported by the authors.
References
- Nichols M, Townsend N, Scarborough P, et al. Cardiovascular disease in Europe 2014: epidemiological update. Eur Heart J. 2014;35:2950–2959.
- Kuulasmaa K, Tunstall-Pedoe H, Dobson A, et al. Estimation of contribution of changes in classic risk factors to trends in coronary-event rates across the WHO MONICA Project populations. Lancet. 2000;355:675–687.
- Patel MR, Peterson ED, Dai D, et al. Low diagnostic yield of elective coronary angiography. N Engl J Med. 2010;362:886–895.
- Cavalcante JL, Lima JAC, Redheuil A, et al. Aortic stiffness: current understanding and future directions. J Am Coll Cardiol. 2011;57:1511–1522.
- Vlachopoulos C, Aznaouridis K, Stefanadis C. Prediction of cardiovascular events and all-cause mortality with arterial stiffness: a systematic review and meta-analysis. J Am Coll Cardiol. 2010;55:1318–1327.
- Willum-Hansen T, Staessen JA, Torp-Pedersen C, et al. Prognostic value of aortic pulse wave velocity as index of arterial stiffness in the general population. Circulation. 2006;113:664–670.
- Ben-Shlomo Y, Spears M, Boustred C, et al. Aortic pulse wave velocity improves cardiovascular event prediction: an individual participant meta-analysis of prospective observational data from 17,635 subjects. J Am Coll Cardiol. 2014;63:636–646.
- Van Bortel LM, Laurent S, Boutouyrie P, et al. Expert consensus document on the measurement of aortic stiffness in daily practice using carotid-femoral pulse wave velocity. J Hypertens. 2012;30:445–448.
- Reference Values for Arterial Stiffness’ Collaboration. Determinants of pulse wave velocity in healthy people and in the presence of cardiovascular risk factors: “establishing normal and reference values.” Eur Heart J. 2010;31:2338–2350.
- Nichols W, O’Rourke M. McDonald’s blood flow in arteries theoretical, experimental and clinical principles. 4th ed. London: Edward Arnold; 2006.
- Blacher J, Safar ME, Guerin AP, et al. Aortic pulse wave velocity index and mortality in end-stage renal disease. Kidney Int. 2003;63:1852–1860.
- Vallée A, Yannoutsos A, Temmar M, et al. Determinants of the aortic pulse wave velocity index in hypertensive and diabetic patients: predictive and therapeutic implications. J Hypertens. 2018;36:2324–2332.
- Empana JP, Tafflet M, Escolano S, et al. Predicting CHD risk in France: a pooled analysis of the D.E.S.I.R., Three City, PRIME, and SU.VI.MAX studies. Eur J Cardiovasc Prev Rehabil. 2011;18:175–185.
- Laurent S, Cockcroft J, Van Bortel L, et al. Expert consensus document on arterial stiffness: methodological issues and clinical applications. Eur Heart J. 2006;27:2588–2605.
- Yannoutsos A, Bahous SA, Safar ME, et al. Clinical relevance of aortic stiffness in end-stage renal disease and diabetes: implication for hypertension management. J Hypertens. 2018;36:1237–1246.
- Bradley SM, Maddox TM, Stanislawski MA, et al. Normal coronary rates for elective angiography in the Veterans Affairs Healthcare System: insights from the VA CART program (veterans affairs clinical assessment reporting and tracking). J Am Coll Cardiol. 2014;63:417–426.
- Haker S, Wells WM, Warfield SK, et al. Combining classifiers using their receiver operating characteristics and maximum likelihood estimation. Med Image Comput Comput-Assist Interv. 2005;8:506–514.
- Kingwell BA, Waddell TK, Medley TL, et al. Large artery stiffness predicts ischemic threshold in patients with coronary artery disease. J Am Coll Cardiol. 2002;40:773–779.
- Lloyd-Jones DM, Larson MG, Beiser A, et al. Lifetime risk of developing coronary heart disease. Lancet Lond Engl. 1999;353:89–92.
- Rapsomaniki E, Timmis A, George J, et al. Blood pressure and incidence of twelve cardiovascular diseases: lifetime risks, healthy life-years lost, and age-specific associations in 125 million people. Lancet Lond Engl. 2014;383:1899–1911.
- Franklin SS, Larson MG, Khan SA, et al. Does the relation of blood pressure to coronary heart disease risk change with aging? The Framingham Heart Study. Circulation. 2001;103:1245–1249.
- Mancia G, Fagard R, Narkiewicz K, et al. 2013 ESH/ESC Guidelines for the management of arterial hypertension: the task force for the management of arterial hypertension of the European Society of Hypertension (ESH) and of the European Society of Cardiology (ESC). J Hypertens. 2013;31:1281–1357.
- Thijssen DHJ, Carter SE, Green DJ. Arterial structure and function in vascular ageing: are you as old as your arteries? J Physiol. 2016;594:2275–2284.
- Alarhabi AY, Mohamed MS, Ibrahim S, et al. Pulse wave velocity as a marker of severity of coronary artery disease. J Clin Hypertens Greenwich Conn. 2009;11:17–21.
- Ross R. Atherosclerosis–an inflammatory disease. N Engl J Med. 1999;340:115–126.
- Kim S, Lee S, Kim JB, et al. Concurrent carotid inflammation in acute coronary syndrome as assessed by (18)F-FDG PET/CT: a possible mechanistic link for ischemic stroke. J Stroke Cerebrovasc Dis. 2015;24:2547–2554.
- Lombardo A, Biasucci LM, Lanza GA, et al. Inflammation as a possible link between coronary and carotid plaque instability. Circulation. 2004;109:3158–3163.
- Chan SY, Mancini GBJ, Kuramoto L, et al. The prognostic importance of endothelial dysfunction and carotid atheroma burden in patients with coronary artery disease. J Am Coll Cardiol. 2003;42:1037–1043.
- Steinvil A, Sadeh B, Arbel Y, et al. Prevalence and predictors of concomitant carotid and coronary artery atherosclerotic disease. J Am Coll Cardiol. 2011;57:779–783.
- Vasankari T, Ahotupa M, Toikka J, et al. Oxidized LDL and thickness of carotid intima-media are associated with coronary atherosclerosis in middle-aged men: lower levels of oxidized LDL with statin therapy. Atherosclerosis. 2001;155:403–412.
- Wentzel JJ, Chatzizisis YS, Gijsen FJH, et al. Endothelial shear stress in the evolution of coronary atherosclerotic plaque and vascular remodelling: current understanding and remaining questions. Cardiovasc Res. 2012;96:234–243.
- Hamada S, Kashiwazaki D, Yamamoto S, et al. Impact of plaque composition on risk of coronary artery diseases in patients with carotid artery stenosis. J Stroke Cerebrovasc Dis. 2018;27:3599–3604.
- Störk S, van den Beld AW, von Schacky C, et al. Carotid artery plaque burden, stiffness, and mortality risk in elderly men: a prospective, population-based cohort study. Circulation. 2004;110:344–348.
- Sabeti S, Schlager O, Exner M, et al. Progression of carotid stenosis detected by duplex ultrasonography predicts adverse outcomes in cardiovascular high-risk patients. Stroke. 2007;38:2887–2894.
- Boden WE, O’Rourke RA, Teo KK, et al. Optimal medical therapy with or without PCI for stable coronary disease. N Engl J Med. 2007;356:1503–1516.
- Naghavi M, Libby P, Falk E, et al. From vulnerable plaque to vulnerable patient: a call for new definitions and risk assessment strategies: Part I. Circulation. 2003;108:1664–1672.
- Little WC, Constantinescu M, Applegate RJ, et al. Can coronary angiography predict the site of a subsequent myocardial infarction in patients with mild-to-moderate coronary artery disease? Circulation. 1988;78:1157–1166.
- Lovett JK, Howard SC, Rothwell PM. Pulse pressure is independently associated with carotid plaque ulceration. J Hypertens. 2003;21:1669–1676.
- Jankowski P, Kawecka-Jaszcz K, Czarnecka D, et al. Pulsatile but not steady component of blood pressure predicts cardiovascular events in coronary patients. Hypertension. 2008;51:848–855.
- Maddox TM, Stanislawski MA, Grunwald GK, et al. Nonobstructive coronary artery disease and risk of myocardial infarction. JAMA. 2014;312:1754–1763.
- Yannoutsos A, Ahouah M, Dreyfuss Tubiana C, et al. Aortic stiffness improves the prediction of both diagnosis and severity of coronary artery disease. Hypertens Res. 2018;41:118–125.