
Abstract
Background: It is believed that the intensity of oscillations in the photoplethysmographic waveform variability reflects the activity of vascular regulatory mechanisms. However, the relationship of such fluctuations with the state of health is poorly understood.
Purpose: The aim of our study was to assess the possibility of using spectral indices that reflect the intensity of oscillations of the photoplethysmographic waveform variability at frequencies 0.04-0.4 Hz as markers of hypertension and coronary artery disease. We did not study women to exclude the influence of menopause and sex hormones on the results.
Materials and Methods: We compared synchronous 10-minute records of finger photoplethysmogram and respiration at rest in 30 healthy males (48.8 ± 4.5 years; data presented as Mean ± SD) versus 30 patients with hypertension (aged 49.0 ± 4.3 years) versus 30 patients with stable coronary artery disease (49.2 ± 4.8 years). Percentages of high-frequency and low-frequency ranges in the total power of photoplethysmographic waveform variability spectrum (HF% and LF%), and LF/HF ratio were assessed.
Results: HF% are subject to by 2- to 5-fold increase in hypertensive patients (p < .001) and up to an 8-fold increase in patients with coronary artery disease (p < .001) when compared with healthy persons. On the contrary, LF% is reduced by 1.5-5 times in all patients when compared with healthy people (p < .001). We identified cut-off points for each photoplethysmographic index to distinguish patients with coronary artery disease or hypertension from healthy subjects. Multiple logistic regression models based on photoplethysmographic waveform variability indices had sufficient sensitivity and specificity for patients with hypertension or coronary artery disease.
Conclusion: Frequency-domain indices of photoplethysmographic waveform variability (in particular, HF%, LF%, and LF/HF) are sufficiently sensitive and specific markers of hypertension and coronary artery disease in adult males.
Introduction
Blood pressure variability is an important cardiovascular phenomenon. It is known that there is an association between blood pressure variability and cardiovascular outcomes and mortality [Citation1,Citation2]. At the same time, blood pressure variability has little association with other cardiovascular factors impacting the prognosis, such as atrial fibrillation [Citation3]. Blood pressure variability is primarily caused by the vasomotor tone [Citation4]. Taking into account that oscillations in blood supply in digital arteries contribute significantly to the photoplethysmographyc signal in fingers [Citation5], we can be sure that it is possible to study the regulation of systemic blood pressure using photoplethysmographic waveform variability characterizing beat-to-beat amplitude variations of photoplethysmogram. It is known that there have been attempts to use photoplethysmographic morphological features for evaluating hypertension [Citation6].
In the spectrum of photoplethysmographic waveform variability, oscillations with frequency in ranges similar to those in heart rate variability are revealed [Citation7]. There is an opinion that high-frequency oscillations in photoplethysmographic waveform variability mainly reflect the mechanical respiratory influences, whereas low-frequency oscillations are associated with sympathetic control of vascular tone [Citation8,Citation9], which in general is similar to the ideas of the nature of frequency components of blood pressure variability [Citation4]. González et al. concluded previously that oscillations in photoplethysmographic waveform variability and blood pressure variability are similar, but not identical [Citation10], although it is possible that they characterize similar vascular regulatory mechanisms [Citation11]. To date, the clinical implications of frequency-domain estimates of finger photoplethysmographic waveform variability have been poorly studied.
The aim of our study was to assess the possibility of using spectral indices that reflect the intensity of oscillations of the photoplethysmographic waveform variability at frequencies 0.04–0.4 Hz as markers of hypertension and coronary artery disease among adult males. We did not study women to exclude the influence of menopause and sex hormones on the results.
Material and methods
Ethical approval
The study was approved by the Ethics Committee of Saratov State Medical University in Saratov, Russia, and informed consent was obtained from all participants. All procedures involving human participants were performed in accordance with the ethical standards of the institutional research committee and the Declaration of Helsinki and its later amendments.
Subjects
Our study included 90 males divided into three categories: 30 healthy subjects aged 48.8 ± 4.5 years (data presented as a mean value and standard deviation – M ± SD), 30 patients with hypertension aged 49.0 ± 4.3 years, and 30 patients with stable coronary artery disease aged 49.2 ± 4.8 years.
The study derives from the clinical practice of the Institute of Cardiological Research, Saratov State Medical University. The patients were selected among people who came to seek medical advice to our hospital themselves.
We used the following inclusion criteria: confirmed diagnosis of hypertension and/or coronary artery disease or exclusion of both in accordance with current clinical guidelines, age between 40 and 55 years, and male sex.
Patient exclusion criteria are presented in the Supplemental Appendix. Adherence to inclusion and exclusion criteria was evaluated during clinical investigation.
Demographic and clinical characteristics of studied groups are outlined in . It should be noted that both groups under research were comparable with healthy males (p > .05) in age, body mass index, creatinine, blood glucose, hemoglobin, rate of smoking and diabetes, as well as the systolic function of the heart (evaluated by the left ventricular ejection fraction). None of the three groups had peripheral vascular disease, prior stroke, and chronic hepatic failure. Patients with stable coronary artery disease were characterized by a higher level of total cholesterol, triglycerides, rate of chronic obstructive disease of lungs and prior myocardial infarction, as compared to relatively healthy people and hypertensives (p < .05).
Table 1. Sociodemographic and clinical characteristics of studied groups.
The accepted inclusion and exclusion criteria suggest that the studied group of hypertensive patients is characterized by the absence of influence of important organic damage factors on the cardiovascular autonomic control.
Previous antihypertensive therapy has no significant influence on autonomic control because the hypertensive patients were not treated within 7 days prior to the start of the study. Patients with coronary artery disease did not get any treatment with the medication capable of actively impacting cardiovascular autonomic control (beta-blockers, angiotensin-converting-enzyme inhibitor, calcium channel blockers), 3 days prior. During the wash-out period, all hypertensive patients were supervised by ambulatory physicians. In case of necessity, they were given emergency care around the clock. Also, the prior drug treatment was often not intensive and irregular, due to problems with patient compliance to routine ambulatory care.
Signal recording
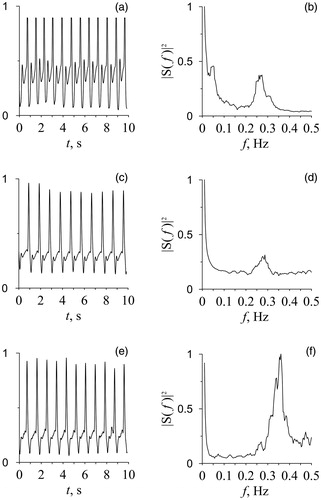
Photoplethysmographic signal from the middle finger of the right hand and respiration were simultaneously recorded during rest in the supine position for 10 min in the afternoon (3:00–4:00 p.m.) in all subjects, who were fasting and spontaneously breathing. Example of photoplethysmographic signals in groups under research (healthy subjects, hypertensive patients, and patients with coronary artery disease) are shown in . All measurements were done in a quiet, temperature-controlled room. The signals were recorded with the sampling frequency of 250 Hz and 14-bit resolution. The respiration recording was used to control whether the subject was breathing evenly. All experimental signals were recorded using a standard electroencephalograph analyzer EEGA-21/26 “Encephalan-131-03” (Medicom MTD Ltd, Taganrog, Russia; www.medicom-mtd.com/en/products/eega.html). The series with forced inspiration and delays in breathing were excluded from the analysis. Only photoplethysmogram records without artifacts, extrasystoles and considerable trends were used for the final analysis.
Figure 1. Examples of photoplethysmographic signals (a, c, e) and their spectrums (b, d, f) in healthy subjects (a, b), hypertensive patients (c, d), and patients with coronary artery disease (e, f).
Signal processing
The power spectra of photoplethysmographic waveform variability were calculated directly from the photoplethysmographic signal (). The power spectrum was evaluated by the Welch method [Citation12] in two-minute windows with a shift of one minute. A critical power value was calculated, above which spectral components were considered statistically significant (p = .05). For this, using the surrogate data, we tested the statistical hypothesis of normal noise bounded in the frequency band (0.04–0.4 Hz).
Before the study, we compared the estimations of the spectral power density at various window lengths. As a result, we selected the parameters indicated above, since they correspond to the official recommendations for spectral estimation of HRV signals adopted in Russia [Citation13] and give a satisfactory results for estimating the power in the frequency band when comparing groups using the PPG signals, although promising data analysis methods are known that are based on parametric spectral estimation or nonlinear filtering, for example, using the empirical mode decomposition [Citation14].
Then, using an approach similar to that used for the heart rate variability analysis [Citation13,Citation15], we calculated for these spectra the following spectral indices of photoplethysmographic waveform variability: LF% (low-frequency band, 0.04–0.15 Hz, in percentage of total spectral power, 0–0.4 Hz), HF% (high-frequency band, 0.15–0.4 Hz, in percentage of total spectral power, 0–0.4 Hz), and LF/HF ratio.
One of the problems we encountered using photoplethysmogram is the difficulty of interpreting the absolute values of photoplethysmogram waveforms. The output signal of the photoplethysmographic optical sensor is proportional to an unknown coefficient, which depends on a number of factors such as the optical characteristics of a subject’s skin, blood pressure values, sensor placement, sensor’s electrical and optical characteristics, and illumination and temperature in the room. Photoplethysmographic waveform absolute values were measured in conventional units (cu), which were defined as a proportion of a discrete sample of photoplethysmogram waveform to the signal at the optical sensor output. Since the coefficient of proportionality between the volume blood flow and cu is unknown, the interpretation of absolute values of low-frequency, high-frequency, and total powers of the photoplethysmographic spectrum is difficult. We do not use these spectral indices in this paper. However, the dimensionless measurements LF/HF, LF%, and HF% are applicable.
To assess the degree of fluctuation of the index values, the coefficients of variation were calculated for 10 healthy subjects and 10 patients with hypertension. From each of these subjects in the same experimental conditions for three consecutive days, the signals were recorded and processed. For healthy subjects, the mean coefficient of variation of LF/HF was 15.2%, for the patients, it was 12.7%.
Statistical analysis
Continuous variables are reported as medians (Me) with lower and upper quartiles (LQ, UQ) for non-normal distribution and as means (M) with standard deviations (SD) for normal distribution. Binary variables are presented as frequencies and percentages. The coefficient of variation was calculated to assess the degree of fluctuation of continuous variables in some subjects.
We applied the Shapiro–Wilk test to check whether the values were normally distributed. Since most variables were not normally distributed, further analysis was carried out using non-parametric statistical methods. We used the Mann–Whitney test to compare the values of continuous variables between the subjects’ groups. We applied the Chi-square (χ2) test to compare the binary variables and to compute the significance level for the difference between two proportions. We also used Kruskal–Wallis ANOVA with posthoc comparisons of mean ranks for multiple comparisons of continuous variables between the subjects’ groups. A receiver operating characteristic (ROC) analysis and Youden index were used to identify effective diagnostic cut-off points for the studied cardiovascular autonomic indices. We used multiple logistic regression to evaluate frequency-domain indices of photoplethysmographic waveform variability as potential predictors of a subject’s cardiovascular status. The results were considered statistically significant if the p-value was less than .05.
Results
Comparison of frequency-domain indices of photoplethysmographic waveform variability between studied groups
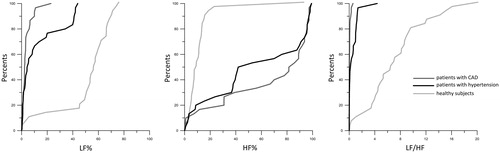
We found multiple significant differences (Kruskal–Wallis test: p < .001) in all studied photoplethysmographic waveform variability indices between studied groups. Any cardiovascular pathology (hypertension, coronary artery disease) was associated with a notable change (compared with healthy subjects) in all studied frequency-domain indices of photoplethysmogram (). In particular, we found that respiratory influences on photoplethysmographic waveform variability (assessed by HF%) are subject to by 2- to 5-fold increase in hypertensive patients (Mann–Whitney test: p < .001) and up to 8-fold increase in patients with coronary artery disease (Mann–Whitney test: p < .001) when compared with healthy persons. On the contrary, the contribution of sympathetic outflow in photoplethysmographic waveform variability (assessed by LF%) is reduced by 1.5–5 times in all patients with the cardiovascular disease when compared with healthy people (Mann–Whitney test: p < .001).
Figure 2. Cumulative distribution curves of frequency-domain indices of photoplethysmographic waveform variability (LF%, HF%, and LF/HF) in healthy subjects, hypertensive patients, and patients with coronary artery disease (CAD).
Cut-off points of cardiovascular autonomic indices for determining the subject’s clinical status
We identified the cut-off points for each studied cardiovascular autonomic index to distinguish subjects according to their clinical status (). All photoplethysmographic waveform variability indices have adequate sensitivity and/or specificity for their clinical use. Both LF% and LF/HF were highly specific (>80.0%) to discriminate between hypertensive patients and healthy subjects. HF% was sufficiently sensitive (>70.0%) to discriminate between patients with hypertension and healthy subjects. All indices have highly specific (>80.0%) and sufficiently sensitive (>70.0%) to distinguish patients with coronary artery disease from healthy subjects. All indices of photoplethysmographic waveform variability have sufficient sensitivity and low specificity to discriminate between patients with coronary artery disease and hypertensive patients ().
Table 2. Cut-off point of PPGV indices studied patients and healthy subjects.
The results of using logistic regression models based on frequency-domain indices of photoplethysmographic waveform variability to determine the clinical status of subjects are presented in . Regression models have shown good effectiveness for discrimination of patients with hypertension or coronary artery disease from healthy subjects ().
Table 3. Comparison of effectiveness of different logistic regression models.
Discussion
The undertaken study has shown significant differences in patients with hypertension and/or coronary artery disease as compared to healthy subjects in frequency-domain indices of photoplethysmographic waveform variability. In addition, as the patient’s clinical status deteriorates (healthy subjects → hypertensives → patients with coronary artery disease) the prevalence of power of high-frequency band over the low-frequency band in the photoplethysmogram spectrum increases. The spectral characteristic features of photoplethysmographic waveform variability identified in the study have, according to the data of our research, an acceptable level of sensitivity and specificity, which allows using them as additional markers to detect hypertension and/or coronary artery disease in the course of periodic screenings of groups of people believing themselves healthy.
Important information is given by photoplethysmographic waveform variability which characterizes fluctuations in peripheral blood flow. Two main spontaneous fluctuations are evident in infrared photoplethysmographic waveform variability: low-frequency oscillations at 0.1 Hz and respiration-related components at 0.25 Hz [Citation8]. Bernardi et al. have found a high coherence between low-frequency oscillations obtained in blood pressure variability, photoplethysmographic waveform variability and heart rate variability, unrelated to respiration or pulse rate, which suggests a common neural, non-local origin [Citation8]. Earlier, we showed that the heart rate variability and photoplethysmographic waveform variability sometimes demonstrate 1:1 synchronization, i.e. mutual adjustment of instantaneous phases and frequencies [Citation16]. This demonstrates functional interaction between autonomic control loops of various parts of the cardiovascular system. Sympathetic vasoconstrictor outflow is regulated by the arterial baroreflex in a beat-to-beat fashion [Citation17,Citation18]. However, the phase between photoplethysmographic waveform variability and blood pressure variability was positive in the 0.1 Hz region showing that low-frequency oscillations were not passively transmitted to the photoplethysmographic signal from large arteries [Citation8]. The passive transmission of respiratory blood fluctuations to photoplethysmographic signal, which was assessed in the high-frequency spectral band of photoplethysmogram, was also known [Citation8]. The presented facts are of interest, given the impact of both microcirculatory bed and blood filling of digital arteries on the finger’s photoplethysmographic signal, which was reported by Rhee et al. [Citation5]. Thus, low-frequency oscillations in photoplethysmographic waveform variability may be used as a measure of baroreflex control of blood pressure via sympathetic modulation of vascular resistance.
In our study, all spectral indices of photoplethysmographic waveform variability (LF%, HF%, and LF/HF) were sufficiently sensitive and specific for both of the studied cardiovascular diseases (hypertension and coronary artery disease). In all studied patients, vascular sympathetic activity is severely damped in the photoplethysmographic waveform, while the share of the passive respiration-related fluctuation is increased. Perhaps, the changes in properties of arterial bed in patients with cardiovascular diseases cause a decrease in the sympathetic outflow (through vasoconstrictor nerves) to the vasculature and reciprocally increase respiratory influences on the peripheral blood flow.
Baroreflex disturbance was often found in patients with hypertension [Citation19,Citation20]. It is not yet clear to what extent this phenomenon is secondary to hypertension and to what extent it could be its etiological factor is speculative. It is known that hypertension is characterized not only by an increased sympathetic activity [Citation19,Citation20], reduced vagal modulations of the sinoatrial node [Citation21] and depressed baroreflex gain [Citation22,Citation23]. The cardiovascular system adjusts itself to favor chronic maintenance of higher blood pressure, while the sensitivity of baroreflex lowers with negative physiological and prognostic sequelae [Citation24].
A number of mechanisms were demonstrated to be involved in chronic baroreflex resetting [Citation23]. The impairment of baroreflex sensitivity is also associated with the severity of subclinical coronary atherosclerosis in healthy asymptomatic subjects [Citation25] and patients with stable coronary artery disease [Citation26].
We are not aware of any studies devoted to the application of frequency-domain indices of photoplethysmographic waveform variability, associated with cardiovascular autonomic control, for detection of hypertension or coronary artery disease. It seems that the measurement of these variables can be effectively applied to screening for hypertension and coronary artery disease in prophylactic units, primary care units and outpatient clinics. Patients diagnosed by means of suggested approach and having changes in frequency-domain indices of photoplethysmographic waveform variability, characteristic of hypertension or coronary artery disease, should, in our opinion, be referred to a more profound examination with further dynamic case follow-up. Further research is required to determine the prognostic implications of frequency-domain indices of photoplethysmographic waveform variability to guide therapy and monitor patients for cardiovascular autonomic dysfunction.
The main limitation of our study is a limited number of subjects in groups. This is due to the adoption of gender and age limitations for the matching of groups. In the population available for our research people aged 40–55 years, in accordance with the inclusion criteria, are less frequent, as compared to other age groups: healthy people are often younger than 40 years, and patients with coronary artery disease are over 55 years.
It is known that a constant decline in time and frequency-domain parameters of heart rate variability is observed throughout a lifespan [Citation27]. But no similar studies were conducted for frequency-domain indices of photoplethysmographic waveform variability. Further studies of age and gender-related autonomic changes need to be analyzed in a similar way as heart rate variability [Citation28].
In this study, we did not include women, because we did not have the opportunity to take into account the characteristics of the reproductive system (e.g. serum sex hormone levels and the onset of menopause). This gender exclusion criterion also limits the results of our study. Gender-related differences become less relevant with age and diminish around the time of menopause, which may suggest a potential hormonal influence on the autonomic nervous system [Citation29].
Our research did not study other cardiovascular diseases. We assume that the given indices will allow identifying other cardiovascular diseases linked to the autonomic imbalances.
Despite photoplethysmogram’s wide range of applications, there are several significant drawbacks that may limit the usefulness and evolution of conventional photoplethysmogram. One of them is a spot measurement. A photoplethysmographic sensor can only monitor the dynamic change of the blood volume at one point per probe. Multi-sensor photoplethysmographic systems have been developed to monitor blood volume changes at different sites simultaneously. However, their use requires optical matching of each photoplethysmographic sensor as well as high temporal synchronization and anatomically symmetric wearing locations [Citation30]. This limits their applicability.
Summarizing the results obtained, we believe that frequency-domain indices of photoplethysmographic waveform variability (in particular, HF%, LF%, and LF/HF) are sufficiently sensitive and specific markers which may be potentially used as additional markers of hypertension and coronary artery disease in adult males.
Supplemental_Appendix.doc
Download MS Word (34 KB)Acknowledgements
The authors thank their colleagues from the Institute of Cardiological Research, Saratov State Medical University for their support with patient recruitment and Ms. Viktoria V. Skazkina and Ms. Ekaterina I. Borovkova for their assistance in signal processing.
Disclosure statement
The authors report no relationships that could be construed as a conflict of interest.
Related Research Data
References
- Stevens SL, Wood S, Koshiaris C, et al. Blood pressure variability and cardiovascular disease: systematic review and meta-analysis. BMJ. 2016;354:i4098.
- Mehlum MH, Liestøl K, Kjeldsen SE, et al. Blood pressure variability and risk of cardiovascular events and death in patients with hypertension and different baseline risks. Eur Heart J. 2018;39:2243–2251.
- Mehlum MH, Liestøl K, Wyller TB, et al. Blood pressure variability in hypertensive patients with atrial fibrillation in the VALUE trial. Blood Press. 2019;28:77–83.
- Zhang R, Iwasaki K, Zuckerman JH, et al. Mechanism of blood pressure and R-R variability: insights from ganglion blockade in humans. J Physiol (Lond). 2002;543:337–348.
- Rhee S, Yang BH, Asada H. Theoretical evaluation of the influence of displacement on finger photoplethysmography for wearable health monitoring sensors. Paper presented at International Mechanical Engineering Congress and Exposition; 1999 November 14–19; Nashville, TN.
- Liang Y, Chen Z, Ward R, et al. Hypertension assessment using photoplethysmography: a risk stratification approach. JCM. 2018;8:12.
- Kiselev AR, Mironov SA, Karavaev AS, et al. A comprehensive assessment of cardiovascular autonomic control using photoplethysmograms recorded from the earlobe and fingers. Physiol Meas. 2016;37:580–595.
- Bernardi L, Radaelli A, Solda PL, et al. Autonomic control of skin microvessels: assessment by power spectrum of photoplethysmographic waves. Clin Sci. 1996;90:345–355.
- Middleton PM, Chan GS, Steel E, et al. Fingertip photoplethysmographic waveform variability and systemic vascular resistance in intensive care unit patients. Med Biol Eng Comput. 2011;49:859–866.
- González H, Infante O, Lerma C. Response to active standing of heart beat interval, systolic blood volume and systolic blood pressure: recurrence plot analysis. Transl Recurrences Springer Proc Math Stat. 2014;103:109–123.
- Millasseau SC, Guigui FG, Kelly RP, et al. Noninvasive assessment of the digital volume pulse. Comparison with the peripheral pressure pulse. Hypertension 2000;36:952–956.
- Welch PD. The use of Fast Fourier Transform for the estimation of power spectra: a method based on time averaging over short, modified periodograms. IEEE Trans Audio Electroacoust. 1967;15:70–73.
- Baevskiy RM, Ivanov GG, Gavrilushkin AP, et al. Analysis of variability of the cardiac rhythm using different electrocardiographic systems (part 1). Vestnik Aritmologii 2002;24:65–86.
- Li Y, Pan W, Li K, et al. Sliding trend fuzzy approximate entropy as a novel descriptor of heart rate variability in obstructive sleep apnea. IEEE J Biomed Health Inform. 2019;23:175–183.
- Heart rate variability: standards of measurement, physiological interpretation and clinical use. Task Force of the European Society of Cardiology and the North American Society of Pacing and Electrophysiology. Circulation 1996;93:1043–1065.
- Kiselev AR, Karavaev AS, Gridnev VI, et al. Method of estimation of synchronization strength between low-frequency oscillations in heart rate variability and photoplethysmographic waveform variability. Russ Open Med J. 2016;5:e0101.
- Hart EC, Joyner MJ, Wallin BG, et al. Baroreflex control of muscle sympathetic nerve activity: a nonpharmacological measure of baroreflex sensitivity. Am J Physiol Heart Circ Physiol. 2010;298:H816–H822.
- Wallin BG, Delius W, Sundlof G. Human muscle nerve sympathetic activity in cardiac arrhythmias. Scand J Clin Lab Invest. 1974;34:293–300.
- Grassi G, Cattaneo BM, Seravalle G, et al. Baroreflex control of sympathetic nerve activity in essential and secondary hypertension. Hypertension 1998;31:68–72.
- Grassi G. Sympathetic neural activity in hypertension and related diseases. Am J Hypertens. 2010;23:1052–1060.
- Guzzetti S, Piccaluga E, Casati R, et al. Sympathetic predominance in essential hypertension: a study employing spectral analysis of heart rate variability. J Hypertens.1988;6:711–717.
- Pagani M, Rimoldi O, Malliani A. Low-frequency components of cardiovascular variabilities as markers of sympathetic modulation. Trends Pharmacol Sci. 1992;13:50–54.
- Kougias P, Weakley SM, Yao Q, et al. Arterial baroreceptors in the management of systemic hypertension. Med Sci Monit. 2010;16:RA1–RA8.
- Wehrwein EA, Joyner MJ. Regulation of blood pressure by the arterial baroreflex and autonomic nervous system. Handb Clin Neurol. 2013;117:89–102.
- Simula S, Laitinen T, Vanninen E, et al. Baroreflex sensitivity in asymptomatic coronary atherosclerosis. Clin Physiol Funct Imaging. 2013;33:70–74.
- Katsube Y, Saro H, Naka M, et al. Decreased baroreflex sensitivity in patients with stable coronary artery disease is correlated with the severity of coronary narrowing. Am J Cardiol. 1996;78:1007–1010.
- Umetani K, Singer DH, McCraty R, et al. Twenty-four hour time domain heart rate variability and heart rate: relations to age and gender over nine decades. J Am Coll Cardiol. 1998;31:593–601.
- Liu G, Wang Q, Chen S, et al. Robustness evaluation of heart rate variability measures for age gender related autonomic changes in healthy volunteers. Australas Phys Eng Sci Med. 2014;37:567–574.
- Stein PK, Kleiger RE, Rottman JN. Differing effects of age on heart rate variability in men and women. Am J Cardiol. 1997;80:302–305.
- Sun Y, Thakor N. Photoplethysmography revisited: from contact to noncontact, from point to imaging. IEEE Trans Biomed Eng. 2016;63:463–477.