
Abstract
Purpose: Previous studies that addressed whether left ventricular hypertrophy is more closely associated with central than peripheral blood pressure (BP) have been inconsistent. Radial artery wave generated by applanation tonometry and calibrated with brachial BP in 162 adult Nigerians were analysed by using generalized transfer function to derive central BP.
Materials and methods: We compared the associations of ECG voltages and left ventricular hypertrophy (ECG-LVH) as continuous and binary variables respectively with central and brachial BP indices.
Results: In a multivariable adjusted analysis, 1 standard deviation (SD) increase in brachial systolic, diastolic, pulse and mean arterial pressures increased the Sokolow–Lyon QRS voltage by 0.34 (CI, 0.21–0.48; p < 0.0001), 0.21 (CI, 0.07–0.36; p < 0.05); 0.22 (CI, 0.9–0.34; p < 0.001) and 0.29 (CI, 0.14–0.43) similar to (p > 0.05) corresponding Sokolow–Lyon QRS increase of 0.26 (0.12–0.40, p < 0.001); 0.14 (0.00–0.28, p < 0.05); 0.24 (0.11–0.39; p < 0.001) and 0.19 (0.05–0.34, p < 0.05) respectively observed for 1 SD increment in central pressures. The odds ratio (OR) relating ECG-LVH to 1 SD increase in brachial systolic, pulse, and mean arterial pressures were 2.62 (CI, 1.49–4.65, p < 0.001); 1.88 (CI, 1.19–2.95, p < 0.01) and 2.16 (CI, 1.22–3.82, p < 0.01) was similar to (p > 0.05) corresponding OR of 2.41 (1.33–4.36, p < 0.01); 2.04 (1.23–3.37, p < 0.01); 2.00 (1.11–3.63, p < 0.001) observed for I SD increment in central pressures.
Conclusion: Central and peripheral BP are similarly associated with Sokolow–Lyon ECG voltage and hypertrophy.
Introduction
Left ventricular hypertrophy (LVH) diagnosed by electrocardiography is an independent predictor of cardiovascular events and mortality [Citation1]. Several observational studies have firmly established that in both Blacks and Whites, left ventricular mass increases with blood pressure (BP); however, the increase is stepper in Blacks than Whites [Citation2–4]. Blood pressure within the aorta and other large vessels mirrors more closely the haemodynamic stress to which organs including the heart are subjected to in comparison to brachial-based pressure [Citation5]. From this physiologic viewpoint, we hypothesized that central BP might be more strongly associated with left ventricular hypertrophy than the brachial BP. If this hypothesis is true, central BP will refine risk assessment in cardiovascular disease.
Many cross-sectional studies [Citation6–10] have compared the association of left ventricular mass with central and brachial BP. The results of these observational studies are however inconsistent. Many of the studies used left ventricular mass index derived by echocardiography as a surrogate for cardiac target organ damage. Only one study [Citation11] assessed cardiac target organ damage with electrocardiography (ECG) either as left ventricular hypertrophy or as continuous ECG QRS voltages. In contrast to echocardiography, ECG is more widely available in many resource poor areas of Africa and therefore makes conclusion drawn from its use as a surrogate maker of cardiac target organ damage more clinically relevant in these areas. The present analysis therefore evaluated the relations of ECG LVH and QRS voltages with peripheral and central BP in an African population.
Methods
Study population
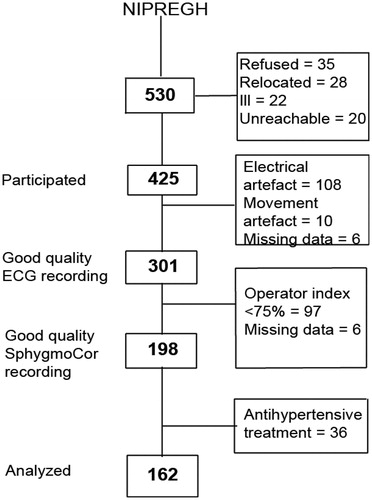
The study population consists of participants recruited in the framework of the ongoing Nigerian Population Research on Environment, Gene and Health (NIPREGH) [Citation12]. NIPREGH was approved by the University of Abuja Teaching Hospital Health Research Ethics Committee. Recruitment commenced in April 2013 and the study complied with the Helsinki Declaration for investigation of human subjects [Citation13]. Prior to recruitment, all participants provided informed written consent. Eligible adults were living in a well-delineated housing estate in Abuja, Nigeria and were at least 18 years old. Following an invitation, consenting adults were invited for physical examination, including electrocardiography and pulse wave analysis. Of 530 invited, 425 participated; giving a participation rate of 80%. A high quality electrocardiogram could not be obtained in 124 of the 425 participants because of frequent and unpredictable power failures in the catchment area and the poor grounding of the electrical wiring in the examination centre (108); excessive movement artefact (10); and missing data (6). Based on manufacturer’s advice, we excluded 97 individuals whose recording of central blood pressure was suboptimal. A further 36 individuals who were on antihypertensive therapy were also excluded from the current analysis. A total of 162 subjects were thus analysed (). All examinations took place in a local examination centre located within the area of the study.
Figure 1. Flow chart of NIPREGH (Nigerian Population Research on Environment, Gene and Health) participants enrolled in the current analysis. The operator index is a composite function that aggregates the measurements that have >5% variability between consecutive waveforms and/or a pulse wave amplitude <80mv.
Blood pressure measurement
Peripheral: Two trained observers measured brachial blood pressure by auscultation of the Korotkoff sounds at the non-dominant arm, according to the guidelines of the European Society of Hypertension [Citation14]. After the participants had rested in the sitting position for at least 10 minutes, the observers obtained five consecutive blood pressure readings at an interval of 30–60 seconds. Systolic and phase V diastolic blood pressures were determined to the nearest 2 mm Hg. Standard cuffs that had a 12 × 24 cm inflatable portion were used. If the upper arm circumference exceeded 31cm, larger cuffs with 15 × 35 cm bladder were used.
Central: Participants were asked to refrain from heavy exercise, cigarette smoking and drinking alcohol or coffee containing drinks 2 hours prior to the examination. In a cool quite room, all arterial pulse wave assessment was done by one observer using the radial artery in the supine position after the subjects had rested for 15 mins and brachial blood pressure used for calibrating the pulse wave recorded at the same arm with a mercury sphygmomanometer. We used a high fidelity tonometer (Milar instruments, Houston, TX, USA) to obtain the radial artery waveform. The tonometer was interfaced with a laptop computer running the SphygmoCor software version 9 (AtCor Medical West Ryde, New South Wales, Australia). To ensure strict quality control, recordings were discarded if the operator index was less than 75%. The operator index is a composite function aggregated from the consecutive variability of systolic and diastolic waves >5% and amplitude of the pulse wave signal <80 mv. The SphygmoCor software calculates the aortic pulse wave by means of a validated [Citation15] generalized transfer function.
Definition of blood pressure Indices: Peripheral and central pulse pressure (PP) were defined as the difference between systolic and diastolic blood pressures derived from the brachial BP (average of 5 consecutive readings) and the aortic pulse wave respectively. Likewise, peripheral and central mean arterial pressures (MAP) were calculated as diastolic pressure +1/3 of pulse pressure. The central aortic augmentation index was the difference between the second and first systolic peaks expressed as a percentage of the aortic pulse pressure.
Electrocardiography
The Cardiax device (RDSM Medical Devices, Hasselt, Belgium) interfaced with a personal computer was used to obtain standard 12-lead electrocardiograms. The electrocardiograms were recorded at a speed of 25 mm/sec with the calibration set at 1 mv/cm. As a quality control measure, the research assistants received periodical training on skin preparation, electrode placement and positioning of the participants. A certified cardiologist checked the electrocardiograms. The Cardiax device is equipped with software that automatically measures the amplitudes and the duration of the waves in each of the 12 leads. All measurements were exported into Excel and subsequently imported in SAS. Low frequency noise originating from movement, baseline wander, respiration and high frequency noise emanating from power-line or radiated electromagnetic influence were filtered before the final signal acquisition. In accordance with the recommendations of the American Heart Association [Citation16], cut-off values were set at 0.05 Hz and 150 Hz for the low and high frequency filters, respectively. Based on the Sokolow–Lyon criteria [Citation17], we calculated the QRS voltage as sum of the S wave in lead V1 plus the highest R wave in V5 or V6. LVH was diagnosed if the QRS voltage >3.5 mV.
Other measurements
The research assistants administered a standard questionnaire to collect information on relevant medical history, alcohol and cigarette consumption, and intake of medications. Weight and height were measured with a weighing scale and stadiometer respectively and body mass index calculated as body weight in kilograms divided by height in meters squared. Skinfold thickness was the average of measurements obtained at 3 sites, i.e. the triceps, subscapular area, and suprailiac crest, by means of the Harpenden Skinfold Caliper (Bedfordshire, UK) providing a constant pressure of 0.01 kg per mm2 (0.098 N/mm2) at all openings of the 90 mm2 anvils. Diabetes mellitus was a self-reported diagnosis, use of anti-diabetic drugs or fasting or random plasma glucose equal to or exceeding 7.0 or 11.1 mmol/L.
Statistical analysis
For database management and statistical analysis, we used SAS software version 9.4. (SAS Institute, Cary, NC). We used means and standard deviation to express central tendency and spread of the data. For comparison of means and proportions, we used Student’s t-test and the χ2 statistic, respectively. Statistical significance was a p-value less than 0.05 on two-sided tests. We assessed associations using Pearson’s correlation coefficients and we used Steiger’s Z test in the pairwise comparison of correlation coefficients. We used multiple linear regression to adjust for confounders, while assessing the relation of Sokolow–Lyon QRS voltage with the central and peripheral blood pressure indices. Using multiple logistic regression models, we determined the odds ratio of having LVH associated with a one standard deviation higher central or peripheral blood pressure. Each central BP component is highly correlated with the corresponding peripheral component. To evaluate the association of Sokolow–Lyon QRS voltage with central and peripheral blood pressure indices, we first regressed each central BP index on the peripheral and derived the residuals, which represents the amount of variation in the central BP that could not be explained by the peripheral. We regressed the continuous and dichotomous indices of LVH on these residuals. The p values of the residuals test the hypothesis that the central BP index is associated with ECG LVH over and above the peripheral.
Results
Characteristics of participants
reports the main clinical characteristics of the subjects according to sex. Women were significantly younger (35.5 vs 41.0 years; p < 0.0001), more obese, i.e. body mass index greater than 30 kg/m2 (33.8 vs 15.9%) and had thicker skin folds (21.8 vs 15.3 mm). The women however less frequently reported alcohol intake (23.0 vs 43.2%, p < 0.05) and none of them smoked cigarette. While hypertension was more prevalent in men (8.0 vs 1.4%), more women were diabetic (6.8% vs 4.1%).
Table 1. Characteristics of participants by sex.
Both peripheral (115.1/74.9 vs 108.6/69.2 mmHg) and central (103.9/76.4 vs 97.9/69.3 mm Hg) systolic and diastolic blood pressures were significantly higher (p < 0.05) in men compared to women. The central augmentation index (123.7 vs 114.7) was higher (p < 0.001) in women as compared to men. The women had a tendency towards a higher heart rate (72.6 vs 70.8 beats per min, p > 0.05)
Association of Sokolow–Lyon QRS voltage with Central vs peripheral blood pressure components
In univariable analysis (), Sokolow–Lyon QRS voltage correlated significantly and positively with both peripheral and central systolic (r = 0.32 and 0.25), diastolic (0.19 and 0.16), pulse (0.27 and 0.20) and mean arterial pressure (0.25 and 0.20). In comparison with central blood pressure indices, the strength of the association was higher (p < 0.05) for peripheral systolic but was similar (p > 0.05) for diastolic, pulse and mean arterial pressure.
Table 2. Correlations between central and peripheral BP components to Sokolow–Lyon QRS voltage.
reports the multivariable adjusted associations between the Sokolow–Lyon QRS voltage and blood pressure indices. The association of Sokolow–Lyon QRS voltage with peripheral systolic, diastolic, pulse and mean arterial pressures were maintained after adjustment for age, body mass index and skin fold thickness. 1 SD increase in systolic, diastolic, pulse or mean arterial pressures were associated with 0.34, 0.21, 0.22 and 0.29 mv respective increases (p < 0.01) in the QRS voltage. In contrast, after adjustment for the same confounding variables, only central systolic, pulse and mean arterial pressures were significantly associated with Sokolow–Lyon QRS voltage. 1 SD in the aforementioned BP indices, increased Sokolow–Lyon QRS voltage by 0.26, 0.24 and 0.19 mv respectively; (p < 0.01).
Table 3. Correlations between central and peripheral BP components to Sokolow–Lyon QRS voltage.
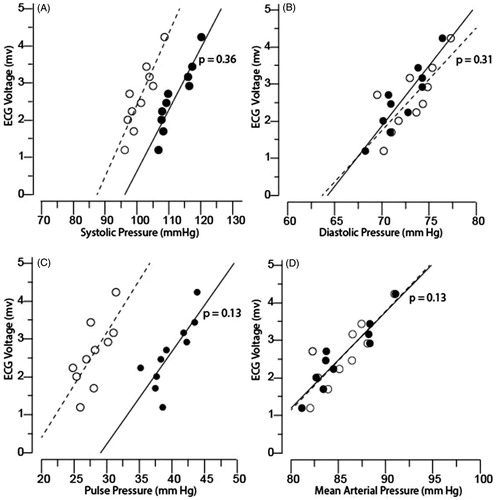
In , we demonstrate that the slopes of the relations between Sokolow–Lyon QRS voltage and either central or peripheral blood pressure indices were similar (p > 0.05) using plots of blood pressure indices by deciles against mean QRS voltage. Figure S1 shows a plot of central and peripheral blood pressure indices against QRS voltage.
Figure 2. The Sokolow–Lyon voltage plotted against brachial (dot) and central (circle) A; systolic, B; diastolic, C; pulse, and D; mean arterial blood pressures. The data markers are averages by deciles of the distributions of ECG indexes. The lines are the slopes of the ECG indexes on brachial and central pressures averaged by deciles of the distributions of the ECG indexes. p is the significance of the difference between the slopes for brachial and central pressures.
Association of left ventricular hypertrophy with peripheral vs Central blood pressure components
shows the adjusted odds ratio for the associations of LVH analysed on a dichotomous scale with both central and brachial blood pressure indices. A 1 SD higher brachial systolic, pulse, and mean arterial blood pressures were associated with a relative risk of 2.62 (CI, 1.49–4.65; p < 0.001), 1.88 (CI, 1.19–2.95; p < 0.01) and 2.16 (CI, 1.22–3.82; p < 0.01) of LVH respectively. The odds ratio relating LVH to 1 SD higher corresponding central pressure indices were 2.41 (CI, 1.33–4.36), 2.04 (CI 1.23–3.37), and 2.00 (CI, 1.11–3.63) respectively. p values for comparison between all brachial and central indices were >0.05.
Table 4. Multivariable-adjusted odds ratios for having LVH in relation to brachial or central blood pressure indices.
Discussion
The main aim of the present study was to assess the association of ECG Sokolow–Lyon QRS voltage and left ventricular hypertrophy with central and peripheral blood pressure indices in a population sample of adult Nigerians. The key findings were Sokolow–Lyon QRS voltage correlated significantly with both central and peripheral BP indices however, the strength of this association did not differ significantly between peripheral and central indices.
To our knowledge, only one previous study [Citation11] compared the strength of association of electrocardiographically determined left ventricular hypertrophy with brachial and central blood pressure indices. Wohlfahrt and colleagues [Citation11] assessed the Sokolow–Lyon index and central blood pressure determined by applanation tonometry (SphygmoCor, Atcor Medical Ltd, West Ryde, Australia) in 728 participants, enrolled in the Czech post-MONICA study (Monitoring Trends and Determinants in Cardiovascular Disease). They divided the participants into two groups, using an arbitrary age threshold of 45 years. In the younger participants (age <45 years), the standardized regression coefficients relating the Sokolow–Lyon index to blood pressure with adjustments applied for sex and body mass index were 0.04 mv/mm Hg (p = 0.56) vs. 0.10 mV/mm Hg (p = 0.15) for peripheral vs. central systolic blood pressure and 0.09 mV/mm Hg (p = 0.23) vs. 0.90 mv/mm Hg (p = 0.20) for peripheral vs. central pulse pressure. The authors did not compare the estimates produced by peripheral vs. central blood pressure. In the older participants, using multivariable logistic regression analysis, the standardized odds ratios relating left ventricular hypertrophy to blood pressure were 1.046 vs. 1.113 for peripheral vs. central systolic blood pressure and 1.034 vs. 1.101 for peripheral vs. central pulse pressure. They adjusted for sex, age, heart rate and use of antihypertensive drugs, and reported that all odds ratios were significant (p < 0.001). To compare the strength of association of left ventricular hypertrophy with central versus peripheral blood pressure indices, the authors reported that in older participants the area under the curve for discriminating electrocardiographic left ventricular hypertrophy was 0.90 vs. 0.83 for central vs. peripheral systolic blood pressure (p < 0.05) and 0.90 vs. 0.81 for central vs. peripheral pulse pressure (p < 0.05). They concluded that the central pressure in older individuals was more strongly related to electrocardiographic left ventricular hypertrophy than brachial pressure, but that in younger subjects the voltage criteria of left ventricular hypertrophy were not independently associated with central and brachial blood pressure. It is difficult to interpret the report of Wolfarhart and co-workers [Citation11] because the 45-year age threshold is arbitrary and the percentage of younger participants on antihypertensive medication was neither stated nor the use of antihypertensive medication adjusted for in the regression equation.
The central blood pressure is lower than the brachial pressure because of the amplification of pressure as it travels down the arterial tree. Several factors including aortic stiffness, heart rate, sex, and height are responsible for this difference in pressure between the aorta and the brachial pressures [Citation18,Citation19]. As pulse wave is propagated from more elastic aorta down to the stiffer brachial artery, reflections of the forward wave occurs at arterial branch points or points of impedance mismatch along the arterial tree. In stiffer arteries, the velocity of the reflected waves is high and as such, the reflected waves meet the forward wave towards the peak and cause an augmentation in the aortic wave. The aortic pressure therefore increases leading to a reduction in the brachial-aortic pressure discrepancy. This explains why central pressure augmentation is higher in older individuals, hypertensive patients or patients groups with higher incidence of atherosclerosis [Citation20]. With stiffer arteries, amplification of the central-peripheral BP difference reduces and brachial artery pressure tends to equalise with the central pressures. With stiffer arteries therefore, the brachial pressure approximates the central pressure and may predict intermediate cardiovascular phenotypes such as left ventricular mass equally as the central blood pressure.
Although our present report is based on a relatively young population of adult Nigerians (mean age 38.5 years), there is a growing evidence [Citation21–25], that suggests that Blacks are likely to have acceralated vascular aging compared to other ethnic groups. Our group had earlier reviewed [Citation26] the properties of central arteries among subjects of different ethnicities using published characteristics of arterial pulse wave recorded with SphygmoCor device. Three different ethnic populations comprising of Asians [Citation27], Caucasians [Citation28] and Africans [Citation29] were included in that review. The South Africans (of African ancestry) had higher central pressures and thus reduced amplification of central to brachial pressure compared with the Asians and Caucasians.
Our study should be interpreted within the context of its potential limitations. The central pulse wave was derived from a peripheral waveform obtained by applanation tonometry on the radial artery. The calibration was done with blood pressures obtained from the brachial artery. Such an approach would have introduced some errors as some brachial to radial amplification might result in the underestimation of the central pressures [Citation30]. Obtaining brachial waveform is however technically difficult and the generalized transfer function employed by the SphygmoCOr software has been validated at least in other ethnic populations. We considered only the Sokolow–Lyon criteria among the published criteria [Citation16] for assessing left ventricular hypertrophy. Diagnostic performance of Sokolow–Lyon criteria has been evaluated among Nigerians [Citation31]. Our study involved a small sample size and may not be generalized among Blacks in the sub-Saharan Africa. Our results, however, have external validity as it is in line with findings among other individuals of African descent [Citation23,Citation29]. Additionally, we employed very strict quality control measures in obtaining the brachial blood pressure, the radial artery pulse wave and the ECG measurements.
Our present result suggests that measuring central blood pressures for assessment of cardiac target organ damage may not add any incremental value above the brachial blood pressure. This is particularly important in resource poor settings such as in sub-Saharan Africa where equipment such as SphygmoCor for measuring central haemodynamics is still not commonly available.
Summary Table
Figure_S1_Nich4_Supp.docx
Download MS Word (96.6 KB)Acknowledgements
The authors gratefully acknowledge the expert clerical assistance of Mrs. Vera De Leebeeck and Mrs. Renilde Wolfs (Studies Coordinating Centre, Leuven, Belgium).
Disclosure statement
No potential conflict of interest was reported by the authors.
References
- Hsieh BP, Pham MX, Froelicher VF. Prognostic value of electrocardiographic criteria for left ventricular hypertrophy. Am Heart J. 2005;150:161–167.
- Arnett DK, Rautaharju P, Crow R. Black–white differences in electrocardiographic left ventricular mass and its association with blood pressure (the ARIC Study). Am J Cardiol. 1994;74:247–252.
- Lorber R, Gidding SS, Daviglus ML, et al. Influence of systolic blood pressure and body mass index on left ventricular structure in healthy African-American and White young adults: The CARDIA Study. J Am Coll Cardiol. 2003;41:955–960.
- Fox E, Taylor H, Andrew M. Body mass index and blood pressure influences on left ventricular mass and geometry in African Americans: the atherosclerotic risk in communities (ARIC) study. Hypertension. 2004;44:55–60.
- McEniery CM, Cockcroft JR, Roman MJ, et al. Central blood pressure: current evidence and clinical importance. Eur Heart J. 2014;35:1719–1725.
- Wijkman M, Lanne T, Grodzinsky E, et al. Ambulatory systolic blood pressure predicts left ventricular mass in type 2 diabetes, independent of central systolic blood pressure. Blood Press Monit. 2012;17:139–144.
- Sharman JE, Fang ZY, Haluska B, et al. Left ventricular mass in patients with type 2 diabetes is independently associated with central but not peripheral pulse pressure. Diabetes Care. 2005;28:937–939.
- Roman MJ, Okin PM, Kizer JR, et al. Relations of central and brachial blood pressure to left ventricular hypertrophy and geometry: the strong heart study. J Hypertens. 2010;28:384–388.
- Neisius U, Bilo G, Taurino C, et al. Association of central and peripheral pulse pressure with intermediate cardiovascular phenotypes. J Hypertens. 2012;30:67–74.
- Perez-Lahiguera FJ, Rodilla E, Costa JA, et al. Relationship of central and peripheral blood pressure to left ventricular mass in hypertensive patients. Rev Esp Cardiol (Engl Ed). 2012;65:1094–1100.
- Wohlfahrt P, Wichterle D, Seidlerova J, et al. Relation of central and brachial blood pressure to left ventricular hypertrophy. The Czech post-MONICA Study. J Hum Hypertens. 2012;26:14–19.
- Odili AN, Ogedengbe JO, Nwegbu M, et al. Nigerian population research on environment, gene and health (NIPREGH)—objectives and protocol. J Biomed Res. 2014;28:360–367.
- World Medical Association declaration of Helsinki. Recommendations guiding physicians in biomedical research involving human subjects. J Am Med Assoc. 1997;277:925–926.
- Mancia G, Fagard R, Narkiewicz K, et al. 2013 ESH/ESC Guidelines for the management of arterial hypertension: the task force for the management of arterial hypertension of the European Society of Hypertension (ESH) and of the European Society of Cardiology (ESC). Eur Heart J. 2013;34:2159–2219.
- Pauca AL, O’Rourke MF, Kon ND. Prospective evaluation of a method for estimating ascending aortic pressure from the radial artery pressure waveform. Hypertension. 2001;38:932–937.
- Hancock EW, Deal BJ, Mirvis DM. AHA/ACCF/HRS recommendations for the standardization and interpretation of the electrocardiogram: part V: electrocardiogram changes associated with cardiac chamber hypertrophy: a scientific statement from the American Heart Association Electrocardiography and Arrhythmias Committee, Council on Clinical Cardiology; the American College of Cardiology Foundation; and the Heart Rhythm Society. Endorsed by the International Society for Computerized Electrocardiology. J Am Coll Cardiol. 2009;53:992–1002.
- Sokolow M, Lyon TP. The ventricular complex in left ventricular hypertrophy as obtained by unipolar precordial and limb leads. Am Heart J. 1949;37:161–186.
- Pichler G, Martinez F, Vicente A, et al. Pulse pressure amplification and its determinants. Blood Press. 2016;25:21–27.
- Herbert A, Cruickshank JK, Laurent S, et al. Establishing reference values for central blood pressure and its amplification in a general healthy population and according to cardiovascular risk factors. Eur Heart J. 2014;35:3122–3133.
- McEniery CM, Yasmin MB, et al. Central pressure: variability and impact of cardiovascular risk factors: the Anglo-Cardiff Collaborative Trial II. Hypertension. 2008;51:1476–1482.
- Morris AA, Patel RS, Binongo JN, et al. Racial differences in arterial stiffness and microcirculatory function between Black and White Americans. J Am Heart Assoc. 2013;2:e002154.
- Heffernan KS, Jae SY, Wilund KR, et al. Racial differences in central blood pressure and vascular function in young men. Am J Physiol Heart Circ Physiol. 2008;295:H2380–H2387.
- Din-Dzietham R, Couper D, Evans G, et al. Arterial stiffness is greater in African Americans than in whites: evidence from the Forsyth County, North Carolina, ARIC cohort. Am J Hypertens. 2004;17:304–313.
- Thurston RC, Matthews KA. Racial and socioeconomic disparities in arterial stiffness and intima media thickness among adolescents. Soc Sci Med. 2009;68:807–813.
- Goel A, Maroules CD, Mitchell GF, et al. Ethnic difference in proximal aortic stiffness: an observation from the Dallas Heart Study. JACC Cardiovasc Imag. 2017;10:54–61.
- Odili AN, Gu Y, Staessen JA. Properties of central arteries in populations of different ethnicity: ethnicity and central arteries. In: Safar ME, O'Rourke MF, Frohlich ED, editors. Blood pressure and arterial wall mechanics in cardiovascular diseases. London: Springer London; 2014. p. 459–464.
- Li Y, Staessen JA, Li LH, et al. Reference values for the arterial pulse wave in Chinese. Am J Hypertens. 2008;21:668–673.
- Wojciechowska W, Staessen JA, Nawrot T, et al. Reference values in white Europeans for the arterial pulse wave recorded by means of the SphygmoCor device. Hypertens Res. 2006;29:475–483.
- Shiburi CP, Staessen JA, Maseko M, et al. Reference values for SphygmoCor measurements in South Africans of African ancestry. Am J Hypertens. 2006;19:40–46.
- Climie RE, Picone DS, Keske MA, et al. Brachial-to-radial systolic blood pressure amplification in patients with type 2 diabetes mellitus. J Hum Hypertens. 2016;30:404–409.
- Dada A, Adebiyi AA, Aje A, et al. Standard electrocardiographic criteria for left ventricular hypertrophy in Nigerian hypertensives. Ethn Dis. 2005;15:578–584.