
Abstract
Purpose
Out-of-office blood pressure (BP) measurements are essential for the diagnosis and monitoring of hypertension. Current guidelines vary in their recommendations on the protocol for home blood pressure monitoring (HBPM). We aimed to assess the number of blood pressure (BP) measurement days needed for a reliable estimation of true home BP (the expected BP level over time) and hypertension status, using the European guideline-based 7-day HBPM protocol as a reference.
Materials and Methods
Data from 567 adults who performed a 7-day HBPM were analysed. Blood pressure was measured twice daily (morning and evening readings) using the Microlife Average Mode (MAM), which takes a weighted average of 3 consecutive BP readings. The variability of average BP for an increasing number of measurements was assessed using a linear mixed model including a random intercept per individual and correlated residuals. The reliability of home hypertension status was assessed by the κ statistic.
Results
Mean home BP of the population was 143 ± 16/84 ± 10 mm Hg. On average, the first BP measurements gave the highest values which then decreased over time. Systolic BP in the morning was systematically lower than systolic BP in the evening (142 ± 17mm Hg versus 144 ± 17 mm Hg, p <0.05). The average of 7 twice-daily MAM BP measurements was at most 5.2/3.3 mm Hg higher and 9.5/4.8 mm Hg lower than the true home BP for 95% of the individuals. Reducing this protocol to 3 days increased this variability by 1.5/1.0 mm Hg and 4.8/2.3 mm Hg, respectively. For diagnosing home hypertension, there was good agreement with a minimum of 4.5 days of HBPM (ĸ-statistic 0.88; 95% Confidence Interval: 0.82–0.94).
Conclusion
Twice-daily MAM BP measurements for 3 consecutive days provide a reliable estimate of home BP. At least 4.5 consecutive days of HBPM are required for a reliable diagnosis of home hypertension.
Introduction
Guidelines for the management of hypertension recommend the use of out-of-office blood pressure (BP) measurements, either by home blood pressure monitoring (HBPM) or ambulatory blood pressure monitoring (ABPM), to diagnose and monitor hypertension [Citation1,Citation2]. Out-of-office BP measurements are not only essential for the detection of white-coat and masked hypertension but are also superior to conventional office BP measurements in predicting cardiovascular events [Citation3]. Advantages of HBPM over ABPM include its practicality (lower costs and greater patient tolerability) and the ability to take BP measurements over multiple days, allowing evaluation of BP trends [Citation4]. Furthermore, by enabling self-monitoring and feedback, HBPM has been shown to increase patient engagement, improve medication adherence, and lower BP [Citation5,Citation6].
To date, several studies evaluated the HBPM protocol that provides a reliable and reproducible assessment of the home BP of an individual [Citation7]. However, protocols of these studies varied widely in terms of population (normotensive versus hypertensive subjects), number of participants, type of analysis (ranging from the use of test-retest correlations and the standard deviation (SD) of differences to the use of ANOVA models), and method of BP measurement (e.g. different number of measurements per occasion). This resulted in diverging conclusions regarding the optimal HBPM protocol [Citation7]. Consequently, recommendations on the HBPM protocol for diagnosing hypertension differ between guidelines as they are mainly based on expert opinion. For example, the 2021 European Society of Hypertension (ESH) practice guideline recommends twice-daily measurements for at least 3 but preferably 7 consecutive days, whereas the 2017 American College of Cardiology (ACC)/American Heart Association (AHA) guidelines recommend that home BP should only be based on an average of readings on ≥2 occasions, which is a less intensive and more patient-friendly protocol [Citation2,Citation8]. More clarity is needed on the precision of the estimate of home BP obtained with different HBPM protocols to ultimately make a recommendation on the HBPM protocol that will provide a sufficiently reliable estimate of home BP while minimising patient burden.
Therefore, the aim of this study was to evaluate the number of BP measurement days needed to obtain a reliable estimate of home BP using the current 7-day HBPM protocol as recommended by the European guidelines as a reference. In addition, we examined the required number of BP measurement days to reliably diagnose home hypertension.
Methods
Study design and population
This was an observational study in which data were gathered between October 2017 and July 2021 via the self-management platform EmmaHBPM developed by MedicineMen B.V. (Hilversum, The Netherlands) [Citation9]. This platform enables physicians (from both general practice and hypertension clinics) to support their patients in monitoring their blood pressure by obtaining BP data via the Emma smartphone application. Blood pressure measurements taken with the validated Microlife BP A6 BT AFIB device (Microlife Corp, Widnau, Switzerland) [Citation10] can be transferred to the EmmaHBPM application using Bluetooth. The EmmaHBPM application is then able to graphically display the data and provide the patients and their physicians more insight into the patient's BP. Due to the observational nature of the study (anonymized data collected in routine clinical care) in which individuals were not subjected to procedures and were not required to follow rules of behaviour, no formal consent was needed [Citation11]. This was approved by the institutional ethics committee (Medisch Ethische Toetsingscommissie Utrecht, University Medical Center Utrecht, Utrecht, The Netherlands).
Home BP measurements
For this study, data were used from adults who completed their first HBPM with EmmaHBPM. Home blood pressure monitoring was performed in accordance with the recommendations in the 2018 ESC/ESH Guidelines for the management of hypertension [Citation8]. Blood pressure measurements were performed at the subject’s home, twice a day, once in the morning (6:00–9:00) and once in the evening (18:00–21:00) for a 7-day period. Subjects were instructed to perform BP measurements before drug intake (if treated), after 5 min of rest, in a sitting position using a Microlife BP A6 BT AFIB device that features a Microlife Average Mode (MAM) mode. The MAM mode calculates a weighted average of a minimum of 3 consecutive BP readings with standardised 15-second intervals. In this mode, a specific algorithm takes into account the change in BP between sequential readings to determine the weight for the average of all readings. If the difference in consecutive measurements exceeds 40 mm Hg for systolic BP (SBP) and 25 mm Hg for diastolic BP (DBP), the highest measurement is rejected and an additional fourth measurement is taken. If the difference is between 18 and 40 mm Hg for SBP and between12 and 25 mm Hg for DBP, the higher measurement contributes only 50% to the average [Citation12]. After calculation of the weighted average, the device discards the three separate measurements obtained.
Statistical analysis
Characteristics of subjects included in the current analysis were summarised as number and percentage for categorical variables and mean ± SD for continuous variables. Fourteen MAM measurements (based on 42 underlying BP readings) were averaged to give a single estimate of home BP per patient. Average BP was also calculated for each day separately. The student’s paired t-test was used for the exploratory comparison of home BP obtained at different measurement occasions.
To evaluate the variability of the average of an increasing number of home BP measurements, linear mixed models (LMM) were fitted (see Supplementary File 1). Based on the pattern in average blood pressure over time, day (days 1–7) and part of the day (morning/evening) were included as fixed effects in the models (see Supplementary Tables 1–2). Random intercepts for subjects accounted for the dependence of repeated measurements and the variability between subjects. To account for remaining correlations between the BP measurements within each subject, various correlation structures for the model residuals were evaluated. Based on Akaike Information Criterion (AIC), the autoregressive-moving average correlation structure of order p = 5 [Citation13] was selected as the best fitting correlation structure. Fundamental assumptions of LMM (e.g. normality of the residuals and homogeneity of variance) were tested to ensure the accuracy of the results.
Maximal deviation from the true home BP, defined as the expected level of BP over time and the BP that is ultimately responsible for the adverse effects of hypertension [Citation14], for 95% of the individuals was calculated by two steps. First, the standard error of the average BP (derived from the covariance matrix of the fitted model (see Supplementary Tables 3–4) was multiplied by 1.96 (approximate value of the 97.5 percentile point of the standard normal distribution) [Citation15]. Second, to correct for the systematic difference related to day of measurement and moment of measurement (morning/evening), identified via the exploratory analyses before fitting the LMM, the confidence interval (CI) obtained at the first step was shifted by subtracting the estimates of the fixed effects from both CI limits. To quantify the sampling variability of this maximal deviation, the estimation procedure described above was repeated on 1000 datasets simulated from the fitted multivariate normal distribution.
A maximum increase of 5 mm Hg in the maximal deviation of the current 7-day HBPM protocol for both SBP and DBP was considered acceptable based on the previously observed reduction in cardiovascular morbidity and mortality associated with this increase [Citation16].
The reliability of home hypertension status between the current HBPM protocol and protocols with a reduced number of BP measurements was assessed using the kappa (κ) statistic. For this analysis, the average of all fourteen BP measurements was considered the true home BP per patient. Home hypertension was defined as mean home systolic BP ≥135 mm Hg and/or mean home diastolic BP ≥85 mm Hg, which is in line with the current European guidelines [Citation1]. We considered a 95% lower confidence limit (LCL) of the κ statistic ≥0.80 as the criterion for good agreement[Citation17,Citation18].
To evaluate whether the variability of the average home BP and reliability of home hypertension status differed by sex, age (<65 years and ≥65 years), and healthcare domain (general practice or hospital), strata-specific estimates were assessed graphically. All analyses were performed with R statistical software (Version 3.5.1; R Foundation for Statistical Computing, Vienna, Austria). All p-values were two-tailed, with statistical significance set at 0.05.
Results
Characteristics study population
shows the characteristics of the 567 subjects included in the analysis. The mean age was 62 ± 14 years, 299 (53%) subjects were male, and most of the subjects were from general practice (82%). The mean home BP for the study population was 143 ± 16/84 ± 10 mm Hg (based on all fourteen BP measurements). displays the sample mean of each BP reading during a 7-day period. For both systolic and diastolic home BP, the first two measurements (first day) gave the highest value which then decreased over time (average SBP first day; 146 ± 19 mm Hg versus average SBP day 2–7; 142 ± 16 mm Hg, mean difference 3.8 mm Hg, 95%CI 2.9–4.7, p <0.05). For systolic home BP, morning BP was consistently lower compared to evening BP (average morning BP; 142 ± 17 mm Hg versus average evening BP; 144 ± 17 mm Hg, mean difference 2.0 mm Hg, 95%CI 1.8-2.3, p <0.05,). For diastolic home BP, morning BP was slightly higher compared to evening BP (average morning BP; 84.5 ± 10 versus average evening BP; 83.9 ± 10 mm Hg, mean difference 0.6 mm Hg, 95%CI 0.1–1.0, p <0.05).
Figure 1. Mean home blood pressure (BP) during the current European guideline-based 7-day HBPM protocol (2 measurements per day).
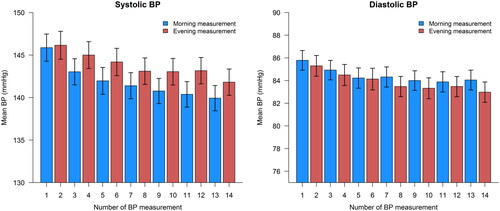
Table 1. Characteristics of the study population. All data in n (%) or mean ± standard deviation.
Precision of home BP measurements
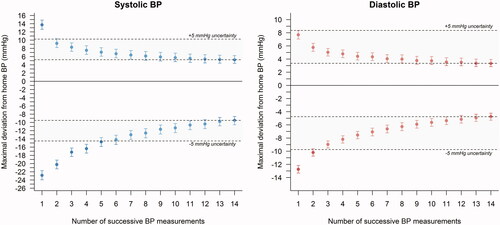
shows the variability of average home BP for an increasing number of BP measurements obtained on succeeding days. The 7-day HBPM protocol resulted in an average BP that is at most 5.2/3.3 mm Hg higher and 9.5/4.8 mm Hg lower than the true home BP for 95% of the individuals. Most decline in variability of the average home BP was achieved by averaging 6 successive readings (3 days) for systolic home BP and 3 successive readings (1.5 days) for diastolic home BP (increase in positive deviation of 1.5/1.0 mm Hg and negative deviation of 4.8/2.3 mm Hg) with little further decline (<5 mm Hg; shaded grey area) by averaging more readings. Results were similar for different subgroups (males and females, younger (≤ 65 years) and older (>65 years) persons, and healthcare domain (general practice or hospital)) (see Supplementary Figure 1).
Figure 2. Maximal deviation from home blood pressure of an increasing number of successive home BP readings for 95% of individuals. Positive deviation calculated as 1.96 × standard error of average BP + systematic bias of average BP. Negative deviation calculated as −1.96 × standard error of average BP − systematic bias of average BP.
First day versus consecutive days of home BP
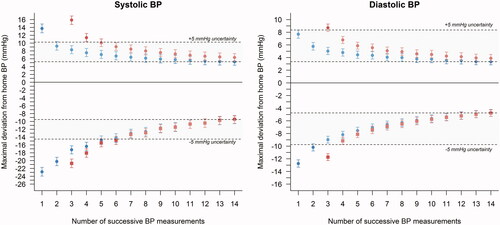
Based on the observed higher average BP on the first day of HBPM, variability was also evaluated by omitting the first two measurements (first day). shows the variability of the average home BP by an increasing number of succeeding BP measurements with (blue circles) and without (red squares) BP measurements performed on the first day. Excluding first-day BP measurements from the analysis resulted in slightly higher variability of the cumulative average home BP on the second and third measurement day, but did not affect the variability of the cumulative average BP after 7 measurement days.
Figure 3. Maximal deviation from home blood pressure of an increasing number of successive home BP readings for 95% of individuals with (blue circles), and without (red squares) BP readings taken on day 1. Positive deviation calculated as 1.96 × standard error of average BP + systematic bias of average BP. Negative deviation calculated as −1.96 × standard error of average BP − systematic bias of average BP.
Reliability of home hypertension status
Using the BP thresholds recommended in the 2018 ESC/ESH hypertension guidelines [Citation1], seventy-five percent of the study population had home hypertension. To obtain good agreement (LCL κ statistic ≥0.80) with the current 7-day HBPM protocol, a minimum of 9 consecutive BP readings (5 morning readings and 4 evening readings) was needed (κ statistic 0.88; 0.82–0.94) (see and ; 95% LCL of the κ statistic ≥0.80 at 9 consecutive BP readings). This number of 9 consecutive BP measurements carried a sensitivity of 0.99 (95%CI 0.97–1.00) and a negative predictive value of 0.96 (95%CI 0.90–0.99) (see ). Subgroup analyses showed similar results (see Supplementary Figure 2).
Figure 4. Agreement of home hypertension status is determined with an increasing number of successive BP readings expressed by the kappa (ĸ) statistic. Home hypertension: Mean home systolic blood pressure (BP) ≥135 mm Hg or home diastolic BP ≥85 mm Hg. Good agreement: 95% lower confidence limit (LCL) of the κ statistic ≥0.80.
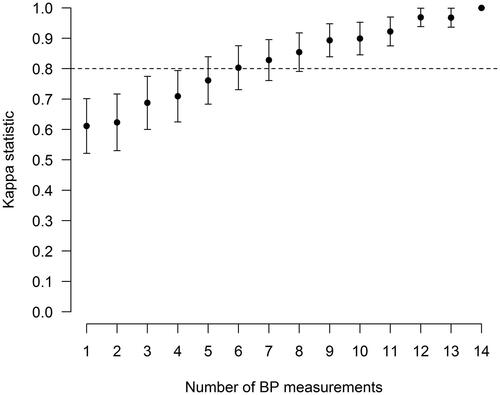
Table 2. Agreement between the increasing number of successive home BP measurements and the current 7-day HBPM protocol for the diagnosis of home hypertension (mean home systolic BP ≥135 mm Hg and/or mean home diastolic BP ≥85 mm Hg).
Discussion
The present study shows that the 7-day HBPM protocol, based on the European guidelines, resulted in an average BP that is at most 5.2/3.3 mm Hg higher and 9.5/4.8 mm Hg lower than the true home BP for 95% of the individuals. Reducing this protocol to a minimum of 3 days will maintain this variability within acceptable limits (within 5 mm Hg) of the variability of the 7-day HBPM protocol. Moreover, to reliably diagnose home hypertension, a minimum of 4.5 consecutive measurement days is required.
In recent years, several studies investigated the optimal number of home BP measurements to obtain a reliable assessment of someone’s true home BP. A systematic review published in 2019 retrieved 27 studies examining the reproducibility and/or accuracy of HBPM and 10 studies that related HBPM protocols to cardiovascular prognosis [Citation7]. This review concluded that the measurement of home BP should be measured for at least 3 days, which was primarily based on findings from studies evaluating its association with prognosis that showed little further increase in prognostic power after 3 days. However, the large heterogeneity and variable methodological quality of the included studies prevented drawing firm conclusions regarding the exact number and timing of BP measurements. A more recent study, not included in this systematic review, conducted in community-dwelling adults not taking antihypertensive medication supported this recommendation by showing that the average of 2 morning and 2 evening readings or 1 morning and 1 evening reading over 3 days of HBPM were needed to reliably estimate true home BP [Citation19]. In contrast to our study, most previous studies evaluated the total variability of the average home BP, which is composed of within- and between-subject variability. However, to make a statement about the maximal deviation of a measured BP from an individual’s true home BP, within-subject variability is needed. By using a mixed model (to obtain this within-subject variability) the current study demonstrated that a greater number of BP measurements, until the maximum available number of 14 BP measurements, resulted in a progressively lower variability of an individual’s true home BP. However, acceptable variability of the average BP (within 5 mm Hg of the variability of the 7-day BP average) was already achieved within the first 3 measurement days, which is consistent with the recommendations of the abovementioned studies. While a larger number of home BP measurements may improve precision, a longer HBPM protocol may also lower a patient’s adherence to such a protocol. Therefore, a shorter, and thus probably less burdensome, measurement protocol might increase adherence and is thus preferred in clinical practice and by patients [Citation20]. The relatively small benefit in precision obtained by more than 3 measurement days suggests that a prolonged HBPM protocol is likely to be useful only around diagnostic or treatment thresholds.
In line with previous studies [Citation21–26], this study demonstrated a higher average BP on the first measurement day compared to subsequent days. This behaviour of home BP is comparable to that of office BP, which is known to decline on repeated measurements during the same visit [Citation27]. For calculation of the average home BP, previous studies suggest that the first day(s) of HBPM should therefore be discarded [Citation21,Citation24]. However, as shown in this study, discarding first-day measurements did not alter the maximal deviation of the cumulative average BP on the last measurement day. Discarding first-day measurements even resulted in somewhat higher variability of the cumulative average BP on the second and third measurement days. This suggests that despite the presence of systematic difference on the first days of measurement, this does not outweigh the additional variability due to a reduction in the number of measurements. Based on this, first-day measurements should be included in the calculation of the average BP. This is consistent with recommendations from previous studies that evaluated the correlation of HBPM protocols in- and excluding first-day BP measurements with ABPM [Citation28–30].
The consistently lower SBP in the morning compared to the evening, as observed in this study, is in accordance with several previous studies [Citation22,Citation24,Citation26]. Some studies, however, report higher home BP values in the morning [Citation31,Citation32]. This difference can potentially be explained by the fact that these studies were conducted in Asian populations in which evening measurements were taken before bedtime and after bathing [Citation33], whereas, in the present study, evening measurements were taken during a more active part of the day (between 18:00 and 21:00), which is generally several hours before bedtime. Furthermore, a depressor effect of alcohol intake on evening BP, combined with a pressor effect in the morning, resulting in a net increase in morning BP, has been demonstrated by several studies [Citation33,Citation34].
A major strength of this study is the large set of routinely collected data, which enabled us to fit more complex models including correlation structures and to perform subgroup analyses. Moreover, the inclusion of correlation structures into our models reduced the risk of underestimation of the variability of the average BP. Also, the application of the MAM algorithm by the Microlife BP A6 BT device ensured standardised measurements (3 consecutive BP readings with 15-second intervals) for the entire study population and thereby minimised the impact of measurement error on the variability.
Some limitations also need to be considered. First, data on several relevant patient characteristics such as comorbidities and use of antihypertensive medication were not available. Additional subgroup analyses, to make more specific statements about the heterogeneity of variability of average BP, were therefore not possible. Moreover, some classes of antihypertensive drugs (e.g. β-blockers and calcium channel blockers) can affect BP variability [Citation35,Citation36], which could have resulted in an underestimation of the estimated variability of home BP. Second, due to use of the MAM algorithm, only a weighted average of 3 consecutive measurements was available for the analysis. Consequently, it was not possible to evaluate the optimal number of BP readings per measurement occasion. Moreover, use of the MAM algorithm may have led to an underestimation of the variability, since less weight is given to extreme measurements in the calculation of the average. Therefore, application of current findings into clinical practice require the use of a BP monitor equipped with a MAM mode [Citation37]. Lastly, an important limitation of this study is the lack of data regarding the reference standard ABPM and cardiovascular outcomes. For defining the most optimal HBPM protocol, the relation to both ABPM and cardiovascular outcomes should be taken into account. To investigate the relation between ABPM and the HBPM protocol as applied in this study, a randomised cross-over study called Ambulant versus Unattended & Attended office versus Self home Blood Pressure measurement (AMUSE-BP) is now being conducted (Netherlands Trial Register: NL8277).
In conclusion, this study showed that measurement of home BP twice daily (1 morning and 1 evening MAM reading) for 3 consecutive days provides a reliable estimate of home BP. At least 4.5 consecutive measurement days are required for a reliable diagnosis of home hypertension. These findings suggest that the 7-day HBPM protocol as recommended by the European guidelines can be reduced to 4.5 consecutive days when the goal is to confirm the diagnosis of hypertension. When the goal is monitoring, the HBPM protocol could even be tailored to 3 consecutive days without substantially affecting the variability of the average home BP as obtained by a 7-day HBPM protocol.
Supplemental Material
Download MS Word (603.1 KB)Acknowledgements
The authors gratefully acknowledge the contribution of Oscar van Dijk and Heleen Krabben for their support in compiling the dataset and data sharing procedure, and S. van den Oord for the data management.
Disclosure statement
RJM has received BP monitors for research from Omron and his institution receives fees from Omron and Sensyne for telemonitoring interventions. All other authors declare no conflicts of interest.
Data availability statement
The data that support the findings of this study are available from the corresponding author, WS, upon reasonable request.
Additional information
Funding
References
- Williams B, Mancia G, Spiering W, et al. ESC/ESH guidelines for the management of arterial hypertension. Eur Heart J. 2018;39(33):100–3104.
- Whelton PK, Carey RM, Aronow WS, et al. ACC/AHA/AAPA/ABC/ACPM/AGS/APhA/ASH/ASPC/NMA/PCNA guideline for the prevention, detection, evaluation, and management of high blood pressure in adults: a report of the American College of Cardiology/American Heart Association Task Force on Clinical P. J Am Coll Cardiol. 2017;71(19):e127–248.
- Parati G, Stergiou GS, Asmar R, et al. European society of hypertension guidelines for blood pressure monitoring at home: a summary report of the second international consensus conference on home blood pressure monitoring. J Hypertens. 2008;26(8):1505–1526.
- Kikuya M, Ohkubo T, Metoki H, et al. Day-by-day variability of blood pressure and heart rate at home as a novel predictor of prognosis: the ohasama study. Hypertension. 2008;52(6):1045–1050.
- Cramer JA. Microelectronic systems for monitoring and enhancing patient compliance with medication regimens. Drugs. 1995;49(3):321–327.
- McManus RJ, Little P, Stuart B, et al. Home and online management and evaluation of blood pressure (HOME BP) using a digital intervention in poorly controlled hypertension: randomised controlled trial. BMJ. 2021;372:m4858.
- Hodgkinson JA, Stevens R, Grant S, et al. Schedules for self-monitoring blood pressure: a systematic review. Am J Hypertens. 2019;32(4):350–364.
- Stergiou GS, Palatini P, Parati G, et al. 2021 European society of hypertension practice guidelines for office and out-of-office blood pressure measurement. J Hypertens. 2021;39(7):1293–1302.
- MedicineMen. EmmaHBPM [Internet]. [cited 2021. Sep 11]. Available from: https://medicinemen.eu/consument/producten/emmahbpm/.
- Stergiou GS, Giovas PP, Neofytou MS, et al. Validation of the microlife BPA100 plus device for self-home blood pressure measurement according to the international protocol. Blood Press Monit. 2006;11(3):157–160.
- Central commity on research involving Human subjects C. Legal framework for medical scientific research: Your research: Is it subject to the WMO or not? [Internet]. [cited 2021. Sep 11]. Available from: https://english.ccmo.nl/investigators/legal-framework-for-medical-scientific-research/your-research-is-it-subject-to-the-wmo-or-not.
- Wilton A, De Greef A, Shennan A. Rapid assessment of blood pressure in the obstetric day unit using microlife MaM technology. Hypertens Pregnancy. 2007;26(1):31–37.
- Pinheiro J, Bates D. Mixed-effects models in S and S-PLUS. New York (USA): Springer Science & Business Media; 2006.
- Pickering TG, Pieper C, Schechter CB. Ambulatory monitoring and blood pressure variability. London (GB): Science Press; 1991.
- Tong YL. The multivariate normal distribution. New York (USA): Springer Science & Business Media; 2012.
- Blood pressure lowering treatment trialists’ collaboration. Age-stratified and blood-pressure-stratified effects of blood-pressure-lowering pharmacotherapy for the prevention of cardiovascular disease and death: an individual participant-level data meta-analysis. Lancet. 2021;398(10305):1053–1064.
- Viera AJ, Garrett JM. Understanding interobserver agreement: the kappa statistic. Fam Med. 2005;37(5):360–363.
- McHugh ML. Interrater reliability: the kappa statistic. Biochem Med. 2012;22(3):276–282.
- Bello NA, Schwartz JE, Kronish IM, et al. Number of measurements needed to obtain a reliable estimate of home blood pressure: results from the improving the detection of hypertension study. J Am Heart Assoc. 2018;7(20):e008658.
- Grant S, Hodgkinson JA, Milner SL, et al. Patients' and clinicians' views on the optimum schedules for self-monitoring of blood pressure: a qualitative focus group and interview study. Br J Gen Pract. 2016;66(652):e819–e830.
- Stergiou GS, Skeva II, Zourbaki AS, et al. Self-monitoring of blood pressure at home: how many measurements are needed? J Hypertens. 1998;16(6):725–731.
- Stergiou GS, Nasothimiou EG, Kalogeropoulos PG, et al. The optimal home blood pressure monitoring schedule based on the Didima outcome study. J Hum Hypertens. 2010;24(3):158–164.
- Stergiou GS, Parati G. The optimal schedule for self-monitoring of blood pressure by patients at home. J Hypertens. 2007;25(10):1992–1997.
- Verberk WJ, Kroon AA, Kessels AGH, et al. The optimal scheme of self blood pressure measurement as determined from ambulatory blood pressure recordings. J Hypertens. 2006;24(8):1541–1548.
- Imai Y, Obara T, Ohkubo T. How many times should we ask subjects to measure blood pressure at home on each occasion? J Hypertens. 2007;25(10):1987–1991.
- Celis H, De Cort P, Fagard R, et al. For how many days should blood pressure be measured at home in older patients before steady levels are obtained? J Hum Hypertens. 1997;11(10):673–677.
- Stergiou GS, Skeva II, Baibas NM, et al. Diagnosis of hypertension using home or ambulatory blood pressure monitoring: comparison with the conventional strategy based on repeated clinic blood pressure measurements. J Hypertens. 2000;18(12):1745–1751.
- Niiranen TJ, Johansson JK, Reunanen A, et al. Optimal schedule for home blood pressure measurement based on prognostic data: the Finn-Home study. Hypertension. 2011;57(6):1081–1086.
- Di Monaco S, Rabbia F, Covella M, et al. Evaluation of a short home blood pressure measurement in an outpatient population of hypertensives. Clin Exp Hypertens. 2016;38(8):673–679.
- Johansson JK, Niiranen TJ, Puukka PJ, et al. Optimal schedule for home blood pressure monitoring based on a clinical approach. J Hypertens. 2010;28(2):259–264.
- Asayama K, Ohkubo T, Kikuya M, et al. Prediction of stroke by home “morning” versus “evening” blood pressure values: the ohasama study. Hypertens. 2006;48(4):737–743.
- Stergiou G, Parati G. Further insights into the 24-h blood pressure profile by home blood pressure monitoring: the issue of morning hypertension. J Hypertens. 2009;27(4):696–699.
- Fujiwara T, Hoshide S, Nishizawa M, et al. Difference in evening home blood pressure between before dinner and at bedtime in Japanese elderly hypertensive patients. J Clin Hypertens. 2017;19(7):731–739.
- Kawano Y, Pontes CS, Abe H, et al. Effects of alcohol consumption and restriction on home blood pressure in hypertensive patients: serial changes in the morning and evening records. Clin Exp Hypertens. 2002;24(1–2):33–39.
- Umemoto S, Ogihara T, Matsuzaki M, et al. Effects of calcium channel blocker-based combinations on intra-individual blood pressure variability: post hoc analysis of the COPE trial. Hypertens Res. 2016;39(1):46–53.
- Eguchi K, Imaizumi Y, Kaihara T, et al. Comparison of valsartan and amlodipine on ambulatory blood pressure variability in hypertensive patients. Clin Exp Hypertens. 2016;38(8):721–724.
- Microlife. MAM (Microlife Average Mode) [Internet]. [cited 2021. Dec 8]. Available from: https://www.microlife.com/technologies/blood-pressure/mam-technology.