
Abstract
Purpose
Chemical adherence testing is a reliable method to assess adherence to antihypertensive drugs. However, it is expensive and has limited availability in clinical practice. To reduce the number and costs of chemical adherence tests, we aimed to develop and validate a clinical screening tool to identify patients with a low probability of non-adherence in patients with uncontrolled hypertension.
Materials and Methods
In 495 patients with uncontrolled hypertension referred to the University Medical Centre Utrecht (UMCU), the Netherlands, a penalised logistic regression model including seven pre-specified easy-to-measure clinical variables was derived to estimate the probability of non-adherence. Non-adherence was defined as not detecting at least one of the prescribed antihypertensive drugs in plasma or urine. Model performance and test characteristics were evaluated in 240 patients with uncontrolled hypertension referred to the Heartlands Hospital, United Kingdom.
Results
Prevalence of non-adherence to antihypertensive drugs was 19% in the UMCU and 44% in the Heartlands Hospital population. After recalibration of the model’s intercept, predicted probabilities agreed well with observed frequencies. The c-statistic of the model was 0.63 (95%CI 0.53–0.72). Predicted probability cut-off values of 15%–22.5% prevented testing in 5%–15% of the patients, carrying sensitivities between 97% (64–100) and 90% (80–95), and negative predictive values between 74% (10–99) and 70% (50–85).
Conclusion
The combination of seven clinical variables is not sufficient to reliably discriminate adherent from non-adherent individuals to safely reduce the number of chemical adherence tests. This emphasises the complex nature of non-adherence behaviour and thus the need for objective chemical adherence tests in patients with uncontrolled hypertension.
Introduction
Hypertension globally affects 30–45% of the adult population and is an important treatable risk factor for cardiovascular disease (CVD) and mortality [Citation1,Citation2]. Although awareness and treatment have improved considerably, still approximately 50% of those receiving treatment for hypertension do not reach the blood pressure (BP) targets recommended by guidelines [Citation1]. Non-adherence to antihypertensive treatment is a major contributor to suboptimal BP control at the population level [Citation3,Citation4]. The estimated prevalence of non-adherence ranges from 16–53% in patients with uncontrolled BP to 10–86% in patients with resistant hypertension [Citation5]. Diagnosis of non-adherence is important as non-adherence is associated with a higher risk of acute cardiovascular events in the general hypertensive population [Citation3,Citation6,Citation7]. Moreover, early recognition of non-adherence might reduce the number of costly diagnostic tests and invasive device-based therapies [Citation8].
Several methods are available to assess adherence, but most are indirect, subjective and poorly reliable since they are shown to often overestimate adherence [Citation9]. As recommended by the 2018 European Society of Cardiology (ESC)/European Society of Hypertension (ESH) Guidelines, chemical drug screening by liquid chromatography tandem mass spectrometry (LC-MS/MS) in plasma or urine is one of the most reliable methods for medication adherence assessment [Citation10,Citation11]. However, due to the related costs and infrastructure, LC-MS/MS–based analysis is unlikely to become available in healthcare settings with limited (financial) resources where the prevalence of hypertension is higher, and the control of hypertension much lower [Citation1]. To reduce healthcare costs and make LC-MS/MS more accessible in these settings a clinical screening tool that creates the opportunity to carefully identify patients with a low probability of non-adherence, and therefore do not need to undergo further testing, would be desirable. However, the limited clinical screening tools developed so far were either based on pharmacy refill data [Citation12–14], did not specify model coefficients [Citation15], or were not externally validated [Citation12–14] making them futile in clinical practice. Therefore, the aim of this study was to develop and externally validate a screening tool, based on easy to collect clinical variables, to estimate the probability of non-adherence in patients with uncontrolled hypertension.
Methods
Study populations
For the development of the clinical screening tool, we used data from 495 consecutive patients with uncontrolled hypertension referred to the outpatient clinic of the Vascular Medicine department of the University Medical Centre Utrecht (UMCU) between November 2017 and November 2020. Patients were referred for diagnostic evaluation and/or treatment advice if BP targets were not met despite BP lowering treatment and/or suffered from target-organ damage. All patients underwent diagnostic evaluation according to a standardised protocol to identify underlying causes of hypertension. The details of this protocol have been described elsewhere [Citation16]. Patients who were prescribed at least one antihypertensive drug were included in this study. Patients in whom no biochemical drug screening was performed were excluded (n = 14): nine patients were evaluated in early November before the biochemical drug screening was fully implemented, two patients used candesartan which could not be analysed by the LC-MS/MS assay, and the results from three patients were missing for unknown reasons.
For external validation of the clinical screening tool, data from 240 patients who attended the hypertension clinic at Birmingham Heartlands Hospital in the United Kingdom (UK) between January 2015 and December 2018 were used. These patients were referred by their general practitioner or other medical specialists for the investigation and management of uncontrolled hypertension. Patients underwent biochemical drug screening in urine when either medication non-adherence was suspected by the treating hypertension specialist or when patients fulfilled the criteria for apparent resistant hypertension (in spite of concurrent use of three antihypertensive agents of different classes).
Since participants in this study were not subject to procedures and were not required to follow rules of behaviour outside the scope of routine clinical practice, no formal consent was required which was approved by the institutional ethics committees.
Definition of outcome
The outcome of interest was non-adherence to antihypertensive drugs. According to the guidelines for reporting on medication adherence, the EMERGE taxonomy, non-adherence can occur in three different phases of medication adherence: (1) initiation, (2) implementation, and (3) persistence [Citation17]. Since the study population concerns patients with uncontrolled hypertension who have been referred to a specialist centre in which the initiation phase has long passed, this study is mainly focussed on the implementation and persistence phase of adherence.
Non-adherence to antihypertensive drugs was assessed by chemical adherence testing which was performed in accordance with the recommendations in a recently published position paper on this method [Citation18]. For the UMCU population, chemical adherence testing was performed using an LC-MS/MS method which is able to detect 39 antihypertensive drugs (covering >95% of the European antihypertensive drug prescriptions) simultaneously [Citation18,Citation19] (see Supplemental Table S1). In the UK population, the LC-MS/MS method was able to measure urine concentrations of 24 commonly prescribed antihypertensive drugs (covering over 90% of the UK antihypertensive drug prescriptions) [Citation18,Citation20] (see Supplemental Table S1). For both study populations, all patients provided verbal consent for chemical adherence testing in blood or urine on the day of their clinical appointment. Patients were not informed in advance that drug testing would be performed at their clinical visit.
We considered the lower limit of detection (LOD), the lowest quantity of a drug that can be distinguished from the absence of that drug, as a cut-off for adherence. Based on this cut-off, patients were divided into two main categories: adherent (all of the prescribed medications detected) or non-adherent (at least one of the prescribed medications not detected). Non-adherence was further categorised into full non-adherence (complete absence of any prescribed antihypertensive medications in the blood or urine sample) and partial non-adherence (presence of fewer medications than prescribed in blood or urine sample). In case of fixed-dose combinations, we considered all separate drug components.
Clinical model parameters
The screening tool was built with the following pre-specified clinical variables: age, sex, body mass index (BMI, kg/m2), history of CVD (yes/no, defined according to the atherosclerotic cardiovascular disease (ASCVD) definition as proposed by the European Guidelines on Cardiovascular Disease Prevention [Citation21]), office systolic BP (SBP, mmHg), office heart rate (beats/min) and total number of antihypertensive drug tablets. Selection of these variables was based on previous studies that reported clinical screening tools for non-adherence and etiologic studies that investigated factors that were independently associated with non-adherence measured by LC-MS/MS. These studies were identified through a systematic literature search. See Supplementary Appendix A for further details on this search and the selection process. After identification of potentially suitable variables, a final selection of the variables was made based on availability in the dataset and clinical availability in the hospital setting as well as in general practice, which will facilitate future widespread use of the screening tool.
Missing data
For both the derivation and validation dataset, there was a considerable amount of missing data for the variables of interest, including systematically missing data for office heart rate in the validation set (). A complete case analysis excluding these patients would yield loss of efficiency and would provide biased results, since missing data rarely occur completely at random and are usually dependent on the outcome [Citation22]. Therefore, missing data were handled using 10-fold multilevel multiple imputation with fully conditional specification to take the uncertainty of imputed values into account (jomoImpute-algorithm in R, mitml package). The choice of 10 imputations was based on simulation studies that showed that there tends to be little or no practical benefit to using more than 10 imputations [Citation23]. The resulting 10 completed datasets were analysed separately and the results were combined using Rubin’s rules [Citation24,Citation25].
Table 1. Baseline characteristics of the derivation set and validation set.
Statistical analyses
The clinical screening tool was developed and validated using the Transparent Reporting of a Multivariable Prediction Model for Individual Prognosis or Diagnosis (TRIPOD) criteria [Citation26].
Model derivation
Model derivation was performed by multivariable logistic regression, including the seven pre-specified clinical variables as described above. No stepwise variable selection was performed as this would increase the risk of selecting spurious variables (overfitting) and an increased risk for failing to include important variables (underfitting) [Citation26]. Continuous variables were truncated to the 1st and 99th percentile to limit influence of outliers. Next, by comparing Akaike's Information Criterion (AIC), we tested whether logarithmic or quadratic transformations of continuous variables improved model fit [Citation27]. The final model coefficients were estimated using penalised estimation methods using an L2 quadratic (i.e. ‘ridge’) penalty to further prevent overfitting [Citation28,Citation29].
Model validation
Internal validity of the model was assessed with a calibration plot showing the agreement between the observed frequencies of non-adherence and the pooled probabilities of non-adherence of the 10 imputed datasets. Discrimination of the model was assessed by the ROC-curve and c-statistic that was obtained using bootstrapping with 1000 bootstrap samples.
External validity of the model was tested in the Heartlands Hospital population. To adjust for variation in the underlying prevalence of non-adherence, the intercept of the derived model was recalibrated such that the mean predicted probability equals the observed prevalence in the validation set [Citation30]. In addition to discrimination and calibration, test characteristics (sensitivity, specificity, positive and negative predictive value) for different cut-off values of the predicted probability were determined. These estimates and their standard errors were logit transformed, pooled by using Rubin’s rules, and then back transformed [Citation25]. The final model was presented after pooling the recalibrated intercepts and shrunken beta coefficients. All analyses were conducted with R statistical software version 4.0.3 (R Development Core Team, Vienna, Austria).
Results
Baseline characteristics and prevalence of non-adherence
In , the baseline characteristics based on the observed, non-imputed data of patients in the derivation and validation population are provided. In the derivation set, patients smoked less often and on average had a lower BMI and more often a history of CVD, compared to patients in the validation set. In the 495 UMCU patients with uncontrolled hypertension whose blood sample underwent LC-MS/MS analysis, the prevalence of non-adherence was 19% (fully non-adherent 4%, partially non-adherent 15%). The prevalence of non-adherence, determined based on LC-MS/MS in urine samples, among 240 patients recruited in the Heartlands Hospital was 44% (fully non-adherent 28%, partially non-adherent 15%). As Supplemental Table S2 illustrates, the percentage of fully adherent patients decreases as the number of prescribed antihypertensive drug classes increases.
Development and internal validation of the diagnostic model
shows the pooled model coefficients and corresponding odds ratios. Logarithmic or quadratic transformations of continuous predictors did not improve the model fit. The model formula that was used to estimate probabilities of non-adherence is shown in Supplemental Table S3. Internal validation showed good agreement between the predicted probabilities and observed frequencies of non-adherence (Supplemental Figure 1 A). The discriminative ability of the diagnostic tool in the development dataset was fair with a c-statistic of 0.73 (95% confidence interval (CI) 0.66 − 0.79) (Supplemental Figure 2 A).
Table 2. Model coefficients and odds ratios.
External validation of the diagnostic model
shows good agreement between predicted probabilities and observed frequencies of non-adherence after adjustment of the intercept (mean correction factor 0.394). This indicates that, after adjusting the mean predicted risk to the observed risk in the validation set, the clinical screening tool could be applied to populations with uncontrolled hypertension with different overall prevalence of non-adherence. Discriminative performance of the diagnostic model in the Heartlands Hospital population was poor with a c-statistic of 0.63 (95% CI 0.53 − 0.72) ().
Figure 1. External validation of the clinical screening tool for non-adherence. (A) Plot of external calibration of clinical screening tool in Heartlands Hospital population showing the agreement between predicted and observed probabilities of non-adherence after recalibration. (B) Receiver operating characteristics (ROC) curve showing the discriminative performance of the diagnostic tool.
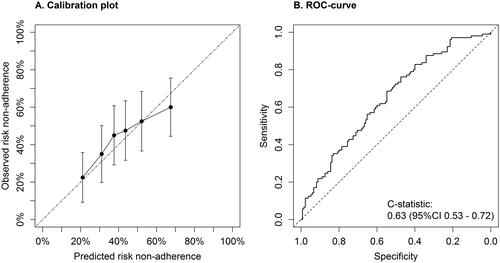
shows the test characteristics and proportion of patients spared testing for cut-off values of the predicted probability of non-adherence between 10 − 25%. This range was chosen because it showed the highest sensitivities and negative predictive values; characteristics that are desirable when the purpose of the diagnostic tool is to rule out non-adherence. The proportion of patients spared LC-MS/MS testing reflects the proportion of patients with a predicted probability equal or below the cut-off value in which (according to this screening tool) no further testing is needed. Predicted probability cut-off values of 15%–22.5% prevented testing in 5% (95% CI 2 − 8%) to 15% (95% CI 10 − 20%) of the patients with uncontrolled hypertension, carrying sensitivities between 97% (64 − 100) and 90% (80 − 95), and negative predictive values between 74% (10 − 99) and 70% (50 − 85) ().
Table 3. Test characteristics and proportion of patients spared chemical adherence testing.
Discussion
In this cross-sectional, diagnostic study, we report the development and external validation of a screening tool, based on seven objective and easy-to-collect clinical variables, for estimating non-adherence to antihypertensive drugs in patients with uncontrolled hypertension. Validation showed good agreement between model predictions and observed frequencies of non-adherence. However, the discriminative ability of the screening tool was insufficient to reliably distinguish between adherence and non-adherence in patients with uncontrolled hypertension.
This is one of the first studies describing the development and validation of a clinical screening tool for biochemically confirmed adherence to antihypertensive drugs. In 2017, Gupta et al. also developed and validated two diagnostic models for biochemically confirmed non-adherence in patients with suboptimal BP control [Citation15]. These models, based on a smaller set of model parameters compared to this study, showed somewhat higher c-statistics upon external validation (0.710 and 0.708). However, Gupta et al. used selected study populations, including patients referred for chemical adherence testing, for both the development and validation of the models. Therefore, their results cannot be generalised to all patients referred with uncontrolled hypertension. Moreover, the lack of reporting of their model coefficients makes it impossible to validate their model externally, let alone use it in clinical practice.
The poor discriminative power of our model in external validation can probably be explained by differences in patient selection between the derivation and validation population. Whereas for the development of the model, all consecutive patients visiting the outpatient clinic of the UMCU were systematically screened by LC-MS/MS, patients in the Heartlands Hospital population were only subjected to drug screening when either the clinician suspected therapy non-adherence or when patients fulfilled the criteria for apparent resistant hypertension. As the clinician's suspicion of non-adherence is likely based (in part) on clinical characteristics included in the diagnostic model, only patients with a high probability of non-adherence were referred for drug screening. This probably resulted in partial verification bias [Citation31] and underestimation of discriminative ability. For the screening tool to be clinically relevant and reliable, the use of an unselected population of patients with uncontrolled hypertension is essential for the development of the model, as this is the population in which the screening tool will ultimately be applied. Thus, further evaluation of the screening tool developed in the current study in unselected populations of patients with uncontrolled hypertension would be appropriate. Although this may result in a more reliable estimate of discriminative power of the tool, this measure will be at most 0.73 (c-statistic internal validation), indicating moderate discrimination [Citation32].
Another explanation for the inadequate discrimination of the diagnostic model described in this study could be the homogeneous clinical characteristics of the patients in the Heartlands Hospital population compared to the UMCU population. Consequently, these patients had fewer distinguishing factors for predicting higher or lower probabilities of non-adherence. Also, adherence in the derivation population was assessed by LC-MS/MS in plasma compared to urine in the validation population. There is evidence that LC-MS/MS in urine may be less accurate than in serum for a number of compounds [Citation33,Citation34], especially for the evaluation of substances with low bioavailability, low renal excretion or high metabolism rate, which probably led to misclassification of non-adherence and eventually the discriminative ability of the model.
To establish an easily applicable screening tool that can reliably select patients with a very low probability of non-adherence, who would consequently not need to be exposed to a costly chemical adherence test, the tool requires a high negative predictive value to prevent non-adherent patients from not being identified. However, the validated screening tool presented here had poor discrimination resulting in a negative predictive value of 74% at best. Such a negative predictive value means that in case of a negative test result of the screening tool there is still a 26% chance of non-adherence. These results are in line with findings from previous studies reporting on tools to predict non-adherence in patients with uncontrolled hypertension [Citation12,Citation13]. In summary, these results indicate that it is not possible to sufficiently accurately predict whether a patient will be adherent with antihypertensive treatment based on a combination of either clinical characteristics or self-reported barriers to medication adherence. This emphasises the need for direct and objective chemical adherence testing in routine clinical practice.
The current study had several strengths, including the identification of clinical model parameters through a systematic literature search and the use of penalised estimation methods, both reducing the risk of overfitting. Another strength of this study is that clinical variables were routinely collected, resembling daily clinical practice, which is essential in a diagnostic study. Also, in contrast to previous studies on diagnostic models for non-adherence in patients with uncontrolled hypertension, we were able to externally validate the developed screening instrument. External validation is required to guarantee generalisability and should be done before a diagnostic model can be applied in clinical practice [Citation26]. In our case, external validation revealed an insufficient discriminatory power of the model which would otherwise have stayed unnoticed and therefore emphasises the importance of external validation.
Limitations of the study should also be considered. The validation set had a relatively small sample size, which may have increased the risk of biased and imprecise estimates of model performance. Previous simulation studies indicated that validation studies need at least 100 events to provide reliable results [Citation35,Citation36]. Although our study meets this condition (105 events), external validation in larger datasets would be preferable. Another limitation is that some of the clinical variables in the validation set contained a considerable amount of missing values, including systematically missing data on the clinical variable heart rate. However, we applied multilevel multiple imputation to handle these missing data and thereby reduced the risk of bias and improved efficiency for the analysis [Citation37]. Furthermore, data on number of comorbidities, socio-economic status, and experience of side effects from antihypertensive drugs, which have previously been described as being associated with non-adherence [Citation38] and thus could improve model performance, were not available in both datasets. Lastly, we acknowledge that, despite being an objective and direct method, there are limitations to the use of LC-MS/MS to diagnose adherence to antihypertensive drugs. For example, due to the long half-life of several antihypertensive drugs (e.g. amlodipine; half-life 30–50 h [Citation39]) these drugs would remain detectable in the patient's plasma or urine long after the last ingestion. This means that intermittent non-adherence could have been missed. Moreover, patients that only take their medications before visiting the doctor’s office (‘white-coat adherence’) [Citation37] are likely to be classified as biochemically adherent despite being non-persistent. Also, the LC-MS/MS methods used for this study, particularly the one used for the Heartlands Hospital population, could only measure a limited number of antihypertensive drugs. Although this assay still covers the majority of routinely prescribed antihypertensive drugs [Citation40], this may have resulted in an underestimation of non-adherence to antihypertensive drugs.
In conclusion, the combination of seven easy-to-measure clinical variables is not sufficient to discriminate adherent from non-adherent individuals with uncontrolled hypertension to safely reduce the number of biochemical adherence tests. This emphasises the complex nature of non-adherence behaviour, which cannot simply be captured by a few clinical characteristics, and thus the need for objective chemical drug tests in patients with uncontrolled hypertension.
Supplemental Material
Download ()Acknowledgements
The authors gratefully acknowledge the contribution of C. Flint and J. Wierdsma for their support in the diagnostic work-up of patients with difficult-to-control hypertension in our clinic, A. Punt for the bioanalytical work and Dr. W. Pasma for the data management.
Disclosure statement
No potential conflict of interest was reported by the author(s).
Data availability statement
The data that support the findings of this study are available from the corresponding author, WS, upon reasonable request.
References
- Mills KT, Bundy JD, Kelly TN, et al. Global disparities of hypertension prevalence and control: a systematic analysis of population-based studies from 90 countries. Circulation. 2016;134(6):441–450.
- Lozano R, Naghavi M, Foreman K, et al. Global and regional mortality from 235 causes of death for 20 age groups in 1990 and 2010: a systematic analysis for the global burden of disease study 2010. Lancet (London, England. 2012;380(9859):2095–2128.
- Mazzaglia G, Ambrosioni E, Alacqua M, et al. Adherence to antihypertensive medications and cardiovascular morbidity among newly diagnosed hypertensive patients. Circulation. 2009;120(16):1598–1605.
- Sokol MC, McGuigan KA, Verbrugge RR, et al. Impact of medication adherence on hospitalization risk and healthcare cost. Med Care. 2005;43(6):521–530.
- Hamdidouche I, Jullien V, Boutouyrie P, et al. Drug adherence in hypertension: from methodological issues to cardiovascular outcomes. J Hypertens. 2017;35(6):1133–1144.
- Corrao G, Parodi A, Nicotra F, et al. Better compliance to antihypertensive medications reduces cardiovascular risk. J Hypertens. 2011;29(3):610–618.
- Lee H, Yano Y, Cho SMJ, et al. Adherence to antihypertensive medication and incident cardiovascular events in young adults with hypertension. Hypertension. 2021;77(4):1341–1349.
- Berra E, Azizi M, Capron A, et al. Evaluation of adherence should become an integral part of assessment of patients with apparently treatment-resistant hypertension. Hypertension. 2016;68(2):297–306.
- Pandey A, Raza F, Velasco A, et al. Comparison of morisky medication adherence scale with therapeutic drug monitoring in apparent treatment-resistant hypertension. J Am Soc Hypertens. 2015;9(6):420–426.e2.
- Lam WY, Fresco P. Medication adherence measures: An overview. Biomed Res Int. 2015;2015(217047):217047.
- Williams B, Mancia G, Spiering W, ESC Scientific Document Group, et al. 2018 ESC/ESH guidelines for the management of arterial hypertension. Eur Heart J. 2018;39(33):3021–3104.
- Krousel-Wood M, Joyce C, Holt EW, et al. Development and evaluation of a self-report tool to predict low pharmacy refill adherence in elderly patients with uncontrolled hypertension. Pharmacotherapy. 2013;33(8):798–811.
- Steiner JF, Ho PM, Beaty BL, et al. Sociodemographic and clinical characteristics are not clinically useful predictors of refill adherence in patients with hypertension. Circ Cardiovasc Qual Outcomes. 2009;2(5):451–457.
- Gao W, Liu H, Ge C, et al. A clinical prediction model of medication adherence in hypertensive patients in a Chinese community hospital in Beijing. Am J Hypertens. 2020;33(11):1038–1046
- Gupta P, Patel P, Strauch B, et al. Risk factors for nonadherence to antihypertensive treatment. Hypertens (Dallas, Tex 1979). 2017;69(6):1113–1120.
- Van Der Sande NGC, Blankestijn PJ, Visseren FLJ, et al. Prevalence of potential modifiable factors of hypertension in patients with difficult-to-control hypertension. J Hypertens. 2019;37(2):398–405.
- De Geest S, Zullig LL, Dunbar-Jacob J, et al. ESPACOMP medication adherence reporting guideline (EMERGE). Ann Intern Med. 2018;169(1):30–35.
- Lane D, Lawson A, Burns A, et al. Nonadherence in hypertension: How to develop and implement chemical adherence testing. Hypertens (Dallas, Tex 1979). 2021;79(1):12–23.
- Punt AM, Stienstra NA, van Kleef MEA, et al. Screening of cardiovascular agents in plasma with LC-MS/MS: a valuable tool for objective drug adherence assessment. J chromatogr B. Anal Technol Biomed Life Sci. 2019;1121:103–110.
- Lawson AJ, Shipman KE, George S, et al. A novel “dilute-and-Shoot” liquid chromatography-tandem mass spectrometry method for the screening of antihypertensive drugs in urine. J Anal Toxicol. 2016;40(1):17–27.
- Piepoli MF, Hoes AW, Agewall S, ESC Scientific Document Group, et al. 2016 European guidelines on cardiovascular disease prevention in clinical practice: the sixth joint task force of the European society of cardiology and other societies on cardiovascular disease prevention in clinical practice (constituted by representat. Eur Heart J. 2016;37(29):2315–2381.
- Donders ART, van der Heijden GJMG, Stijnen T, et al. Review: a gentle introduction to imputation of missing values. J Clin Epidemiol. 2006;59(10):1087–1091.
- Schafer JL. Multiple imputation: a primer. Stat Methods Med Res. 1999; Mar8(1):3–15.
- Rubin DB. Multiple imputation for survey nonresponse. New York: Wiley; 1987.
- Wood AM, Royston P, White IR. The estimation and use of predictions for the assessment of model performance using large samples with multiply imputed data. Biom J. 2015; Jul57(4):614–632.
- Moons KGM, Altman DG, Reitsma JB, et al. Transparent reporting of a multivariable prediction model for individual prognosis or diagnosis (TRIPOD): explanation and elaboration. Ann Intern Med. 2015;162(1):W1–73.
- Steyerberg EW. Clinical prediction models. New York, NY: Springer; 2019.
- Steyerberg EW, Eijkemans MJ, Harrell FEJ, et al. Prognostic modelling with logistic regression analysis: a comparison of selection and estimation methods in small data sets. Statist Med. 2000;19(8):1059–1079.
- Pavlou M, Ambler G, Seaman SR, et al. How to develop a more accurate risk prediction model when there are few events. BMJ. 2015;351:h3868.
- Janssen KJM, Moons KGM, Kalkman CJ, et al. Updating methods improved the performance of a clinical prediction model in new patients. J Clin Epidemiol. 2008;61(1):76–86.
- Whiting PF, Rutjes AWS, Westwood ME, QUADAS-2 Steering Group, et al. A systematic review classifies sources of bias and variation in diagnostic test accuracy studies. J Clin Epidemiol. 2013;66(10):1093–1104.
- Alba AC, Agoritsas T, Walsh M, et al. Discrimination and calibration of clinical prediction models: Users’ guides to the medical literature. JAMA. 2017;318(14):1377–1384.
- Ritscher S, Georges C, Wunder C, et al. Assessment of adherence to diuretics and β-blockers by serum drug monitoring in comparison to urine analysis. Blood Press. 2020;29(5):291–298
- Ritscher S, Hoyer M, Georges C, et al. Benefit of serum drug monitoring complementing urine analysis to assess adherence to antihypertensive drugs in first-line therapy. PLoS One. 2020;15(8):e0237383.
- Vergouwe Y, Steyerberg EW, Eijkemans MJC, et al. Substantial effective sample sizes were required for external validation studies of predictive logistic regression models. J Clin Epidemiol. 2005;58(5):475–483.
- Collins GS, Ogundimu EO, Altman DG. Sample size considerations for the external validation of a multivariable prognostic model: a resampling study. Stat Med. 2016; 35(2):214–226.
- White IR, Carlin JB. Bias and efficiency of multiple imputation compared with complete-case analysis for missing covariate values. Stat Med. 2010;29(28):2920–2931.
- van der Laan DM, Elders PJM, Boons CCLM, et al. Factors associated with antihypertensive medication non-adherence: a systematic review. J Hum Hypertens. 2017;31(11):687–694.
- Meredith PA, Elliott HL. Clinical pharmacokinetics of amlodipine. Clin Pharmacokinet. 1992; 22(1):22–31.
- NHS digital. Prescription Cost Analysis - England, 2018. [PAS] [Internet]. NHS. 2018 [cited 2021 Aug 31]. Available from: https://digital.nhs.uk/data-and-information/publications/statistical/prescription-cost-analysis/2018.