
Abstract
Purpose
Obesity is a clear risk factor for hypertension. Blood pressure (BP) measurement in obese patients may be biased by cuff size and upper arm shape which may affect the accuracy of measurements. This study aimed to assess the accuracy of the OptiBP smartphone application for three different body mass index (BMI) categories (normal, overweight and obese).
Materials and methods
Participants with a wide range of BP and BMI were recruited at Lausanne University Hospital’s hypertension clinic in Switzerland. OptiBP estimated BP by recording an optical signal reflecting light from the participants’ fingertips into a smartphone camera. Age, sex and BP distribution were collected to fulfil the AAMI/ESH/ISO universal standards. Both auscultatory BP references and OptiBP BP were measured and compared using the simultaneous opposite arms method, as described in the 81060-2:2018 ISO norm. Subgroup analyses were performed for each BMI category.
Results
We analyzed 414 recordings from 95 patients: 34 were overweight and 15 were obese. The OptiBP application had a performance acceptance rate of 82%. The mean and standard deviation (SD) differences between the optical BP estimations and the auscultatory reference rates (criterion 1) were respected in all subgroups: SBP mean value was 2.08 (SD 7.58); 1.32 (6.44); −2.29 (5.62) respectively in obese, overweight and normal weight subgroup. For criterion 2, which investigates the precision errors on an individual level, the threshold for systolic BP in the obese group was slightly above the requirement for this criterion.
Conclusion
This study demonstrated that the OptiBP application is easily applicable to overweight and obese participants. Differences between the reference measure and the OptiBP estimation were within ISO limits (criterion 1). In obese participants, the SD of mean error was outside criterion 2 limits. Whether auscultatory measurement, due to arm morphology or the OptiBP is associated with increasing bias in obese still needs to be studied.
PLAIN LANGUAGE SUMMARY
What is the context?
• Hypertension and obesity have a major impact on population health and costs.
• Obesity is a chronic disease characterized by abnormal or excessive fat accumulation.
• Obesity, in combination with other diseases like hypertension, is a major risk factor for cardiovascular and total death.
• In Europe, the obesity rate is 21.5% for men and 24.5% for women.
• Hypertension, which continues to increase in the population, is a factor that can be modified when well managed.
• Blood pressure measurement by the usual method may be complicated in obese patients due to fat accumulation and the shape of the arm and can lead to measurement errors. In addition, the non-invasive blood pressure measurement can be constraining and uncomfortable.
What is new?
• Smartphone apps are gradually appearing and allow the measurement of blood pressure without a pressure cuff using photoplethysmography.
• OptiBP is a smartphone application that provides an estimate of blood pressure that has been evaluated in the general population.
• The objective of this study is to assess whether OptiBP is equally effective in obese and overweight patients.
What is the impact?
• The use of smartphones to estimate BP in overweight and obese patients may be a solution to the known bias associated with cuff measurement.
• The acquisition of more and more data with a larger number of patients will allow the continuous improvement of the application’s algorithm.
Introduction
High blood pressure and obesity’s effects on health and impacts on costs make them public health priorities [Citation1–3]. Obesity is a major risk for mortality [Citation4] and is associated with co-morbidities including hypertension, type 2 diabetes mellitus, dyslipidemia and major cardiovascular diseases [Citation5]. The associations between being overweight or obese and hypertension are known to be as high as 65–75% [Citation6,Citation7]. Although initially identified as a problem related to developed countries, reports now demonstrate obesity’s dramatic rise in low- and middle-income countries [Citation8].
Auscultatory and automated oscillometric sphygmomanometers are the current reference techniques for blood pressure (BP) measurement, but this is challenging in obese populations [Citation9]. The optimal cuff and bladder characteristics for traditional BP measurement using a sphygmomanometer are still debated, and a global consensus about their appropriate sizes in relation to a patient’s arm is still lacking [Citation7]. Indeed, the American Heart Association (AHA) and the British Hypertension Society have made different recommendations concerning cuff and bladder sizes [Citation10,Citation11]. The former recommends using different cuffs according to arm circumference, and the latter recommends the same width for all arms but with adaptations of the length of the bladder according to the arm size. Furthermore, the frequently tronco-conical shape of obese subjects’ upper arms can cause measurement errors, which increase linearly with the increasing circumference of the arm [Citation12]. Rectangular cuffs have difficulty fitting on tronco-conical arms, and this can lead to inaccurate measurements [Citation13]. Furthermore, measurements with cuffs can be inconvenient and cause discomfort. We should mention the European Society of Hypertension (ESH) working group’s position paper recommending a tronco-conical cuff for arm circumferences greater than 42 cm, and that wrist or forearm measurement can be used in clinical practice for individuals with short upper arms [Citation14].
Cuffless approaches using smartphone-based medical applications have recently emerged as promising new technologies to detect and monitor hypertension [Citation15–19]. The mobile phone is a very promising tool, as it is accessible to a wide range of the population in both industrialised and developing countries. As described above, the difficulties of measuring blood pressure in obese and overweight patients could be circumvented and resolved, if the technology can ensure the reliability of the measurement in these patients. The OptiBP smartphone app is a pulse wave analysis-based BP estimation technique applied using the photoplethysmogram signals acquired via a dedicated application (OptiBP) on a smartphone. An initial study of 50 patients assessed the performance of this technique and a second general population study involving 100 participants used a standardized protocol to demonstrate the OptiBP smartphone application’s accuracy according to the AAMI/ESH/ISO universal standards (ISO 81060-2:2018) for estimating BP [Citation15,Citation16]. Whether BMI categories would affect the accuracy of the OptiBP has not been analyzed yet. The present study aimed to assess and compare the performance of the OptiBP smartphone application in subgroups of overweight and obese subjects.
Material and methods
Participants were recruited from Lausanne University Hospital’s hypertension clinic in Switzerland and from the University of Lausanne as previously described [Citation16]. The study was authorized by the Human Research Ethics Committee of the Canton of Vaud (Switzerland, CER-VD no. 2018-01656) and registered under number NCT03875248 at www.clinicaltrials.gov on March 14, 2019. Written informed consent was obtained from all the patients enrolled, and the protocol was conducted in accordance with the Declaration of Helsinki.
Hypertension was defined as systolic blood pressure (SBP) over 140 mmHg and diastolic blood pressure (DBP) over 90 mmHg, based on the 2018 European guidelines for the management of arterial hypertension [Citation20]. Obesity was defined as a BMI greater than or equal to 30 kg/m.2 Being overweight was defined as a BMI greater than or equal to 25 kg/m2 but less than 30 kg/m2 [Citation8]. We carefully analyzed the results of these subgroups of overweight and obese patients according to these definitions.
Device description
Light emitted by a Samsung Galaxy S7 smartphone (Samsung GEC, 26, Sangil-ro 6-gil, Gagdong-gu, Seoul, Korea) was passed through each patient’s fingertip, reflecting differently off the tissues as the volume of blood flow changed there. The light passing back to the smartphone camera’s image sensor generated images that were processed by the OptiBP application to calculate BP. The methodology of optical signal acquisition and its initial processing have been published elsewhere recently [Citation15].
OptiBP considered any two consecutive measurements, taken within a two-minute interval, and with differences of >20 mmHg and >10 mmHg of SBP and DBP, respectively, as outliers and excluded them from the analysis.
Reference BP
Two blinded, independent, experienced observers listened to patients’ Korotkoff sounds through a dual-head (Y-tube) stethoscope, while they used a validated sphygmomanometer to take simultaneous reference auscultatory BP measurements (A&D UM-101, A&D Company, Ltd., Toshima Ku, Tokyo, Japan). These reference BPs were measured on one side, while simultaneously on the opposite arm, BPs were recorded with the OptiBP application, in accordance with the 81060-2:2018 ISO norm, as described previously and corresponding to an immediate post-qualibration test [Citation16]. The size of the reference cuff was adapted to the circumference of the subject’s mid-arm using two sizes of inflatable bladders: 14 × 25 cm and 16 × 32 cm. Bladder size was determined so that the length corresponded to 75–100% of the subject’s mid-arm circumference and the width corresponded to 37–50%, according to the AAMI/ESH/ISO universal standard (ISO 81060-2:2018). Our study protocol used this standard with minor adjustments due to the cuffless approach.
The statistical analyses were also conducted following the AAMI/ESH/ISO universal standard (ISO 81060-2:2018) criteria. For criterion 1, the mean and standard deviation differences between the optical BP estimations and the auscultatory reference rates were calculated. For criterion 2, the standard deviations of the mean differences between the optical estimations and the auscultatory references within each subject were calculated.
As suggested in the Consensus Document for blood pressure monitor validation by Stergiou and al [Citation21]., we also report absolute values and Bland-Altman. The absolute error is the BP measurement by optiBP minus the BP measurement by the reference device, therefore error = optiBP measurement − reference measurement. The proportion of absolute error is the proportion of the calculated error where this error is smaller than 5, respectively 10 or 15 mmHg ().
Table 1. Proportion of absolute errors estimation for SBP and DBP (mmHg) for each subgroup: |BPref – BPoptiBP|.
Results
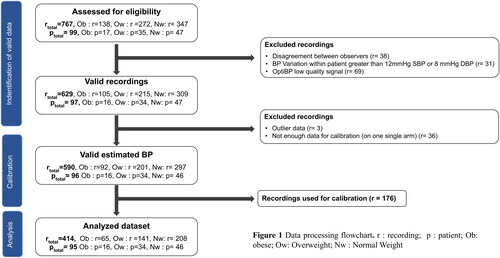
One hundred patients were recruited, but one was excluded due to inaudible auscultatory BP measurement (inaudible Korotkoff sounds), leaving 99 eligible patients and 767 recordings. Of these reference measurements, 38 recordings were excluded because the observers’ measurements disagreed by more than 4 mmHg, and 31 were excluded because of BP variations in the same patient greater than 12 mmHg for SBP or 8 mmHg for DBP. Among the recordings acquired using the OptiBP application, 69 were excluded because of bad signal quality during recording (due to shivering, tremors, or bad perfusion). Three measurements were considered outliers and excluded. One hundred and seventy-six recordings were used for calibration, and a total of 414 measurements were therefore analyzable ().
Figure 1. Data processing flowchart. r: recording; p: patient; Ob: obese; Ow: overweight; Nw: normal weight.
Of 95 patients, 34 were overweight, 15 were obese and 46 were of normal weight (). Two patients were defined as normal weight, although their BMIs below 18 kg/m2 would be classified as underweight by WHO standards. Criterion 1, for SBP and DBP, was respected for all subgroups (), although the threshold for SBP in the obese group was slightly above the requirement of the AAMI/ESH/ISO universal standard (ISO 81060-2:2018) for criterion 2 (), especially for the standard deviation of the average error.
Table 2. Patients demographic info of the analysed dataset.
Table 3. ISO81060-2 criterion 1 performance.
Table 4. ISO81060-2 criterion 2 performance.
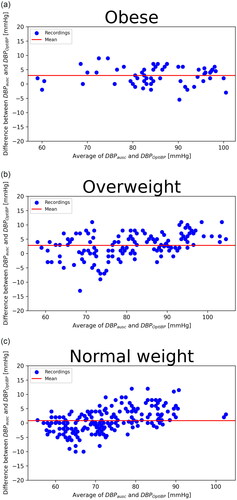
Standardized Bland–Altman scatterplots of the OptiBPTM–reference BP differences against their average values are shown in and . We observed a greater dispersion of results in the obese group and for high blood pressure; differences between the OptiBP and reference findings were greater for high blood pressure.
Figure 2. Systolic BP. Standardised Bland–Altman scatterplots of the OptiBP-reference Bp differences against their average (SBP: systolic blood pressure; DBP: diastolic blood pressure). (a) Obese; (b) Overweight; (c) Normal weight.
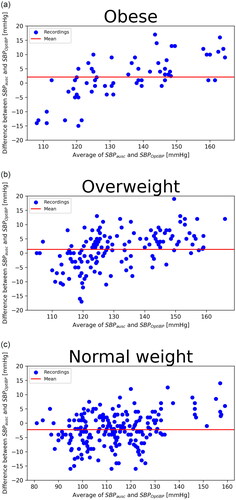
Figure 3. Diastolic BP. Standardised Bland–Altman scatterplots of the OptiBP-reference Bp differences against their average (SBP: systolic blood pressure; DBP: diastolic blood pressure). (a) Obese; (b) Overweight; (c) Normal weight.
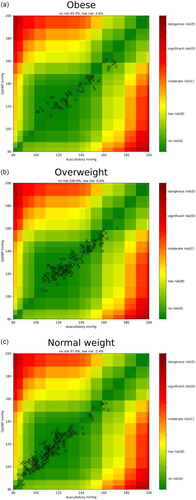
We performed an error grid analysis comparing the OptiBP application’s BP measurements and the reference method’s measurements for systolic arterial pressure. This showed that 100% of the overweight group had no risk of a potential treatment error due to a measurement difference using OptiBP. Among the obese group, 95.4% of measurements using OptiBP showed no risk of a potential treatment error and 4.6% had a low risk ().
Figure 4. Error Grid for systolic arterial pressure. (a) Obese; (b) Overweight; (c) Normal weight.
There was no correlation between the error and arm size for the SBP (r(413) = 0.04; p = 0.46); however, there was a positive correlation between the DBP and arm size (r(413) = 0.14; p < 0.01).
Discussion
This study demonstrated that the performance of the OptiBP smartphone application has a high acceptance rate and that the mean difference and its standard deviation are within the limits of ISO 81060-2:2018 criteria 1 in a population subgroup of overweight subjects. The standard deviation of the mean error (criterion 2) was slightly above the recommendation.
Our population sample contained 48.4% normal weight, 35.7% overweight and 15.7% obese patients. This was significantly below the 52.7% of overweight people in Europe, and the 21.5% of males and 24.5% of females who are obese; it is well below the 42.4% prevalence of obesity in the United States. The inclusion of two underweight patients in the normal-weight population did not change the precision of the results. Using same-day calibration, validation criterion 1 was fulfilled for SBP and DBP. For validation criterion 2, the standard deviation of the average error per patient for SBP of the obese patient subgroup was slightly above the requirement of the AAMI/ESH/ISO universal standard. We attributed this to the small sample of only 15 obese patients. Indeed, four obese patients had measurements with a significantly greater BP error estimation than the other patients in the same sample. Their data might have been sufficient to impact the overall result of such a small group. Among these four obese patients, three had a BMI over 35 kg/m,2 whereas, among the other 11 patients, only one did (i.e. 44 kg/m2). We further investigated whether differences in upper-arm circumference could raise questions about the bladder’s precision in certain circumstances: there were no differences in upper-arm circumferences. However, we observed a positive correlation between the errors in DBP and large arm size, confirming the difficulties in precisely measuring BP in obese patients [Citation13]. All the patients in each subgroup underwent about four BP recordings, making the average error per patient more comparable.
B. Saugel et al. [Citation22] suggested that BP measurement differences were of different clinical relevance according to the absolute level of BP. Ideally, when introducing a new BP measurement device, statistical tests should reflect this. Those authors proposed error grid analysis for studies comparing BP measurement methods because that analysis can illustrate the differences in the clinical relevance of BP measurement between a new test method and a reference method. The error grid analysis analyzed the clinical risks of using our new BP measurement device and gave a satisfactory appraisal of our results. Nevertheless, even on standardized Bland–Altman scatterplots, we could observe a tendency for the application to slightly overestimate higher BP and underestimate lower BP in overweight and obese patients. With the assumption that cuff measurement is devoid of bias in obese participants, this can, of course, go towards further adaptations and improvements of the OptiBP application and its algorithms, as these estimations could have clinical significance in decisions to initiate or modify treatment.
However the accuracy of cuffless device BP measurement remains debatable for various reasons, as described by Mukkamala et al.: the lack of a validated protocol for the cuffless device, the difficulty to obtain the inter- and intra-individual BP variations and the influence of the demographics variables on the mathematical model used [Citation23]. Consequently, the use of new BP modalities in clinical practice remains challenging due to the absence of standardized validated protocols. Smartphone-based solutions have been shown to be useful and effective in contexts involving diagnosing, treating and monitoring chronic diseases. Using new information and communication technologies (ICTs) to improve patient management defines the rise of e-health in recent years. ICTs contribute to measuring parameters scientifically but also to changing behaviours [Citation24]. They are key tools in the management of hypertensive patients, improving diagnosis and follow-up and detecting early uncontrolled hypertension which could later lead to cardiac decompensation [Citation25]. Furthermore, ICTs can increase patient autonomy and satisfaction, hence we could observe better adherence to treatment and increased BP control. Follow-up studies explored the potential of additional parameters or other target groups of patients [Citation26–28].
Using smartphones as tools to follow BP makes clinical follow-up accessible to the large part of the population that owns one, at every layer of society, including in low- and middle-income countries. However, numerous applications and wireless solutions lack validation studies. Our OptiBP smartphone application was initially validated for BP measurements against reference auscultatory measurements [Citation15], and a second study demonstrated its accuracy at estimating BP values in a general population [Citation16], with a very good performance acceptance rate.
The present study demonstrated the clinically adequate performance of the OptiBP smartphone application in small population subgroups of overweight and obese patients. All these results were preliminary data, and they will require a further study with a bigger sample of obese patients for validation. Multiple ongoing studies will enable the acquisition of more and more data, and continuous improvements in data analysis will result from the constant evolution of artificial intelligence and machine learning. Every step in the algorithm can therefore be improved [Citation29,Citation30].
Limitations
Our study had some limitations. When our protocol was written, in 2018, the AAMI/ESH/ISO universal standard seemed to be the most appropriate. We know that the IEEE Standard for Wearable Cuffless Blood Pressure Measuring Devices was updated in 2019. Knowing that these new recommendations are not yet unanimously accepted, we used the ISO standards validation plan as best we could. A new ISO protocol is in preparation, but a consensus is struggling to emerge. However, the intended use of the OptiBP APP is similar to that of the traditional oscillometric device (standard sitting position). We know that within-subject variability over time requires more studies to ensure future development progress. We think however that the actual protocol is fitted to the research question, which was whether BMI would affect the accuracy of the BP estimation. Nonetheless, in order to minimize the measurement margin errors in obese and overweight patients, cuff and cuffless BP measures should be compared to invasive BP measurements. This strategy has recently been evaluated in intensive care patients by Desebbe et al. and revealed satisfying results [Citation31].
Other limitations included our small samples of overweight and obese patients, the lack of existing norms for cuffless BP measurement devices, error values for gold standard BP measurement devices (cuff and obese), and our non-representative sample of the population.
According to our preliminary data, the OptiBP smartphone application has shown its accuracy in a general population sample and among obese patients. In our initial study, we used same-day calibration. Our next step will be to demonstrate the OptiBP application’s constant accuracy over time. Further studies are currently underway.
Disclosure statement
Patrick Schoettker is an advisor to Biospectal SA. Martin Proença and Guillaume Bonnier work for CSEM, the owner of the optical blood pressure monitoring technology and assignee of the related patent application (WO2016138965A1), of which Martin Proença and Mathieu Lemay are the inventors. Mary Caillat, Jean Degott, Arlene Wuerzner, Virginie Durgnat, Michel Burnier and Gregoire Wuerzner have no competing interests. Chloé Stoll, Urvan Christen and Jean-François Knebel work for Biospectal SA. Innosuisse, the Swiss Innovation Agency, via Project no. 32688.1 IP-ICT, had no role in study design, data collection, data analysis, writing the report, or the decision to submit the paper for publication. No potential conflict of interest was reported by the author(s).
Data availability statement
The authors confirm that the data supporting the findings of this study are available within the article and its supplementary materials.
References
- Tremmel M, Gerdtham UG, Nilsson PM, et al. Economic burden of obesity: a systematic literature review. Int J Environ Res Public Health. 2017;14(4):435.
- Harvard T.H. Chan School of Public Health. Economic costs. Boston (MA): Harvard T.H. Chan School of Public Health; 2018. Available from: https://www.hsph.harvard.edu/obesity-prevention-source/obesity-consequences/economic/.
- Chu DT, Minh Nguyet NT, Dinh TC, et al. An update on physical health and economic consequences of overweight and obesity. Diabetes Metab Syndr. 2018;12(6):1095–1100.
- Bhaskaran K, Dos-Santos-Silva I, Leon DA, et al. Association of BMI with overall and cause-specific mortality: a population-based cohort study of 3.6 million adults in the UK. Lancet Diabetes Endocrinol. 2018;6(12):944–953.
- Yumuk V, Tsigos C, Fried M, et al. European guidelines for obesity management in adults. Obes Facts. 2015;8(6):402–424.
- Hall JE, do Carmo JM, da Silva AA, et al. Obesity-induced hypertension: interaction of neurohumoral and renal mechanisms. Circ Res. 2015;116(6):991–1006.
- Leblanc ME, Auclair A, Leclerc J, et al. Blood pressure measurement in severely obese patients: validation of the forearm approach in different arm positions. Am J Hypertens. 2019;32(2):175–185.
- World Health Organization. Obesity. Genava (Switzerland): WHO; 2021. Available from: https://www.who.int/health-topics/obesity#tab=tab_1.
- Joosten A, Rinehart J, Cannesson M. Blood pressure monitoring in obese patients: what is the size of the problem? Anesth Analg. 2019;128(3):391–392.
- Pickering TG, Hall JE, Appel LJ, et al. Recommendations for blood pressure measurement in humans and experimental animals: part 1: blood pressure measurement in humans: a statement for professionals from the Subcommittee of Professional and Public Education of the American Heart Association Council on High Blood Pressure Research. Hypertension. 2005;45(1):142–161.
- Williams B, Poulter NR, Brown MJ, et al. Guidelines for management of hypertension: report of the Fourth Working Party of the British Hypertension Society, 2004-BHS IV. J Hum Hypertens. 2004;18(3):139–185.
- Palatini P. Blood pressure measurement in the obese: still a challenging problem; 2018. Available from: https://www.escardio.org/Journals/E-Journal-of-Cardiology-Practice/Volume-16/Blood-pressure-measurement-in-the-obese-still-a-challenging-problem.
- Palatini P, Benetti E, Fania C, et al. Effect of the shape of the cuff on blood pressure measurement in people with large arms. Blood Press. 2020;29(4):241–246.
- Palatini P, Asmar R, O’Brien E, et al. Recommendations for blood pressure measurement in large arms in research and clinical practice: position paper of the European Society of Hypertension Working Group on Blood Pressure Monitoring and Cardiovascular Variability. J Hypertens. 2020;38(7):1244–1250.
- Schoettker P, Degott J, Hofmann G, et al. Blood pressure measurements with the OptiBP smartphone app validated against reference auscultatory measurements. Sci Rep. 2020;10(1):17827.
- Degott J, Ghajarzadeh-Wurzner A, Hofmann G, et al. Smartphone based blood pressure measurement: accuracy of the OptiBP mobile application according to the AAMI/ESH/ISO universal validation protocol. Blood Press Monit. 2021;26(6):441–448.
- Ghamri Y, Proenca M, Hofmann G, et al. Automated pulse oximeter waveform analysis to track changes in blood pressure during anesthesia induction: a proof-of-concept study. Anesth Analg. 2020;130(5):1222–1233.
- Michard F. A sneak peek into digital innovations and wearable sensors for cardiac monitoring. J Clin Monit Comput. 2017;31(2):253–259.
- Fortin J, Rogge DE, Fellner C, et al. A novel art of continuous noninvasive blood pressure measurement. Nat Commun. 2021;12(1):1387.
- Williams B, Mancia G, Spiering W, et al. 2018 ESC/ESH guidelines for the management of arterial hypertension: the Task Force for the Management of Arterial Hypertension of the European Society of Cardiology (ESC) and the European Society of Hypertension (ESH). Eur Heart J. 2018;39(33):3021–3104.
- Stergiou GS, Alpert B, Mieke S, et al. A universal standard for the validation of blood pressure measuring devices: Association for the Advancement of Medical Instrumentation/European Society of Hypertension/International Organization for Standardization (AAMI/ESH/ISO) collaboration statement. J Hypertens. 2018;36(3):472–478.
- Saugel B, Grothe O, Nicklas JY. Error grid analysis for arterial pressure method comparison studies. Anesth Analg. 2018;126(4):1177–1185.
- Mukkamala R, Yavarimanesh M, Natarajan K, et al. Evaluation of the accuracy of cuffless blood pressure measurement devices: challenges and proposals. Hypertension. 2021;78(5):1161–1167.
- Nordyke RJ, Appelbaum K, Berman MA. Estimating the impact of novel digital therapeutics in type 2 diabetes and hypertension: health economic analysis. J Med Internet Res. 2019;21(10):e15814.
- Omboni S. Connected health in hypertension management. Front Cardiovasc Med. 2019;6:76.
- Zeevi D, Korem T, Zmora N, et al. Personalized nutrition by prediction of glycemic responses. Cell. 2015;163(5):1079–1094.
- Pustozerov E, Tkachuk A, Vasukova E, et al. The role of glycemic index and glycemic load in the development of Real-Time postprandial glycemic response prediction models for patients with gestational diabetes. Nutrients. 2020;12(2):302.
- Pustozerov EA, Tkachuk AS, Vasukova EA, et al. Machine learning approach for postprandial blood glucose prediction in gestational diabetes mellitus. IEEE Access. 2020;8:219308–219321.
- Jorge J, Proenca M, Aguet C, et al. Machine learning approaches for improved continuous, non-occlusive arterial pressure monitoring using photoplethysmography. Annu Int Conf IEEE Eng Med Biol Soc. 2020;2020:910–913.
- Handelman GS, Kok HK, Chandra RV, et al. eDoctor: machine learning and the future of medicine. J Intern Med. 2018;284(6):603–619.
- Desebbe O, Anas C, Alexander B, et al. Evaluation of a novel optical smartphone blood pressure application: a method comparison study against invasive arterial blood pressure monitoring in intensive care unit patients. BMC Anesthesiol. 2022;22(1):259.