
Abstract
Purpose. Pre-treatment prediction of individual blood pressure (BP) response to anti-hypertensive medication is important to determine the specific regimen for promptly and safely achieving a target BP. This study aimed to develop supervised machine learning (ML) models for predicting patient-specific treatment effects using 24-hour ambulatory BP monitoring (ABPM) data.
Materials and Methods. A total of 1,129 patients who had both baseline and follow-up ABPM data were randomly assigned into training, validation and test sets in a 3:1:1 ratio. Utilising the features including clinical and laboratory findings, initial ABPM data, and anti-hypertensive medication at baseline and at follow-up, ML models were developed to predict post-treatment individual BP response. Each case was labelled by the mean 24-hour and daytime BPs derived from the follow-up ABPM.
Results. At baseline, 616 (55%) patients had been treated using mono or combination therapy with 45 anti-hypertensive drugs and the remaining 513 (45%) patients had been untreated (drug-naïve). By using CatBoost, the difference between predicted vs. measured mean 24-hour systolic BP at follow-up was 8.4 ± 7.0 mm Hg (% difference of 6.6% ± 5.7%). The difference between predicted vs. measured mean 24-hour diastolic BP was 5.3 ± 4.3 mm Hg (% difference of 6.8% ± 5.5%). There were significant correlations between the CatBoost-predicted vs. the ABPM-measured changes in the mean 24-hour Systolic (r = 0.74) and diastolic (r = 0.68) BPs from baseline to follow-up. Even in the patients with renal insufficiency or diabetes, the correlations between CatBoost-predicted vs. ABPM-measured BP changes were significant.
Conclusion. ML algorithms accurately predict the post-treatment ambulatory BP levels, which may assist clinicians in personalising anti-hypertensive treatment.
PLAIN LANGUAGE SUMMARY
The prediction of post-treatment BP response is essential to plan the appropriate optimal treatment strategy for achieving the target BP level.
The poor predictability of the post-treatment BP level is due to the complex pathophysiology of individual BP response, which can partly explain the poor rate to achieve the target systolic BP.
In this current study including both treated and untreated patients with hypertension, machine leaning models predicted the post-treatment mean BP levels on 24-hr ABPM even in high-risk patients and patients with a high BP variability.
Model-derived selection and optimisation of anti-hypertension drugs may facilitate prompt achievement of adequate BP control without drug-related complications and avoiding repeating 24-hour ABPM or multiple visits for drug readjustment.
Introduction
Hypertension is a significant modifiable risk factor for cardiovascular and cerebrovascular diseases.Citation1 Although accurate blood pressure (BP) measurement is essential for risk stratification and to inform treatment for hypertension, extensive variance in conventional BP measurements in the office setting limits a comprehensive assessment of the underlying usual BP. Reports show that mean 24-hour ambulatory BP has a stronger association than office BP with hypertension-induced target organ damage and adverse clinical outcomes.Citation2,Citation3 Furthermore, studies have shown that in-treatment ambulatory BP better predicted subsequent cardiovascular events than clinic-measured BP, even after adjustment for classical risk factors.Citation4–5 Thus, the current guidelines for hypertension diagnosis and management recommend 24-hour ambulatory BP monitoring (ABPM) as a prerequisite for clinical decision-making. Although the mean 24-hour and daytime BP measures have been used to guide hypertension management, the approach to effectively processing and using ABPM-derived large-scale data to personalise treatment strategies and to maximise clinical benefits remains unclear.
Pre-treatment prediction of individual BP response to anti-hypertension medication is important to determine the specific drugs and dosage and to promptly achieve a target BP level while avoiding drug-related complications. However, the relative efficacy of anti-hypertension drugs on BP reduction in populations with heterogeneous clinical features remains unclear. Because various phenotypic characteristics such as age, sex, ethnicity, body mass index, baseline systolic BP (SBP) and diastolic BP (DBP) level, and underlying comorbidities potentially affect patient response, accurately predicting individual response to BP management is challenging in the clinical setting.Citation6–8
Machine learning (ML) techniques as a part of artificial intelligence have emerged as highly effective computer algorithms to identify patterns in large datasets with a multitude of variables, facilitating the building of models for data-driven prediction or classification. Recently, the superiority of the state-of-the-art ML approaches over traditional statistical methods in predicting prognosis using complex datasets has been highlighted in the field of cardiovascular disease. This study aimed to develop ML models for predicting patient-specific treatment effects using ABPM data.
Methods
Study population. A retrospective observational cohort identified by electronic medical record data at Asan Medical Centre was used for the study. Between January 2010 and December 2018, a total of 18,694 patients underwent 24-hour ABPM at least once for the diagnosis of hypertension or the optimisation of anti-hypertension treatment. Of those, 1,129 patients who had both baseline ABPM and follow-up ABPM (within 6 months from baseline) data and were available were finally included in the current analysis. To develop the models to predict individual BP response to anti-hypertension medication, the patients were randomly assigned to training, validation, and test sets in a 3:1:1 ratio (). Therefore, data of 677 patients in the training set and 226 patients in the validation set were assigned for model training. Then, the non-overlapping test set with 226 patients was used to evaluate the performance of models.
Table 1. Baseline characteristics.
The protocol for the retrospective data analysis was approved by the institutional review board of the Asan Medical Centre, and the need for informed consent was waived.
Model development
presents the overall flow of the development of the supervised ML models. Using a pre-processing algorithm for the electronic medical record-based ABPM data, sequential BP measurements with 30-minutes intervals were extracted and arranged into the data platform from 0:00 h to 24:00 h. The features including demographic and clinical data, laboratory findings, baseline ABPM data, anti-hypertension drugs and dosages administered during baseline ABPM, and post-ABPM adjustment of anti-hypertension drugs were utilised for the ML (). The mean 24-hour daytime and night-time SBPs (and DBPs), and the 6-hour mean SBPs (and DBPs) between 0:00-6:00, 6:00-12:00, 12:00-18:00, and 18:00-24:00 h were extracted from the baseline ABPM and used as features. Each case was labelled by the mean 24-hour and daytime SBPs (and DBPs) derived from the follow-up ABPM.
Figure 1. Development of the machine learning model. The overall flow of the development of the supervised ML models for predicting post-treatment ambulatory BP levels is shown.
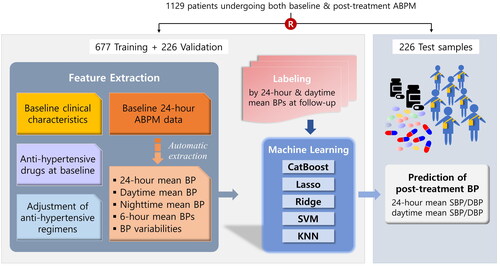
Table 2. Features used for machine learning.
To develop the models for predicting the post-treatment ambulatory BP levels, several ML algorithms such as support vector machine, K-nearest neighbour, and CatBoost were applied (Supplementary/appendix).
Model performance was assessed based on the difference between model-predicted vs. ABPM-measured BP (as ground truth) at follow-up. The percentage difference (% difference) was calculated as the difference divided by ABPM-measured BP at follow-up multiplied by 100 (%). The correlations between the model-predicted vs. the ABPM-measured BP changes from baseline to follow-up were also assessed. The performance of the models that had been built on the training set was evaluated using the test set.
BP variability was defined as the standard deviation of 24-hour SBP measurements on the baseline ABPM. For tertile analysis by BP variability, the low and intermediate groups were separated by 13.6 mm Hg and the intermediate and high BMI were separated by 17.5 mm Hg.
Statistical analysis
Statistical analyses to evaluate clinical information and ambulatory BP data were performed using SPSS (version 10.0, SPSS Inc., Chicago, IL, USA). All values are expressed as means ± 1 standard deviation (continuous variables) or as counts and percentages (categorical variables). Continuous variables were compared using unpaired t-tests, and categorical variables were compared using χ2 statistics. A p value <0.05 was considered statistically significant. Pearson product-moment correlation coefficient was used to assess the linear correlation between the ground truths vs. the predicted values.
Results
Baseline characteristics
Baseline clinical characteristics are summarised in . At baseline, 616 (54.6%) patients had been treated with mono or combination therapy using 45 anti-hypertension drugs, and the remaining 513 (45.4%) patients had been untreated (drug-naïve). Drugs and classes used at baseline and follow-up are summarised in Supplementary Tables 1 and 2, respectively. summarises the ABPM data at baseline and follow-up and the changes in the ambulatory BP level from baseline to follow-up.
Table 3. Twenty-four-hour ABPM data at baseline and at follow-up.
Model performances
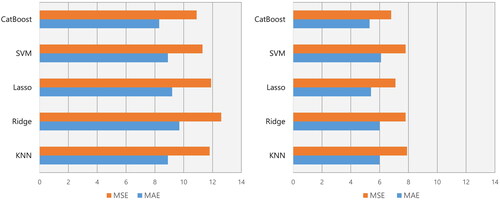
To predict the averaged 24-hour SBP at follow-up, the mean absolute errors (MAEs) and the mean squared errors (MSEs) were 8.3 mmHg and 10.9 mmHg, respectively, with CatBoost, For the prediction of the averaged 24-hour DBP at follow-up, the MAEs and the MSEs were 5.3 mmHg and 6.8 mmHg, respectively, with CatBoost, Among those models, CatBoost best predicted the post-treatment ambulatory BP levels ().
Figure 2. Model performance for the prediction of averaged 24-hour SBP and DBP. Left panel: For the prediction of averaged 24-hour SBP at follow-up, the mean absolute errors (MAEs) and the mean squared errors (MSEs) were 8.3 mmHg and 10.9 mmHg, respectively, with CatBoost, 8.9 mmHg and 11.8 mmHg with K-nearest neighbour (KNN), and 8.9 mmHg and 11.3 mmHg with support vector machine (SVM). Right panel: To predict averaged 24-hour DBP at follow-up, the MAEs and the MSEs were 5.3 mmHg and 6.8 mmHg, respectively, with CatBoost, 6.0 mmHg and 7.8 mmHg with KNN, and 6.1 mmHg and 7.8 mmHg with SVM.
and summarise the performance of each algorithm in predicting the mean 24-hour and daytime BP levels on the follow-up ABPM after drug adjustments. Using the CatBoost model, the difference between predicted vs. measured mean 24-hour SBP at follow-up was 8.4 ± 7.0 mm Hg (% difference of 6.6% ± 5.7%). The difference between predicted vs. measured mean 24-hour DBP was 5.3 ± 4.3 mm Hg (% difference of 6.8% ± 5.5%). In addition, the differences between predicted vs. measured mean daytime SBP and DBP were 8.8 ± 7.0 mm Hg (% difference of 6.7% ± 5.8%) and 5.6 ± 4.4 mm Hg (% difference of 7.0% ± 5.5%), respectively.
Table 4. Prediction of post-treatment 24-hour ambulatory BP in test set.
Table 5. Prediction of post-treatment daytime ambulatory BP in test set.
shows a significant correlation between the CatBoost-predicted vs. the ABPM-measured changes in the mean 24-hour SBP (r = 0.74, p < 0.001) and DBP (r = 0.68, p < 0.001) from baseline to follow-up. Similarly, the CatBoost-predicted changes in mean daytime SBP (r = 0.73, p < 0.001) and DBP (r = 0.68, p < 0.001) from baseline to follow-up correlated with the ABPM-measured changes. also shows the correlations between the predicted vs. measured BP changes by applying other models.
Figure 3. Comparison between CatBoost-predicted vs. ABPM-measured ambulatory BP changes. In the test set, there are significant correlations between CatBoost-predicted changes compared to the ABPM-measured changes in mean 24-hour BPs from baseline to follow-up (upper panels). Furthermore, the CatBoost-predicted changes in mean daytime BPs correlate with the ABPM-measured BP changes (lower panels).
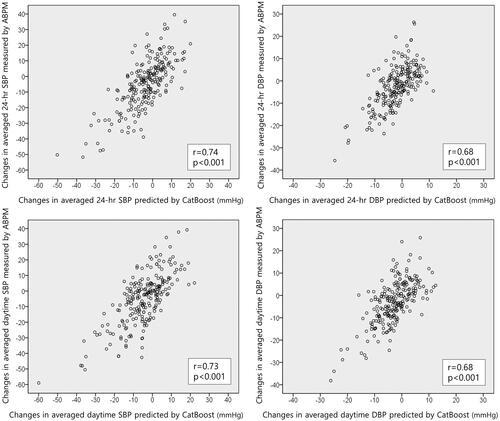
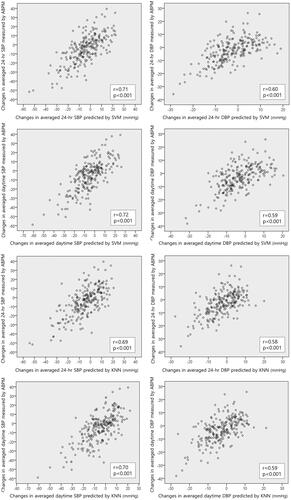
Figure 4. Prediction of ambulatory BP changes by KNN and SVM. In the test set, there are significant correlations between the model-predicted changes compared to the ABPM-measured changes from baseline to follow-up.
High-risk patient subsets
Supplemental Figure 1 shows the model performances for the prediction of post-treatment ambulatory BP in the setting of renal insufficiency. In patients with a GFR <60 mL/min/1.73 m2, there are significant correlations between CatBoost-predicted over ABPM-measured mean 24-hour BPs at follow-up. The CatBoost-predicted changes in mean 24-hour BP from baseline to follow-up also correlated with those measured using ABPM in the test set. In patients with diabetes, CatBoost-predicted and ABPM-measured mean 24-hour SBP at follow-up (r = 0.65, p < 0.001) were significantly correlated. Furthermore, CatBoost-predicted mean 24-hour DBP at follow-up significantly correlated with that measured by ABPM (r = 0.78, p < 0.001) in the test set.
In the high tertile of BP variability, we observed a significant association between the CatBoost-predicted vs. the ABPM-measured changes in mean 24-hour SBP (r = 0.76, p < 0.001) and DBP (r = 0.66, p < 0.001) from baseline to follow-up.
Discussion
The mean 24-hour ambulatory BP is more likely to represent the underlying regular BP and to identify patterns of diurnal variation as compared to the highly labile office-measured BP. The use of ABPM is generally recommended for patients under consideration for BP-lowering therapy.Citation6,Citation7 Although repeated ABPM at follow-up is not routinely indicated for all treated patients, previous studies have shown that ambulatory BP control is superior to office BP control in stratifying cardiovascular risk among treated and untreated patients.Citation4,Citation5 In addition, in-treatment (vs. pre-treatment) ambulatory BP level better contributed to the prediction of subsequent cardiovascular disease.
The prediction of post-treatment BP response is essential to plan the appropriate treatment strategy and safely and quickly achieve the target BP level. Although clinical trials and meta-analyses have identified an approximate mean BP change, the individual responses are heterogeneous. In addition, clinically relevant differences in the BP-lowering efficacy exist among specific drugs.Citation6 Thus, personalised drug optimisation frequently requires multiple readjustments in the regimen by trial and error. The complex pathophysiology of BP response and the diverse patient phenotypes limit the predictability of the post-treatment BP level, which can partly explain the poor response rate of only 14% of patients globally achieving the target SBP level of <140 mm Hg.Citation9
A previous study that used ML analysis with electrical medical recording data showed that the factors affecting the adequate BP control were age, body mass index, smoking, a lower office-measured BP at baseline, types of anti-hypertension drugs and concomitant medications.Citation6,Citation10 Sun et al. developed an ML model to predict the risk of worsening BP control with an accuracy of 77%.Citation11 Another ML algorithm trained using demographic and laboratory data predicted the risk of developing uncontrolled hypertension in patients with previously controlled BP with an area under the curve of 0.7.Citation12 However, models to predict the individual treatment effect on BP lowering or to guide a patient-specific treatment are lacking.
In our current study, the ML models for predicting post-treatment ambulatory BP level utilised features including clinical characteristics, initial 24-hour ABPM data, and initial and adjusted anti-hypertension medication. Both untreated patients and those already receiving BP-lowering therapy were enrolled in the analysis. Moreover, ABPM-derived mean 24-hour and daytime BPs were used as the endpoints to precisely assess the effectiveness of medical treatment. By applying kernels, Support vector machines are automatically regularised to avoid overfitting with high-dimensional data. K-nearest neighbours assessed the predictive value of similarity measure was assessed by using. Among decision tree models with similar performance, CatBoost for gradient boosting on decision trees was used. Among the developed models, CatBoost best predicted the post-treatment ambulatory BP levels. The percentage differences between Catboost-predicted vs. ABPM-measured mean 24-hour SBP and DBP at follow-up were 6.6% ± 5.7% and 6.8% ± 5.5%, respectively. The model also predicted the mean daytime BP with a difference of <7%. Even among high-risk patients with chronic renal diseases and diabetes mellitus, a consistent correlation between the CatBoost-predicted vs. ABPM-measured mean 24-hour BP at follow-up was observed. For patients with a high BP variability in whom achieving the target BP is challenging, the models accurately predicted post-treatment BP changes.
ML technologies, which represent the application of advanced computational power to big data, have become a promising tool for stratifying cardiovascular risks and informing personalised treatment, referred to as precision medicine. Artificial intelligence-integrated management is potentially beneficial in determining a patient-specific BP goal, adequate medication and interventions targeting modifiable risk factors, and BP estimation by noisy signals from mobile devices.Citation13,Citation14 Using recognised and unrecognised features, ML models predicted treatment adherence and success in each patient.Citation15,Citation16 By predicting the post-treatment ambulatory BP level, our ML models can help clinicians identify patients who would benefit more from treatment and choose the appropriate drugs and dosage. Ultimately, model-derived selection and optimisation of anti-hypertension drugs may facilitate prompt achievement of adequate BP control without drug-related complications and avoiding repeating 24-hour ABPM or multiple visits for drug readjustment. Furthermore, this approach can be a basis for artificial intelligence-integrated health care utilising wearable devices.
Limitations
A lot of anti-hypertensive drugs with various combinations were used as features, which may have decreased the effectiveness of the ML model. Because more than a half of drugs were administered to <1% of patients, a large-scale dataset that covers the diverse regimens is necessary for the precise determination of the weight of each drug in the model and improving the model performance. With the potential risk for being biased by outliers, deep learning approach could not be applied to the relatively small dataset al.though the primary purpose of treatment is BP reduction, the diurnal BP variation might have prognostic implications. Further study is required to account for BP variability. This study did not provide the changes in biochemistry and laboratory data at follow-up. In addition, the models should be optimised for patients with specific conditions such as secondary hypertension, pregnancy-induced hypertension, and various other co-morbidities. Finally, external validation is needed for the general application of the models for all patients with heterogeneous phenotypes. Because we did not show clinical outcome data, the impact of the models on reducing the rate of cardiovascular events should be validated in future studies.
Conclusion
In both treated and untreated patients with hypertension, the data-driven approach can be useful to accurately predict the post-treatment ambulatory BP level. Model-based selection and optimisation of anti-hypertension drugs may assist clinicians in personalising treatment for effective and safe achievement of adequate BP control.
Supplemental Material
Download MS Word (599.5 KB)Disclosure statement
No potential conflict of interest was reported by the authors.
Additional information
Funding
References
- Global Burden of Metabolic Risk Factors for Chronic Diseases Collaboration Cardiovascular disease, chronic kidney disease, and diabetes mortality burden of cardiometabolic risk factors from 1980 to 2010: a comparative risk assessment. Lancet Diabetes Endocrinol. 2014;2(8):1–9.
- Khattar RS, Swales JD, Banfield A, et al. Prediction of coronary and cerebrovascular morbidity and mortality by direct continuous ambulatory blood pressure monitoring in essential hypertension. Circulation. 1999;100(10):1071–1076.
- Staessen JA, Thijs L, Fagard R, et al. Predicting cardiovascular risk using conventional vs ambulatory blood pressure in older patients with systolic hypertension. JAMA. 1999;282(6):539–546.
- Verdecchia P, Reboldi G, Porcellati C, et al. Risk of cardiovascular disease in relation to achieved office and ambulatory blood pressure control in treated hypertensive subjects. J Am Coll Cardiol. 2002;39(5):878–885.
- Clement DL, De Buyzere ML, De Bacquer DA, Office versus Ambulatory Pressure Study Investigators, et al. Prognostic value of ambulatory blood-pressure recordings in patients with treated hypertension. N Engl J Med. 2003;348(24):2407–2415.
- Paz MA, de-La-Sierra A, Sáez M, et al. Treatment efficacy of anti-hypertensive drugs in monotherapy or combination: ATOM systematic review and meta-analysis of randomized clinical trials according to PRISMA statement. Medicine (Baltimore). 2016;95(30):e4071.
- Whelton PK, Carey RM, Aronow WS, et al. 2017 ACC/AHA/AAPA/ABC/ACPM/AGS/APhA/ASH/ASPC/NMA/PCNA. Guideline for the prevention, detection, evaluation, and management of high blood pressure in adults: a report of the American college of cardiology/American heart association task force on clinical practice guidelines. J Am Coll Cardiol. 2018;71(19):e127-248–e248.
- Williams B, Mancia G, Spiering W, ESC Scientific Document Group, et al. 2018 ESC/ESH guidelines for the management of arterial hypertension. Eur Heart J. 2018;39(33):3021–3104.
- Egan BM, Kjeldsen SE, Grassi G, et al. The global burden of hypertension exceeds 1.4 billion people: should a systolic blood pressure target below 130 become the universal standard? J Hypertens. 2019;37(6):1148–1153.
- Koren G, Nordon G, Radinsky K, et al. Machine learning of big data in gaining insight into successful treatment of hypertension. Pharmacol Res Perspect. 2018;6(3):e00396.
- Sun J, McNaughton CD, Zhang P, et al. Predicting changes in hypertension control using electronic health records from a chronic disease management program. J Am Med Inform Assoc. 2014;21(2):337–344.
- Mohammadi R, Jain S, Agboola S, et al. Learning to identify patients at risk of uncontrolled hypertension using electronic health records data. AMIA Jt Summits Transl Sci Proc. 2019;2019:533–542.
- Lacson RC, Baker B, Suresh H, et al. Use of machine-learning algorithms to determine features of systolic blood pressure variability that predict poor outcomes in hypertensive patients. Clin Kidney J. 2019;12(2):206–212.
- Wong MKF, Hei H, Lim SZ, et al. Applied machine learning for blood pressure estimation using a small, real-world electrocardiogram and photoplethysmogram dataset. Math Biosci Eng. 2023;20(1):975–997.
- da Silva VJ, da Silva Souza V, Guimarães da Cruz R, et al. Commercial devices-based system designed to improve the treatment adherence of hypertensive patients. Sensors (Basel). 2019;19(20):4539.
- Duan T, Rajpurkar P, Laird D, et al. Clinical value of predicting individual treatment effects for intensive blood pressure therapy. Circ Cardiovasc Qual Outcomes. 2019;12:e005010.