
Abstract
Purpose
Previous studies have indicated that the prevalence rate of hypertension in adolescents is high, but it has not received much attention and the influencing factors are unclear, especially in Yunnan Province, China.
Materials and methods
A cluster sampling method was used to investigate 4781 freshmen in a college in Kunming, Yunnan Province from November to December. Demographic and lifestyle data were collected using questionnaires, and height, weight and blood pressure were measured. Decision tree model of hypertension in college students was established by Chi-square automatic interactive detection method.
Results
Prevalence of prehypertension of systolic blood pressure (SBP) and diastolic blood pressure (DBP) were detected in 33.9% and 32.1%, respectively. Prevalence of hypertension of SBP and DBP was detected in 1.2% and 7.2%, respectively. The hypertension and prehypertension decision tree of SBP has gender (χ2 = 728.64, p < .001) at the first level and body mass index (BMI) (boys: χ2 = 55.98, p < .001; girls: χ2 = 79.58, p < .001) at the second level. The hypertension and prehypertension decision tree of DBP has gender (χ2 = 381.83, p < .001) at the first level, BMI (boys: χ2 = 40.54, p < .001; girls: χ2 = 48.79, p < .001) at the second level, only children (χ2 = 6.43, p = .04) and red wine consumption (χ2 = 8.17, p = .017) at the third level.
Conclusions
The present study suggests that gender, BMI, only children and red wine consumption were the main factors affecting hypertension in college students in southwest border areas of China.
Plain language summary
Hypertension in Chinese adolescent is generally ignored. This study first reports the prevalence of hypertension in adolescents in Yunnan Province, China.
Four thousand seven hundred and eighty-one freshmen were surveyed and height, weight and blood pressure were measured. A decision tree model was used to analyze the predictors of hypertension.
The study demonstrated that gender, BMI, only children and red wine predict hypertension in adolescents.
Introduction
Hypertension is one of the leading causes of death worldwide and a major risk factor for cardiovascular disease and related diseases [Citation1]. Hypertension is a chronic disease with an increasing global prevalence. Although improvements in hypertension control have been reported in high-income countries over the past three decades, hypertension remains a major public health issue in low-income countries [Citation2]. Several epidemiologic studies have shown that only a third of people in low - and middle-income countries understand their hypertension status, and only about 8% make it under control [Citation3].
Hypertension is widely believed to be a more common condition among the elderly. The findings of some studies show that the incidence of hypertension has significantly increased in adolescents, while the common risk prediction models for hypertension have not been validated in adolescents [Citation4]. U.S. National Health and Nutrition Examination Survey (NHANESN) reported that the prevalence rate of hypertension in children and adolescents aged 5–18 increased by 14.2% during 1999–2014 [Citation5]. Hypertension in Chinese adolescents has received insufficient attention. Limited studies have shown that the blood pressure levels and prevalence rate of hypertension in Chinese children and adolescents are increasing. China Health and Nutrition Survey (CHNS) reported that systolic blood pressure (SBP) increased from 96.1 mmHg to 102.7 mmHg and diastolic blood pressure (DBP) increased from 62.6 mmHg to 67.4 mmHg in children and adolescents aged 7–17 during 1991 to 2015 [Citation6]. A nationwide survey in China in 2014 showed that 6.4% of children aged 7–18 suffered from hypertension [Citation7]. What’s more, adolescence shows higher blood pressure responsiveness [Citation8]. Therefore, hypertension in adolescents should be regarded as a serious health problem and not ignored.
Essential hypertension is the most common cause of hypertension in adolescents [Citation9]. Essential hypertension is increasingly recognized as a syndrome rather than a disease, which is affected by multiple factors [Citation10–12]. A systematic review and meta-analysis showed that being aged 30–60, married, living in an urban area, high income, smoking, family history of hypertension, overweight, obesity, diabetes and emotional symptoms (anxiety, stress and anger) were positively associated with hypertension; education level, physical activity and low dietary salt are negatively associated with hypertension [Citation13]. Reviewing the worldwide literature, lifestyle (smoking, drinking, dietary behavior, drug abuse, physical inactivity, mobile phone dependence, poor sleep quality, etc.), genetic factors (family history of hypertension, etc.), environmental factors (living environment, maternal growth hormone levels during pregnancy, etc.) and demographic variables (gender, age, etc.) and health status (obesity, basal metabolic rate, mental health status, etc.) are the main risk factors for hypertension [Citation13–17].
Lifestyle is an influential factor in hypertension. First, it is widely recognized that smoking and drinking are risk factors for hypertension [Citation3,Citation17,Citation18]. For instance, a previous study has found that smoking and drinking are factors influencing hypertension in Hungarian adolescents [Citation19]. However, a large sample Mendelian randomized meta-analysis showed no association between smoking and changes in blood pressure [Citation20]. Second, studies have shown that eating behavior greatly affects blood pressure levels. It is well known that high sodium, low potassium, and low fruit and vegetable intake affect levels of blood pressure [Citation3,Citation21]. Similarly, dietary behavior under the influence of globalization has been linked to hypertension. CHNS reported that fast food, sugar-sweetened beverages (SSBs) and salty snacks increased the risk of hypertension (HR = 1.23–1.42) [Citation22]. A national study in Iran also found that the intake of junk food (take-away fast food, salty snacks, sweets and SSB) was significantly correlated with the blood pressure level of adolescents aged 6–18 [Citation16]. Third, physical inactivity is considered as a risk factor for hypertension [Citation3,Citation17]. A cohort study covering nine provinces in China showed that martial arts, gymnastics, table tennis and other sports can reduce the risk of hypertension in people over 18 years old (HR = 0.79–0.88) [Citation22]. Moreover, poor sleep quality (OR = 4.24) and smartphone addiction (OR = 2.21) were significantly and independently associated with adolescent hypertension [Citation23].
Genetics is a crucial predictor of hypertension. There are hints from previous studies that positive genes are associated with nearly 50% of essential hypertension [Citation10]. College students with two parents with hypertension have a significantly increasing risk of hypertension (OR = 4.5) [Citation24]. A Hungarian study showed that history of hypertension in parents was an independent risk factor for hypertension in adolescents [Citation19]. Chinese scholars believe that parental hypertension is an essential predictor of hypertension phenotype in normal weight adolescents [Citation25]. Also, the etiology of hypertension involves the complex interplay of environmental, pathophysiological factors and genetic predisposition [Citation26].
Obesity is associated with hypertension. First of all, obesity is considered an independent predictor of hypertension [Citation3,Citation19]. A study in Guangxi, China, found that the prevalence of hypertension in obese adolescents was significantly higher than that of those of normal weight [Citation25]. An Italian study reported that the risk of hypertension in obese adolescents was four times higher than that in adolescents of normal weight [Citation27]. Furthermore, the low metabolic rate (BMR) of Bangladeshi college students was positively correlated with SBP and DBP [Citation28]. What is clear is that a low BMR is likely to cause obesity because a low BMR consumes extremely little energy, which can easily lead to fatty build-up and excess energy.
The environment, including the maternal environment during pregnancy and the living environment after birth, is associated with hypertension. It has been shown that maternal growth hormone levels during pregnancy are associated with the risk of prehypertension and hypertension in their offspring [Citation29]. Additionally, post-birth living environmental factors such as environmental pollution (air, water, noise and artificial light sources), urbanization and low greening are also associated with hypertension [Citation3]. Interestingly, a study found that the greening degree of living environment is associated with the shift of blood pressure, and the higher the greening degree, the lower the incidence of hypertension [Citation30].
Gender and age are essential demographic variables in predicting hypertension. According to the epidemiological survey in Hungary, gender and age are the influencing factors of hypertension in adolescents [Citation19]. Worldwide, it is widely believed that the prevalence of hypertension in boys is higher than that in girls [Citation15]. A recent study found that age ≥24 years old is a risk factor for hypertension, and the incidence of hypertension increases with the increase of age [Citation17].
While a considerable number of studies have explored the factors responsible for hypertension globally, data in adolescents are very limited. Only a few studies have discussed hypertension in Chinese adolescents [Citation25,Citation31]. College students have a higher prevalence of hypertension. For instance, the prevalence rates of hypertension in college students in the United States, Congo and Iran were 30.3% [Citation24], 26.4% [Citation17] and 6.9% [Citation32], respectively. What’s more, college students have a low awareness of hypertension. Surveys in the United States showed that only 35% of college students understand about hypertension [Citation33]. To date, there are few data available on hypertension among adolescents in Yunnan Province, China. Yunnan lies in the southwestern border of China, and evidence on the burden of hypertension and associated factors is lacking among college students. Consequently, this study investigated the prevalence and influencing factors of hypertension among college students in Yunnan Province. Most previous studies have used regression models to explore the factors that influence hypertension. Considering the interaction mechanism among the factors and the effectiveness of the decision tree model, we use the decision tree model to analyze the predictors of hypertension in this study. The results can provide data support for the prevention and improvement of hypertension in college students.
Materials and methods
Study participants
From November to December 2021, a questionnaire survey and a physical examination were conducted on freshmen at a college in Kunming, Yunnan Province, China. After excluding invalid questionnaire and incomplete physical examination data, 4781 university students were included in the analysis. The average age of college students was (19.7 ± 1.6) years. Among them, 1586 (33.2%) were boys and 3195 (66.8%) were girls. There were 3531 (73.9%) Han and 1250 (26.1%) ethnic minorities. There were 3787 (79.2%) from rural areas and 994 (20.8%) from urban areas. There were 997 (20.9%) underweight, 3065 (64.1%) normal, 519 (10.9%) overweight and 200 (4.2%) obesity. More demographic variables are listed in .
Table 1. Comparison of frequency of prehypertension and hypertension in college students with different demographic variables.
Procedures
This study is part of the behavior and sub-health study in Yunnan adolescents (BSSYA). The research was designed to explore the effects of adolescent lifestyle and physical and mental sub-health through cross-sectional studies and cohort studies. The data included in this analysis are part of a cross-sectional survey. Participants were selected by cluster sampling, and all the sampled freshmen were included in the survey. Electronic questionnaire was produced using WenJuanXing (www.wjx.cn), which was verified by experts and tested by pre-investigation. College students were gathered in classrooms for the survey. After the investigator explained the purpose and precautions of the investigation, the college students scanned the QR code of the electronic questionnaire with their mobile phones and filled in the questionnaire. It takes about 15 min to complete the questionnaire. Demographic variables, lifestyle (smoking, drinking, eating, etc.) and family history of hypertension were investigated. College students were asked to fill out the questionnaire independently and without discussing it with their classmates. The survey was administered by trained interviewers, who were on hand to answer questions posed by participants. Participants who completed the questionnaire volunteered to have their height, weight and blood pressure measured. None of the participants underwent antihypertensive therapy prior to the blood pressure measurement. This was an anonymous survey in which participants provided informed consent prior to participation. Participants were also made aware that they could withdraw from the survey at any time. The study was approved by the Ethics Committee of School of Medicine, Kunming University (approval number: 2021001).
Measures
Sociodemographic variables
Demographic variables assessed in this study included gender, ethnicity, age, residence, only child, parental occupation, family type, parental educational background, the number of close friends, self-evaluation family economic conditions, academic pressure and family history of disease.
Height and weight measurement
The height and weight of participants were measured using an Ultrasonic Height and Weight Meter (Beryl, BYH01BT, Zhongshan, China). Participants took off their shoes and coats and stood upright with their heels together. The heel, sacrum and scapulae were in contact with the column in a three-point line standing position. The height measurement is accurate to 0.1 cm, and the weight measurement is accurate to 0.1 kg. The formula for calculating body mass index (BMI) is BMI = weight (kg)/height (m)2. There are four categories of BMI [Citation34]: low weight (BMI < 18.5 kg/m2), normal weight (18.5 kg/m2 ≤ BMI < 24 kg/m2), overweight (24 kg/m2 ≤ BMI < 28 kg/m2) and obesity (BMI ≥ 28 kg/m2).
Blood pressure measurement
Blood pressure was measured by an upper arm medical electronic sphygmomanometer (OMRON, J760, Kyoto, Japan). After 15 min of completing rest, the participants were seated and their blood pressure was measured using a sphygmomanometer at the same level as the heart and right arm cuff. The unit of measurement for blood pressure is mmHg. Participants diagnosed with hypertension had their blood pressure measured twice. Blood pressure includes SBP and DBP. Hypertension diagnostic criteria were recommended by the Chinese Guidelines for Hypertension Prevention and Treatment (2018 Revision) [Citation35]: SBP < 120 mmHg and DBP < 80 mmHg was normal blood pressure, 120 mmHg ≤ SBP < 140 mmHg and/or 80 mmHg ≤ DBP < 90 mmHg was prehypertension, SBP ≥ 140 mmHg and/or DBP ≥ 90 mmHg was hypertension. Blood pressure was measured by a specialist nurse.
Statistical analysis
An Excel database was exported from the questionnaire system and was checked. Statistical analysis was performed using SPSS 23.0 (SPSS Inc., Chicago, IL) software. Descriptive statistics, Mann–Whitney test, Kruskal–Wallis test and decision tree model were performed in the SPSS software (SPSS Inc., Chicago, IL). Descriptive statistics were used to calculate the proportions of demographic variables and the prevalence of hypertension. The Mann–Whitney test and the Kruskal–Wallis test were used to compare the differences in the prevalence of prehypertension and hypertension in college students with different demographic characteristics. A Chi-square automatic interaction detection method was used to build decision trees for prehypertension and hypertension. In the decision tree model, the dependent variables were grade data (1 = normal blood pressure, 2 = prehypertension and 3 = hypertension). Independent variables in the model included demographic variables with statistical significance in univariate analysis and confounding variables that may affect hypertension in college students: gender (1 = boy, 2 = girl), only children (0 = no, 1 = yes), number of friends (1 = 0, 2 = 1–2, 3 = 3–4, 4 = >5), self-evaluation family economic conditions (1 = worse, 2 = poor, 3 = medium, 4 = good, 5 = better), major (1 = engineering, 2 = management, 3 = pedagogy, 4 = science, 5 = agronomy, 6 = literature, 7 = medicine, 8 = art, 9 = other), cigarette smoking (0 = no, 1 = yes), smoke electronic (0 = no, 1 = yes), exposure to passive smoking (0 = no, 1 = yes), drink white wine (0 = no, 1 = yes), drinking beer (0 = no, 1 = yes), drinking red wine (0 = no, 1 = yes), family history of hypertension (0 = no, 1 = yes), keep exercising (0 = no, 1 = yes) and BMI (1 = low weight, 2 = normal weight, 3 = overweight, 4 = obese). The maximum growth depth of the decision tree was 3, the minimum number of cases in the parent node was 100, and the minimum number of cases in the child node was 50. Using cross validation, the number of sample folds was 10. The importance values were adjusted by the Bonferroni method. Statistical significance was set at p < .05.
Results
Comparison of the prevalence of hypertension and prehypertension in college students
The prevalence of SBP prehypertension and hypertension was 33.9% and 1.2%, respectively, in college students. The prevalence rates of DBP prehypertension and hypertension were 32.1% and 7.2%, respectively. The total prevalence of hypertension in all participants, boys and girls was 8.5%, 5.7% and 2.8%, respectively. shows the prevalence of hypertension and prehypertension in college students with different demographic variables. There were significant differences in the prevalence of SBP hypertension and prehypertension in college students with different gender (Z = −26.91, p < .001), major (χ2 = 111.87, p < .001), self-evaluated family economic conditions (χ2 = 14.47, p = .006) and number of friends (χ2 = 14.42, p = .002). There were significant differences in the prevalence of DBP hypertension and prehypertension in college students with different gender (Z = −19.27, p < .001), major (χ2 = 68.54, p < .001) and only children (χ2 = −2.00, p = .004). However, there was no significant difference in the prevalence of hypertension and prehypertension among other demographic variables (p > .05).
Decision tree model
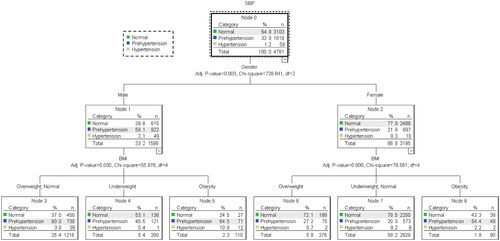
shows the SBP decision tree for predicting hypertension and prehypertension. The number of nodes in the SBP decision tree was 9, the number of terminal nodes was 6 and the depth was 2. The prediction accuracy of the model was 71.9%. In the first level, gender (χ2 = 728.64, p < .001), the prevalence of prehypertension (58.1%) and hypertension (3.1%) in boys was higher than that in girls (21.8% and 0.3%, respectively). In the second level was BMI (boys: χ2 = 55.98, p < .001; girls: χ2 = 79.58, p < .001). The prevalence rates of prehypertension and hypertension in boys (64.5% and 10.9%, respectively) and girls (54.4% and 2.2%, respectively) with obesity were the highest.
Figure 1. SBP decision tree for Yunnan university students.
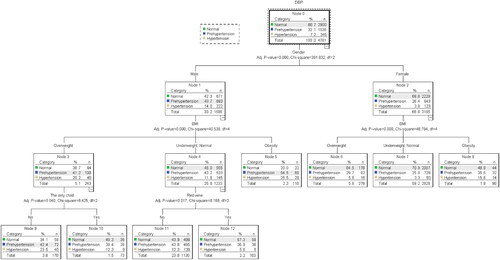
shows the DBP decision tree for predicting hypertension and prehypertension. The number of nodes in the SBP decision tree was 13, the number of terminal nodes was 8 and the depth was 3. The prediction accuracy of the model was 61.7%. In the first level, gender (χ2=381.83, p < .001), the prevalence of prehypertension (43.7%) and hypertension (14%) in boys was higher than that in girls (26.4% and 3.8%, respectively). In the second level was BMI (boys: χ2 = 40.54, p < .001; girls: χ2 = 48.79, p < .001). The prevalence rates of prehypertension and hypertension in boys (54.5% and 25.5%, respectively) and girls (35.6%% and 15.6%, respectively) with obesity were the highest. In the third level was only children (χ2 = 6.43, p = .04) and red wine consumption (χ2 = 8.17, p = .017). The prevalence of prehypertension (42.4%) and hypertension (23.5%) was highest in boys who are the only children with overweight BMI. Furthermore, the prevalence of prehypertension (43.8%) and hypertension (12.3%) was highest in boys who did not consume red wine with a normal weight and low weight.
Figure 2. DBP decision tree for Yunnan university students.
Discussion
Our findings indicate that the prevalence rates of SBP and DBP prehypertension were 33.9% and 32.1%, respectively, in Yunnan college students. Our data were similar to that of college students in Jilin Province, China (31.5%) [Citation36]. Our results are compatible with previous findings indicating that the total prevalence of hypertension in college students was 8.5%, slightly higher than that of college students in Anhui, China (7.2%) [Citation37], and greatly higher than that of college students in Wuhan, China (4.3%) [Citation15]. Similarly, the prevalence of hypertension among college students in Yunnan is higher than that in Ethiopia (7.7%) [Citation38], Iran (6.9%) [Citation32] and Bangladesh (6.5%) [Citation28]. Therefore, hypertension in Yunnan college students should be taken seriously.
We found that gender was at the top of the SBP and DBP decision trees for hypertension and prehypertension. The prevalence of SBP and DBP prehypertension and hypertension was substantially higher in boys than in girls. The total prevalence of hypertension in boys (5.7%) was twice as high as that in girls (2.8%). Our data were concordant with previous results: the prevalence rate of hypertension in boys (12.9%) was about four times that of girls (3.2%) in Anhui, China [Citation37]. The prevalence rate of hypertension in boys (7.9%) was about five times that of girls (1.6%) in Wuhan, China [Citation15]. In addition, studies of college students in Ghana [Citation39], Thailand [Citation40] and the United States [Citation41] all showed that the prevalence of hypertension in boys was more than twice that of girls. The mechanisms that gender difference in the prevalence of hypertension in college students are not completely characterized, possible explanations are as follows: first of all, hypertension is higher in boys than in girls, probably because boys have more hypertension risk factors such as obesity, smoking and alcohol consumption [Citation11]. Next, there are differences in the regulation of girls and boys essential arterial hypertension by sex chromosomes and sex hormones, including the occurrence and development of blood pressure in the course of life and the pathophysiological mechanism of blood pressure regulation [Citation42]. Furthermore, it is related to the pattern of trajectories of blood pressure changes across the sexes. Gender differences in hypertension begin early in life and change throughout life [Citation43]. Evidence suggests that girls SBP is lower than boys SBP from the age of 13; from the age of 16, DBP decreased in both sexes, but more rapidly in boys [Citation44].
Our data suggest that BMI is at the second level of the SBP and DBP decision trees for hypertension and prehypertension. The highest prevalence of prehypertension and hypertension in SBP and DBP was observed in obese college students. Our results support previous findings. The World Health Organization refers to obesity as abnormal or excessive fat accumulation that presents a health risk [Citation45]. Numerous population-based studies have documented obesity as a clear risk factor for hypertension [Citation12,Citation22]. Obese adolescents in Italy are four times more likely to develop hypertension than adolescents of normal weight [Citation27]. Hypertension was associated with higher BMI among college students in Thailand and Bangladesh [Citation28,Citation40]. Obesity (OR = 4.03–10.47) was significantly and independently associated with hypertension in adolescents in China and Ethiopia [Citation15,Citation23,Citation38]. It has been found that compositional disorders and metabolic syndrome constitute an intermediate phenotype of essential hypertension. Metabolic risk factors determined by body composition disorders and visceral obesity increase the risk of hypertension [Citation46]. Moreover, there is several evidence supporting that the oxidative stress, genetics, epigenetics and mitochondrial factors play an important role in the relationship between obesity and hypertension [Citation45]. In brief, our study supports the view that adolescents can prevent and improve hypertension through lifestyle changes [Citation9]. Maintaining normal BMI through intake of low-sodium diet, increasing vegetarian diet, reducing alcohol use and sticking to physical activity can effectively prevent hypertension and achieve long-term health effects [Citation17,Citation47,Citation48]. It is recommended that hypertension should be routinely screened in overweight and obese adolescents [Citation25].
Interestingly, red wine consumption was at the third level of the DBP decision tree for hypertension and prehypertension. The prevalence of prehypertension and hypertension was highest in normal-weight and low-weight boys who did not consume alcohol. No effect of red wine consumption on DBP was observed in girls. It is widely recognized worldwide that alcohol use is a risk factor for hypertension and that abstaining from alcohol can help lower blood pressure [Citation19,Citation49,Citation50]. In contrast, there is some evidence that red wine consumption has a protective effect against hypertension. Red wine polyphenols (RWPs), such as resveratrol, catechin, epicatechin, quercetin and anthocyanin, have a positive effect on hypertension, dyslipidemia and metabolic diseases [Citation51]. Possible mechanisms for the protective effect of RWPs on hypertension may include the following. First, RWPs changes lipid profiles, decrease in oxidative stress, improve the functionality of β1-adrenoceptors and so on [Citation52,Citation53]. Second, RWPs decrease the expression of adhesion molecules and growth factors, involved in migration and proliferation of vascular smooth muscle cells, and inhibit platelet aggregation [Citation54]. Third, RWPs enhance levels of high-density lipoprotein cholesterol, and inhibit lipoproteins oxidation, macrophage cholesterol accumulation and foam-cell formation [Citation55]. Fourth, RWPs decrease arterial damage, decrease the activity of angiotensin-II, and increase nitric oxide [Citation56]. Fifth, animal studies have shown that RWPs exert antihypertensive effects and improve endothelial function by reducing the plasma levels of ET-1 (endothelin-1) and the subsequent vascular production of O(2)(•–) (superoxide anion) in rats [Citation57]. RWPs can prevent Ang II-induced hypertension and endothelial dysfunction [Citation58].
Unexpectedly, only children are also on the third level of DBP decision tree for hypertension and prehypertension. The prevalence of prehypertension and hypertension was highest among non-only boys who were overweight. No effect was observed on DBP of only child girls. This is the first study to our knowledge to find differences in hypertension in only children. It is widely believed that only children have further health problems. However, limited studies have shown that the only children is healthier than people think, both physically and mentally [Citation59]. The CHNS showed an increase of standard deviation in age height Z score among only children compared with non-only children [Citation60]. In particular, only children reported fewer symptoms of loneliness and depression [Citation61,Citation62]. Under the COVID-19 epidemic, non-only children aged 12–18 in China are more likely than only children to suffer from anxiety and depressive symptoms, and more likely to be affected by COVID-19 [Citation63]. To be sure, only children receive more healthy investment from their parents, more love, attention, care and protection, and they have less financial and life stress. The lower prevalence of hypertension in only children may be related to the aforementioned advantages, which we will further focus on in the cohort study.
There are several strengths and limitations of our study. A main strength of our study is that this is the first study to investigate the prevalence of hypertension and its influencing factors in college students in Yunnan Province, China, filling the gap of relevant research data. In addition, a decision tree model was used to analyze the predictors of hypertension. The predictive ability of decision tree model was higher than that of logistic regression analysis model commonly used in influencing factors analysis [Citation64]. The results provide effective data support for the prevention and control of hypertension in college students in Yunnan. There are a number of limitations to this study that should be noted. First, while height, weight and blood pressure were measured, behavioral data were collected through questionnaires, inevitably with some recall bias. Second, hypertension was measured only twice in college students with high blood pressure and only once in participants with normal blood pressure. The blood pressure data were meaningful when the participants were rested for 15 min before their blood pressure was measured. Third, some of the new findings, such as the lower rate of hypertension among only children, cannot be fully explained and will be further clarified in cohort studies.
Conclusions
In conclusion, our study found that the prevalence of hypertension in college students in Yunnan Province is higher than that reported in domestic and foreign literature. Gender, BMI, only children and red wine consumption were the main predictors of hypertension in college students. Yunnan college students should pay attention to the harm of hypertension and develop diet and physical activity plans to effectively prevent it. Colleges should pay attention to the burden of hypertension in college students. Health education programs on hypertension have been developed and implemented for different genders, BMI and non-only children. Additionally, hypertension should be screened regularly among obese college students. The results of this study have positive implications for developing strategies to address hypertension and promoting healthy lifestyles among adolescents.
Author contributions
Xu Honglv designed the study, took primary responsibility for writing the manuscript, managing the literature analysis, and undertook the statistical analysis. Wang Wei, Wang Min and Chen Junyu searched and read literature. Yu Chunjie and Li Min compiled the database. Liu Dehui, Wang Jiai and Jiang Yinghong collected the data. All authors reviewed the manuscript.
Ethical approval
The study was approved by the Ethics Committee of School of Medicine, Kunming University (approval number: 2021001).
Disclosure statement
The authors declare that they have no conflicts of interest.
Additional information
Funding
References
- De Giuseppe R, Di Napoli I, Granata F, et al. Caffeine and blood pressure: a critical review perspective. Nutr Res Rev. 2019;32(2):1–13. doi: 10.1017/S0954422419000015.
- Schutte AE, Jafar TH, Poulter NR, et al. Addressing global disparities in blood pressure control: perspectives of the international society of hypertension. Cardiovasc Res. 2023;119(2):381–409. doi: 10.1093/cvr/cvac130.
- Schutte AE, Srinivasapura VN, Mohan S, et al. Hypertension in low- and middle-income countries. Circ Res. 2021;128(7):808–826. doi: 10.1161/CIRCRESAHA.120.318729.
- Mcevoy JW, Daya N, Rahman F, et al. Association of isolated diastolic hypertension as defined by the 2017 ACC/AHA blood pressure guideline with incident cardiovascular outcomes. JAMA. 2020;323(4):329–338. doi: 10.1001/jama.2019.21402.
- Sharma AK, Metzger DL, Rodd CJ. Prevalence and severity of high blood pressure among children based on the 2017 American Academy of Pediatrics Guidelines. JAMA Pediatr. 2018;172(6):557–565. doi: 10.1001/jamapediatrics.2018.0223.
- Ma SJ, Yang L, Zhao M, et al. Changing trends in the levels of blood pressure and prevalence of hypertension among Chinese children and adolescents from 1991 to 2015. Zhonghua Liu Xing Bing Xue Za Zhi. 2020;41(2):178–183.
- Dong YH, Zou ZY, Wang ZH, et al. Analysis on geographic distribution of high blood pressure prevalence in children and adolescents aged 7–18 years in China, 2014. Zhonghua Liu Xing Bing Xue Za Zhi. 2017;38(7):931–937.
- Van Woudenberg M, Abrahamowicz M, Leonard G, et al. Visceral fat enhances blood pressure reactivity to physical but not mental challenges in male adolescents. Pediatr Obes. 2015;10(5):395–402. doi: 10.1111/ijpo.12068.
- Riley M, Hernandez AK, Kuznia AL. High blood pressure in children and adolescents. Am Fam Physician. 2018;98(8):486–494.
- Manosroi W, Williams GH. Genetics of human primary hypertension: focus on hormonal mechanisms. Endocr Rev. 2019;40(3):825–856. doi: 10.1210/er.2018-00071.
- Wang JG, Zhang W, Li Y, et al. Hypertension in China: epidemiology and treatment initiatives. Nat Rev Cardiol. 2023;20(8):531–545. doi: 10.1038/s41569-022-00829-z.
- Tiruneh SA, Bukayaw YA, Yigizaw ST, et al. Prevalence of hypertension and its determinants in Ethiopia: a systematic review and meta-analysis. PLOS One. 2020;15(12):e244642. doi: 10.1371/journal.pone.0244642.
- Riaz M, Shah G, Asif M, et al. Factors associated with hypertension in Pakistan: a systematic review and meta-analysis. PLOS One. 2021;16(1):e246085. doi: 10.1371/journal.pone.0246085.
- Ukoh UC, Ujunwa FA, Muoneke UV, et al. Oscillometric blood pressure profile of adolescent secondary school students in Abakaliki metropolis. Ann Afr Med. 2020;19(1):31–39. doi: 10.4103/aam.aam_21_19.
- Jiang Q, Zhang Q, Wang T, et al. Prevalence and risk factors of hypertension among college freshmen in China. Sci Rep. 2021;11(1):23075. doi: 10.1038/s41598-021-02578-4.
- Payab M, Kelishadi R, Qorbani M, et al. Association of junk food consumption with high blood pressure and obesity in Iranian children and adolescents: the CASPIAN-IV study. J Pediatr. 2015;91(2):196–205. doi: 10.1016/j.jped.2014.07.006.
- Wanghi GI, Mutombo PB, Sumaili EK. Prevalence and determinants of hypertension among students of the University of Kinshasa, Democratic Republic of Congo: a cross-sectional study. Afr Health Sci. 2019;19(4):2854–2862. doi: 10.4314/ahs.v19i4.7.
- Chen L, Smith GD, Harbord RM, et al. Alcohol intake and blood pressure: a systematic review implementing a Mendelian randomization approach. PLoS Med. 2008;5(3):e52. doi: 10.1371/journal.pmed.0050052.
- Katona E, Zrinyi M, Komonyi E, et al. Factors influencing adolescent blood pressure: the Debrecen Hypertension Study. Kidney Blood Press Res. 2011;34(3):188–195. doi: 10.1159/000326115.
- Linneberg A, Jacobsen RK, Skaaby T, et al. Effect of smoking on blood pressure and resting heart rate: a Mendelian randomization meta-analysis in the CARTA Consortium. Circ Cardiovasc Genet. 2015;8(6):832–841. doi: 10.1161/CIRCGENETICS.115.001225.
- Chmielewski J, Carmody JB. Dietary sodium, dietary potassium, and systolic blood pressure in US adolescents. J Clin Hypertens. 2017;19(9):904–909. doi: 10.1111/jch.13014.
- Wang X, Zhao F, Zhao Q, et al. Specific types of physical exercises, dietary preferences, and obesity patterns with the incidence of hypertension: a 26-years cohort study. Int J Public Health. 2021;66:1604441. doi: 10.3389/ijph.2021.1604441.
- Zou Y, Xia N, Zou Y, et al. Smartphone addiction may be associated with adolescent hypertension: a cross-sectional study among junior school students in China. BMC Pediatr. 2019;19(1):310. doi: 10.1186/s12887-019-1699-9.
- Cuffee YL, Wang M, Geyer NR, et al. Vitamin D and family history of hypertension in relation to hypertension status among college students. J Hum Hypertens. 2022;36(9):839–845. doi: 10.1038/s41371-021-00577-6.
- Zhao W, Mo L, Pang Y. Hypertension in adolescents: the role of obesity and family history. J Clin Hypertens. 2021;23(12):2065–2070. doi: 10.1111/jch.14381.
- Oparil S, Acelajado MC, Bakris GL, et al. Hypertension. Nat Rev Dis Primers. 2018;4:18014. doi: 10.1038/nrdp.2018.14.
- Menghetti E, Strisciuglio P, Spagnolo A, et al. Hypertension and obesity in Italian school children: the role of diet, lifestyle and family history. Nutr Metab Cardiovasc Dis. 2015;25(6):602–607. doi: 10.1016/j.numecd.2015.02.009.
- Ali N, Mahmood S, Manirujjaman M, et al. Hypertension prevalence and influence of basal metabolic rate on blood pressure among adult students in Bangladesh. BMC Public Health. 2017;18(1):58. doi: 10.1186/s12889-017-4617-9.
- Kuciene R, Dulskiene V. Associations of maternal gestational hypertension with high blood pressure and overweight/obesity in their adolescent offspring: a retrospective cohort study. Sci Rep. 2022;12(1):3800. doi: 10.1038/s41598-022-07903-z.
- Bijnens EM, Nawrot TS, Loos RJ, et al. Blood pressure in young adulthood and residential greenness in the early-life environment of twins. Environ Health. 2017;16(1):53. doi: 10.1186/s12940-017-0266-9.
- Yang Y, Min J, Chang L, et al. Prevalence trends of hypertension among 9–17 aged children and adolescents in Yunnan, 2017–2019: a serial cross-sectional surveillance survey. BMC Public Health. 2021;21(1):338. doi: 10.1186/s12889-021-10258-1.
- Mansouri M, Pahlavani N, Sharifi F, et al. Dairy consumption in relation to hypertension among a large population of university students: the MEPHASOUS study. Diabetes Metab Syndr Obes. 2020;13:1633–1642. doi: 10.2147/DMSO.S248592.
- Sarpong DF, Curry IY, Williams M. Assessment of knowledge of critical cardiovascular risk indicators among college students: does stage of education matter? Int J Environ Res Public Health. 2017;14(3):250. doi: 10.3390/ijerph14030250.
- Zhou B. Predictive values of body mass index and waist circumference to risk factors of related diseases in Chinese adult population. Zhonghua Liu Xing Bing Xue Za Zhi. 2002;23(1):5–10.
- Writing Group of 2018 Chinese guidelines for the management of hypertension. Chin J Cardiovasc Med. 2019;24(1):24–56.
- Lu Z, Xiumin Z, Fangyuan W, et al. Relationship among undergraduate students’ prehypertension, obesity, autonomic nervous function, mental health and lifestyle. Mod Prev Med. 2018;45(12):2176–2179.
- Chen Y, Fang Z, Zhu L, et al. The association of eating behaviors with blood pressure levels in college students: a cross-sectional study. Ann Transl Med. 2021;9(2):155. doi: 10.21037/atm-20-8031.
- Tadesse T, Alemu H. Hypertension and associated factors among university students in Gondar, Ethiopia: a cross-sectional study. BMC Public Health. 2014;14:937. doi: 10.1186/1471-2458-14-937.
- Azupogo F, Abizari AR, Aurino E, et al. Malnutrition, hypertension risk, and correlates: an analysis of the 2014 Ghana Demographic and Health Survey Data for 15–19 years adolescent boys and girls. Nutrients. 2020;12(9):2737. doi: 10.3390/nu12092737.
- Thawornchaisit P, de Looze F, Reid CM, et al. Health-risk factors and the prevalence of hypertension: cross-sectional findings from a National Cohort of 87,143 Thai Open University students. Glob J Health Sci. 2013;5(4):126–141.
- Mok D, Bednarz JJ, Zieren J, et al. Double the prevalence of stage 2 hypertension readings in a small group of American pre-clinical medical students compared to young adults diagnosed with stage 2 hypertension in the United States. Cureus. 2020;12(3):e7448. doi: 10.7759/cureus.7448.
- Gerdts E, Sudano I, Brouwers S, et al. Sex differences in arterial hypertension. Eur Heart J. 2022;43(46):4777–4788. doi: 10.1093/eurheartj/ehac470.
- O’Neill KN, Bell JA, Davey SG, et al. Puberty timing and sex-specific trajectories of systolic blood pressure: a prospective cohort study. Hypertension. 2022;79(8):1755–1764. doi: 10.1161/HYPERTENSIONAHA.121.18531.
- O’Keeffe LM, Simpkin AJ, Tilling K, et al. Sex-specific trajectories of measures of cardiovascular health during childhood and adolescence: a prospective cohort study. Atherosclerosis. 2018;278:190–196. doi: 10.1016/j.atherosclerosis.2018.09.030.
- El MP, Wahoud M, Allam S, et al. Hypertension related to obesity: pathogenesis, characteristics and factors for control. Int J Mol Sci. 2022;23(20):12305.
- Litwin M, Kułaga Z. Obesity, metabolic syndrome, and primary hypertension. Pediatr Nephrol. 2021;36(4):825–837. doi: 10.1007/s00467-020-04579-3.
- Appel LJ. The effects of dietary factors on blood pressure. Cardiol Clin. 2017;35(2):197–212. doi: 10.1016/j.ccl.2016.12.002.
- Kawabe H, Azegami T, Takeda A, et al. Features of and preventive measures against hypertension in the young. Hypertens Res. 2019;42(7):935–948. doi: 10.1038/s41440-019-0229-3.
- Puddey IB, Mori TA, Barden AE, et al. Alcohol and hypertension-new insights and lingering controversies. Curr Hypertens Rep. 2019;21(10):79. doi: 10.1007/s11906-019-0984-1.
- Fuchs FD, Fuchs SC. The effect of alcohol on blood pressure and hypertension. Curr Hypertens Rep. 2021;23(10):42. doi: 10.1007/s11906-021-01160-7.
- Liberale L, Bonaventura A, Montecucco F, et al. Impact of red wine consumption on cardiovascular health. Curr Med Chem. 2019;26(19):3542–3566. doi: 10.2174/0929867324666170518100606.
- Castaldo L, Narvaez A, Izzo L, et al. Red wine consumption and cardiovascular health. Molecules. 2019;24(19):3626. doi: 10.3390/molecules24193626.
- Souza BG, Musial DC, Rocha K, et al. Red wine but not alcohol consumption improves cardiovascular function and oxidative stress of the hypertensive-SHR and diabetic-STZ rats. Clin Exp Hypertens. 2022;44(6):573–584. doi: 10.1080/10641963.2022.2085737.
- Dell’Agli M, Busciala A, Bosisio E. Vascular effects of wine polyphenols. Cardiovasc Res. 2004;63(4):593–602.
- Lippi G, Franchini M, Favaloro EJ, et al. Moderate red wine consumption and cardiovascular disease risk: beyond the "French paradox". Semin Thromb Hemost. 2010;36(1):59–70. doi: 10.1055/s-0030-1248725.
- Opie LH, Lecour S. The red wine hypothesis: from concepts to protective signalling molecules. Eur Heart J. 2007;28(14):1683–1693. doi: 10.1093/eurheartj/ehm149.
- Lopez-Sepulveda R, Gomez-Guzman M, Zarzuelo MJ, et al. Red wine polyphenols prevent endothelial dysfunction induced by endothelin-1 in rat aorta: role of NADPH oxidase. Clin Sci. 2011;120(8):321–333. doi: 10.1042/CS20100311.
- Sarr M, Chataigneau M, Martins S, et al. Red wine polyphenols prevent angiotensin II-induced hypertension and endothelial dysfunction in rats: role of NADPH oxidase. Cardiovasc Res. 2006;71(4):794–802. doi: 10.1016/j.cardiores.2006.05.022.
- Zhao S, Liang Y, Hee JY, et al. Difference in the sexual and reproductive health of only-child students and students with siblings, according to sex and region: findings from the National College Student Survey. Front Public Health. 2022;10:925626. doi: 10.3389/fpubh.2022.925626.
- Bredenkamp C. Policy-related determinants of child nutritional status in China: the effect of only-child status and access to healthcare. Soc Sci Med. 2009;69(10):1531–1538. doi: 10.1016/j.socscimed.2009.08.017.
- Lin S, Falbo T, Qu W, et al. Chinese only children and loneliness: stereotypes and realities. Am J Orthopsychiatry. 2021;91(4):531–544. doi: 10.1037/ort0000554.
- Chi X, Huang L, Wang J, et al. The prevalence and socio-demographic correlates of depressive symptoms in early adolescents in China: differences in only child and non-only child groups. Int J Environ Res Public Health. 2020;17(2):438.
- Cao Y, Huang L, Si T, et al. The role of only-child status in the psychological impact of COVID-19 on mental health of Chinese adolescents. J Affect Disord. 2021;282:316–321. doi: 10.1016/j.jad.2020.12.113.
- Ruiping Y, Xiliang W, Fanxia Y, et al. Comparison of the effects of decision tree model and logistic regression analysis model on identifying risk factors of hypertension. Chin J Dis Control Prev. 2022;26(02):218–222.