
Abstract
Purpose
Second-generation antipsychotic medications (SGAs) are widely used in child psychiatry. SGA-induced metabolic disturbances are common in children, but monitoring practices need systematisation. The study’s aims were to test an SGA-monitoring protocol, examine the distributions of metabolic measurements compared to reference values in child psychiatry patients, and determine whether using a homeostasis model for the assessment of insulin resistance (HOMA-IR) and triglyceride/high-density lipoprotein (TG/HDL) ratio could improve the detection of increased cardiometabolic risk.
Materials and methods
A systematic monitoring protocol was implemented. Weight and height, blood pressure, fasting glucose, insulin, HDL, and TG were measured at baseline and four times during follow-up. HOMA-IR, TG/HDL ratio and zBMI were calculated. Age-, gender- and BMI-specific percentile curves for HOMA-IR were used to define elevated cardiometabolic risk.
Results
The study patients (n = 55, mean age 9.9 years) were followed for a median of 9 months. A disadvantageous, statistically significant shift, often appearing within the reference range, was seen in zBMI, TG, HDL, glucose, insulin, HOMA-IR, and TG/HDL ratio. The increase in HOMA-IR appeared earlier than individual laboratory values and was more evident than the TG/HDL ratio increase. An HOMA-IR cut point of 1.98 resulted in a sensitivity and specificity of 83%. Compared to a previous study performed in the same location, the monitoring rates of metabolic parameters improved.
Conclusion
The monitoring protocol implementation improved the monitoring of metabolic parameters in child psychiatric patients using SGAs. Using HOMA-IR as part of systematic SGA monitoring could help detect metabolic adverse effects.
Introduction
Second-generation antipsychotic medications (SGAs) are widely used in child psychiatry, and their use has increased in recent years [Citation1,Citation2]. Multiple studies have reported SGA-induced metabolic disturbances in children [Citation3–7]. Despite these findings, monitoring practices of SGA treatment have remained heterogenous and often insufficient [Citation8–11].
The mechanisms of SGA induced metabolic effects are not fully understood. Increased appetite is a well-known adverse effect, but sedation and physical inactivity may further contribute to weight gain and metabolic effects [Citation12–14]. SGAs have also direct effects on lipid and glucose metabolism [Citation12,Citation13]. SGA treatment in children increases the risk for type 2 diabetes by two to threefold compared to peers [Citation4,Citation15]. In children and adolescents, the risk seems to emerge already during the first year of treatment, and longer and cumulative exposure further elevates it [Citation4,Citation15]. A recent study showed changes in body adiposity and insulin sensitivity arising already during the first 12 weeks of SGA treatment [Citation6]. An adverse development in metabolic parameters, such as body mass index (BMI), fasting plasma triglycerides (TG), fasting high-density lipoprotein (HDL) and fasting glucose, has been reported in several studies, and also in naturalistic clinical samples [Citation7,Citation11,Citation16]. However, recognition of these disadvantageous changes can be hard, especially in the early stages, when laboratory values remain within the reference ranges [Citation11]. New tools for the early detection of metabolic risk are needed in clinical work [Citation6]. Early identification of developing insulin resistance (IR) has been suggested as one approach [Citation17,Citation18]. The homeostasis model for the assessment of IR (HOMA-IR) is an indirect marker which is based on the relationship of fasting glucose and insulin levels, with higher values representing more severe IR and increased cardiometabolic risk [Citation18]. HOMA-IR correlates well with the euglycemic-hyperinsulinemic clamp, which is considered the gold standard for measuring IR [Citation19,Citation20]. HOMA-IR is also usable in repeated measures and enables the detection of individual changes in glucose tolerance [Citation19,Citation20]. Triglyceride/high-density lipoprotein ratio (TG-HDL ratio) has also been proposed for the assessment of impaired glucose tolerance and cardiometabolic risk in children [Citation21–23]. However, growth and development induce physiological changes in insulin metabolism, and also overweight promotes IR [Citation18]. Due to these facts, specific HOMA-IR and TG/HDL ratio cut points for children have been hard to establish [Citation18,Citation22]. Age- and gender-specific percentile HOMA-IR distributions for normal weight and obese or overweight children take these facts into account [Citation18]. However, risk-indicating cut points could be more usable in clinical settings.
The current heterogenous follow-up practices of SGA treatment in children do not sufficiently support the early identification of cardiometabolic risk [Citation8–11]. In a previous study of child psychiatric patients at Tampere University Hospital (TAUH), Finland, SGA monitoring practices were found to be diverse [Citation11]. Therefore, a systematic monitoring protocol aiming to improve the safety of the SGA treatment of child psychiatric patients was implemented in 2015.
Aims
The first aim of this study was to find out how the systematic SGA monitoring protocol was followed in a clinical setting. The second aim was to compare the observed distributions of metabolic measurements in SGA-treated children with reference values. The third aim was to examine whether combinations of metabolic measurements such as HOMA-IR and TG/HDL ratio could improve the detection of increased cardiometabolic risk.
Material and methods
This study was part of a prospective intervention study conducted at the child psychiatric unit of TAUH from 15 January 2015 to 31 January 2019. Patients were recruited to the study by attending physicians when initiating or switching SGA. Other clinical decisions aside from the SGA monitoring were not influenced. The inclusion criterium was a maximum age of 13.0 years when entering the study and at least one documented follow-up visit after the baseline (BL). Informed written consents were given by all patients over 7 years of age at the BL and by legal guardians of all patients.
Before the study period, with permission of the original authors, a physicians’ handbook and monitoring form were translated from the Canadian original publication “A Physician Handbook for Metabolic Monitoring for Youth with Mental Illness treated with Second-Generation Antipsychotics”, developed by Drs Panagiotopoulos, Davidson and Raghuram [Citation24]. The documents were then modified to fit Finnish clinical practices. The intended timing of follow-up visits and laboratory tests were: (1) at BL, (2) one month, (3) 4 months, (4) 10 months, and (5) 16 months after the BL and every six months thereafter. An easy-to-order set of laboratory tests was used to make the follow-up easily available. At BL, the monitoring form also guided the physicians to monitor the patient’s individual risk factors, physical activity (sports/hobbies) and family history of somatic (cardiovascular diseases, diabetes) and psychiatric disorders. During follow-up, the physicians reported all observed adverse reactions.
If the patient’s weight and height were both measured at the same visit, the raw body mass index (BMI) was calculated with the usual formula weight (kg)/height (m)2. However, children's BMI and its normal range change during their growth and therefore BMI cannot directly serve in estimating potential deviance; growth curves must be applied. Therefore, the standardised body mass index adjusted for age and gender (BMI z-score, zBMI), defining the BMI percentile of the child at the time of the measurement, was calculated using the formula ((rawBMI/muBMI)nuBMI − 1)/(nuBMI × sigmaBMI), where muBMI, nuBMI, and sigmaBMI were retrieved from the Finnish national growth reference tables [Citation25]. In addition, based on the recommendations of the International Obesity Task Force expert panel, these BMI percentiles were compared to the curves passing through BMIs of 25 and 30 kg/m2 at the age of 18 years, defining the limits for overweight and obesity, respectively, for 2–18 year-olds as well [Citation25]. When at least two zBMIs were available, minimum and maximum zBMI were calculated and compared. The values were rounded to one decimal to avoid detecting minimal changes. If the minimum occurred before the maximum, the patient was considered to have gained weight, and vice-versa for weight loss.
Blood pressure was measured with automatic blood pressure monitors using a cuff size appropriate to the patient’s arm circumference. To make the raw systolic and diastolic blood pressure values of all patients comparable, they were replaced by percentiles using the categorised height, and age-, gender- and height-specific reference tables of the American Academy of Pediatrics’ Clinical Practice Guideline for Screening and Management of High Blood Pressure in Children and Adolescents [Citation26]. At each measurement point, the smaller percentile was selected. Blood pressure was considered elevated if it was ≥ 90th percentile.
Blood samples were drawn after ∼12 h fasting, and concentrations of plasma glucose, HDL and TGs were assessed using standard enzymatic methods. Cut points: > 6.1 mmol/l for fasting glucose, ≤ 1.03 mmol/l for fasting HDL, and ≥ 1.24 mmol/l for fasting TG were used to define increased metabolic risk according to the National Cholesterol Education Program [Citation27,Citation28]. For fasting plasma glucose, also a lower cut point of ≥ 5.6 was used to identify patients with prediabetes or impaired fasting glucose [Citation29]. For fasting insulin, a cut point of > 25 mU/l was used because it is applied by TAUH laboratory services and it represents fasting insulin levels of the 99th percentile or above in boys and girls in all weight groups at the age of 10–11 years [Citation30].
HOMA-IR was calculated using the formula (fasting insulin (mU/l) × fasting glucose (mmol/l))/22.5 [Citation19]. Further, HOMA-IR percentile curves specific to age, gender, and dichotomised BMI percentile (normal or overweight/obese) were used to identify the percentile of each measurement [Citation18]. The cut point used to define overweight/obesity was the age- and gender-specific 85th BMI percentile, acquired from the Finnish national growth reference tables. A patient was considered to have increased cardiometabolic risk if the HOMA-IR percentile was at or above the 75th percentile [Citation18]. TG/HDL ratio was also calculated.
Categorised variables are reported as frequencies (numbers of cases or percentages, as appropriate). For normally distributed continuous variables, means (M) and standard deviations (SD) are given. Medians and quartiles (Md, Q1, Q3) are reported for non-normally distributed continuous variables. To test the statistical significance of differences between groups, Pearson’s Chi–Square test, Fisher’s exact test, the Mann–Whitney U test or the Kruskal–Wallis test were used, as appropriate. The Wilcoxon one-sample signed-rank test was applied to examine whether the changes in zBMI, HDL, and triglyceride values differed statistically significantly from zero. Receiver-operating characteristic (ROC) analysis was used to find the optimal cut point of HOMA-IR and TG/HDL for screening cardiometabolic risk, caseness being defined by HOMA-IR percentile. The analysis was repeated separately for BL and the four first follow-up visits, in which the number of patients was sufficient. To estimate an overall cut point, caseness was defined by the HOMA-IR percentile being at or above the 75th percentile at least once, and both mean and maximum HOMA-IR and TG/HDL were used. A p-value of less than 0.05 was considered significant, a value between 0.05 and 0.10 was indicative and values up to 0.10 are reported. SPSS Statistics, version 25 (IBM Corporation, New York, USA) was used for all the statistical analyses.
Results
Fifty-five children (76% males, n = 42) with a mean age of 9.9 years (SD 1.8, min 5.9, max 13) participated in the study at BL. The median follow-up time was 9 months (Q1 3.6, Q3 19.1, min 0.5, max 33). The most common SGA initiated at BL was risperidone, followed by aripiprazole and quetiapine (). At BL, 84% of the patients were antipsychotic naive, while the rest (n = 8) were switching from one SGA to another. During the study period, 35% of the patients had their SGA switched at least once (max twice). Background information, diagnoses, indications, and concomitant use of other psychotropic medications are reported in . Information concerning hobbies was available for 82%, of whom 27% had sport as a hobby.
Table 1. Frequency and doses of second-generation antipsychotics (SGA) prescribed to the study patients (n = 55) at baseline (BL) and during follow-up.
Table 2. Background factors of the study patients.
Metabolic testing and parameters at BL are reported in . Calculation of zBMI was possible for most patients, and one-third of them were overweight or obese. The majority of available fasting metabolic laboratory values were within the normal range. Seven percent of available blood pressure measurements were elevated or high. Forty percent of the patients had a higher than normal HOMA-IR percentile judged by the age-, gender- and BMI-specific reference percentiles ().
Table 3. Age of the patients, frequency of performed metabolic tests, the proportion of abnormal values, and absolute values of derived metabolic parameters in the study patients at baseline (BL) and follow-up visits (T1–T4).
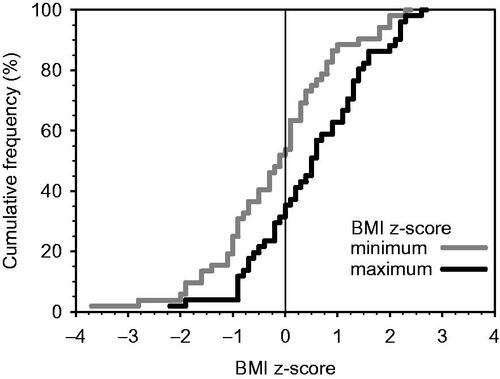
During the follow-up, physicians reported weight gain as an adverse effect at least once in 39% of the patients. The respective frequencies for reported deviations in laboratory values were 17%, 15% for fatigue and 7% for neurological symptoms. The timing of the follow-up visits, the frequency of metabolic testing and abnormal values during the follow-up are presented in . During the first four months (from BL to T2), the proportion of overweight or obese patients increased from 30% to 43% and further to 52% at ∼10 months (). Comparison of the maximum and minimum zBMI was possible for 95% (n = 52), and zBMI increased for 64% of them (). However, 42% (n = 14) of the patients who gained weight remained in the normal weight category (BMI < 25). The median increase in zBMI was 0.37 (Q1 −0.20, Q3 0.71, p = 0.007). One patient did not have information available for the calculation of any zBMI.
Figure 1. The cumulative frequency distribution of the minimum and maximum BMI z-score (zBMI) of the study patients.
During the follow-up, fasting glucose was rarely over > 6.1 mmol/l, but the proportion of patients exceeding the lower cut point indicating possible prediabetes (≥ 5.6 mmol/l) was larger, even 29% at T4. Comparison of the maximum and minimum fasting glucose values was possible for 98% (n = 54). In 56% of them, the value increased, the median change being 0.40 mmol/l (Q1 0.20, Q3 0.70, p < 0.001). Fasting insulin, TG, HDL and blood pressure values were quite seldom above the normal limits. Comparison of the maximum and minimum insulin values was possible in 93% (n = 51) and that of TG and HDL in 98% (n = 54). Values changed for the worse in 75% (n = 38) for insulin and in 52% (n = 28) for TG and HDL. The median changes were for insulin 6.0 mU/l (Q1 3.0, Q3 10.0, p < 0.001), for TG 0.40 mmol/l (Q1 0.21, Q3 0.62, p < 0.001) and for HDL −0.28 mmol/l (Q1 −0.41, Q3 −0.20 p < 0.001).
The median HOMA-IR and TG/HDL ratio increases were 1.47 (Q1 0.25, Q3 2.47, p < 0.001) and 0.25 (Q1 −0.40, Q3 0.79, p = 0.072), respectively (). The cut points for HOMA-IR and TG/HDL suggested by the ROC analysis are presented in . The overall cut point values for HOMA-IR were 1.47 when the mean (BL-T4) was used and 1.98 when the respective maximum value was used. In both cases, both sensitivity and specificity were 83%. The respective cut point values for TG/HDL were 1.01 and 1.28, resulting in sensitivities and specificities around 50% ().
Table 4. Results of ROC analyses were performed separately at baseline (BL) and during follow-up (T1–T4) as well as across these time points (overall cut point).
Discussion
This study was part of a prospective intervention study where a systematic monitoring protocol was introduced to improve SGA medication safety in child psychiatric patients. The previous study performed in the same clinical setting before the monitoring protocol implementation showed that SGA monitoring practices were irregular, and especially the BL information was often incomplete [Citation11]. Many studies have noted the insufficient metabolic SGA monitoring of child psychiatric patients [Citation8–11]. However, there is also promising evidence that the implementation of systematic protocols may improve monitoring, especially if they are fitted to local clinical practices [Citation31]. During this study period, the monitoring protocol was well followed and monitoring rates improved markedly at BL and during the follow-up compared to those presented in a previous study [Citation11]. Reporting the family history of cardiometabolic diseases changed from 53% to 82% [Citation11]. The BL monitoring frequency of zBMI increased from 34% to 91%, and that of lipid/glucose from 39% to 87% [Citation11]. During the follow-up, zBMI and metabolic laboratory tests results were available at least twice for almost all patients (93–98%), compared to the respective figures of 75% and 63% seen in the previous study [Citation11]. However, despite the improvement seen during this study, especially metabolic testing at BL and blood pressure follow-up still require attention, as the lack of BL monitoring endangers the early detection of metabolic changes [Citation10].
The study participants were mostly primary school-aged boys, many of whom were physically inactive. SGAs, most often risperidone, were prescribed for disruptive behaviour and/or affect dysregulation. Lack of physical activity together with SGA-induced appetite increase and disturbances in behavioural regulation complicate the maintenance of healthy weight [Citation14,Citation32]. Risperidone has repeatedly been associated with elevated metabolic risks emerging early during the course of treatment and increasing in a dose-dependent manner [Citation5,Citation15,Citation33]. Doses in this study were modest at BL but increased during the follow-up. As in previous studies, over half of the patients gained weight, and the zBMI increase appeared already during the first months of treatment [Citation6,Citation13]. Even though weight gain was the most commonly reported adverse effect, it was reported only in 39% of the patients. The fact that 42% of the patients who gained weight did not reach the BMI cut point for overweight can possibly explain this discrepancy. However, even a lesser weight gain contributes to metabolic and psychosocial wellbeing and should be registered also in order to prevent further increase. A similar disadvantageous shift was seen in fasting glucose, insulin, and lipid values. Also this shift appeared mostly within the reference ranges. These findings are in line with our previous study, suggesting that an unfavourable shift in metabolic parameters can easily be missed in clinical work [Citation11]. A lower cut point for fasting glucose, recommended for screening of prediabetes in obese children and adolescents [Citation29] seems to be a more feasible alarm threshold for increased metabolic risk.
An important finding in this study was that the detection of the imminent adverse metabolic consequences of SGA treatment could be improved by using combinations of metabolic measurements such as HOMA-IR as part of systematic monitoring. The absolute values of HOMA-IR increased during the follow-up. This increase was not solely explainable with increasing age, because the proportion of children with age-, gender- and BMI-specific HOMA-IR over the 75th percentile also increased markedly. Previous studies with larger samples have reported an early disadvantageous shift in the glucose metabolism of children using SGAs [Citation6,Citation15]. The findings of this study show that HOMA-IR could be clinically effective in detecting this shift, as the change seen in HOMA-IR seemed to appear earlier compared to individual metabolic parameters. However, due to age-, gender- and weight-specific differences in insulin metabolism, specific risk-indicating cut-points in children have been hard to establish. HOMA-IR cut points from 2.3 to 3.54 have been associated with increased cardiometabolic risk in children and adolescents [Citation17]. A lower cut point of 1.68 has been suggested for normal-weight individuals [Citation18]. According to the findings of this study, regardless of the patient’s zBMI, an HOMA-IR cut point as low as 1.98 could represent good sensitivity and specificity for detecting increased cardiometabolic risk. Aside from HOMA-IR, the absolute values of the TG/HDL ratio increased during the follow-up. However, these changes were not as evident as changes seen in HOMA-IR. Compared to previous studies, where the suggested TG/HDL ratio cut points indicating increased cardiometabolic risk have varied between 1.36 and 2.2; the cut points generated in this study were lower, but their sensitivity and specificity were at a most average [Citation22,Citation23,Citation34].
Psychiatric disorders are often accompanied by an unhealthy lifestyle, poor physical health, and even shorter life expectancy [Citation4,Citation7]. SGA-induced adverse metabolic changes emerging already in childhood endanger lifelong cardiovascular health [Citation3,Citation7,Citation20]. When SGAs are prescribed to children, a thorough medical assessment and evaluation of individual risk factors as well as family lifestyle habits are essential [Citation4]. Lifestyle interventions, parental support, and encouragement to do physical activity should be presented already at SGA initiation [Citation14]. The treatment of SGA-induced metabolic consequences is complex and results are not guaranteed [Citation3,Citation20]. Thus, systematic monitoring and prevention are essential [Citation4,Citation5,Citation9].
Conclusion
The implementation of the systematic protocol improved the metabolic monitoring of children using SGAs. The use of HOMA-IR as a part of systematic monitoring may be helpful in the early detection of metabolic adverse effects, and further, in the identification of children in need for additional monitoring and care. More studies with larger sample sizes are needed. The results of this study, however, highlight the need for a critical estimation of the indications, risks and benefits of SGA treatment in children.
Strengths and limitations
A major strength of this study is the real-life setting of SGA prescribing and monitoring. The initiation and choice of medication was based on clinical judgement only. However, the sample size was small and there was no control group. On the other hand, the rapid development of weight gain and insulin resistance is rare in this age group. Mechanisms of SGA-induced changes in glucose metabolism are complex and partly unknown. Weight gain is an important mediator, but SGAs also seem to have direct effects on insulin metabolism [Citation12]. It is not possible to say whether the adverse changes seen in the glucose metabolism of the study patients resulted from the weight gain, medication, or both. Simultaneous psychotropic medication, overweight, developmental status, gender, ethnicity, and haemolysis of blood samples may also have affected the results, so causal relationships remain partly unresolved. Another limitation of the study was the lack of data concerning parental BMI and family dietary habits. More studies with larger samples are needed to improve the detection of underlying risk factors.
Acknowledgements
We wish to acknowledge the contribution of Professor Emerita Tuula Tamminen in the design of this study. We are also grateful to all the participating families and doctors at the TAUH child psychiatric unit.
Disclosure statement
K.K. has received a study grant from the Foundation for Pediatric Research, the Finnish Brain Foundation, and the Finnish Medical Foundation. L.P. has received honoraria from Biocodex Ltd and Takeda Ltd and has been sponsored to travel and attend a congress by Shire Ltd. R.S. owns shares of the Finnish pharmaceutical company Orion. No other conflicts of interest exist. P.K. and K.P. have no conflicts of interest.
Additional information
Funding
References
- Kalverdijk LJ, Bachmann CJ, Aagaard L, et al. A multi-national comparison of antipsychotic drug use in children and adolescents, 2005-2012. Child Adolesc Psychiatry Ment Health. 2017;11:55.
- Varimo E, Saastamoinen LK, Ratto H, et al. New users of antipsychotics among children and adolescents in 2008-2017: a nationwide register study. Front Psych. 2020;11(316).
- Correll CU, Sikich L, Reeves G, et al. Metformin add-on vs. antipsychotic switch vs. continued antipsychotic treatment plus healthy lifestyle education in overweight or obese youth with severe mental illness: results from the IMPACT trial. World Psychiatry. 2020;19(1):69–80.
- Galling B, Roldán A, Nielsen RE, et al. Type 2 diabetes mellitus in youth exposed to antipsychotics: a systematic review and meta-analysis. JAMA Psychiatry. 2016;73(3):247–259.
- Lee H, Song D, Kwon JW, et al. Assessing the risk of type 2 diabetes mellitus among children and adolescents with psychiatric disorders treated with atypical antipsychotics: a population-based nested case-control study. Eur Child Adolesc Psychiatry. 2018;27(10):1321–1334.
- Nicol GE, Yingling MD, Flavin KS, et al. Metabolic effects of antipsychotics on adiposity and insulin sensitivity in youths: a randomized clinical trial. JAMA Psychiatry. 2018;75:788–796.
- Sjo CP, Stenstrøm AD, Bojesen AB, et al. Development of metabolic syndrome in drug-naive adolescents after 12 months of second-generation antipsychotic treatment. J Child Adolesc Psychopharmacol. 2017;27:884–891.
- Chen W, Cepoiu-Martin M, Stang A, et al. Antipsychotic prescribing and safety monitoring practices in children and youth: a population-based study in Alberta, Canada. Clin Drug Investig. 2018;38(5):449–455.
- Hayden JD, Horter L, Parsons TII, et al. Metabolic monitoring rates of youth treated with second-generation antipsychotics in usual care: Results of a large US national commercial health plan. J Child Adolesc Psychopharmacol. 2020;30(2):119–122.
- Okumura Y, Usami M, Okada T, et al. Glucose and prolactin monitoring in children and adolescents initiating antipsychotic therapy. J Child Adolesc Psychopharmacol. 2018;28(7):454–462.
- Kakko K, Pihlakoski L, Keskinen P, et al. Current follow-up practices often fail to detect metabolic and neurological adverse reactions in children treated with second-generation antipsychotics. Acta Paediatr. 2020;109(2):342–348.
- Holt RI. Association between antipsychotic medication use and diabetes. Curr Diab Rep. 2019;19(10):96.
- van der Esch CC, Kloosterboer SM, van der Ende J, et al. Risk factors and pattern of weight gain in youths using antipsychotic drugs. Eur Child Adolesc Psychiatry. 2021;30(8):1263–1271.
- Nicol G, Worsham E, Haire-Joshu D, et al. Getting to more effective weight management in antipsychotic-treated youth: a survey of barriers and preferences. Child Obes. 2016;12(1):70–76.
- Bobo WV, Cooper WO, Stein CM, et al. Antipsychotics and the risk of type 2 diabetes mellitus in children and youth. JAMA Psychiatry. 2013;70(10):1067–1075.
- Ilies D, Huet A, Lacourse E, et al. Long-term metabolic effects in French-Canadian children and adolescents treated with second-generation antipsychotics in monotherapy or polytherapy: a 24-month descriptive retrospective study. Can J Psychiatry. 2017;62(12):827–836.
- Arellano-Ruiz P, Garcia-Hermoso A, Cavero-Redondo I, et al. Homeostasis model assessment cut-off points related to metabolic syndrome in children and adolescents: a systematic review and meta-analysis. Eur J Pediatr. 2019;178(12):1813–1822.
- Shashaj B, Luciano R, Contoli B, et al. Reference ranges of HOMA-IR in normal-weight and obese young caucasians. Acta Diabetol. 2016;53(2):251–260.
- Wallace TM, Levy JC, Matthews DR. Use and abuse of HOMA modeling. Diabetes Care. 2004;27(6):1487–1495.
- Tagi VM, Giannini C, Chiarelli F. Insulin resistance in children. Front Endocrinol. 2019;10(342).
- Nur Zati Iwani AK, Jalaludin MY, Wan Mohd Zin RM, et al. TG : HDL-C ratio is a good marker to identify children affected by obesity with increased cardiometabolic risk and insulin resistance. Int J Endocrinol. 2019;2019:8586167.
- Manco M, Grugni G, Di Pietro M, et al. Triglycerides-to-HDL cholesterol ratio as screening tool for impaired glucose tolerance in obese children and adolescents. Acta Diabetol. 2016;53(3):493–498.
- Di Bonito P, Valerio G, Grugni G, et al. Comparison of non-HDL-cholesterol versus triglycerides-to-HDL-cholesterol ratio in relation to cardiometabolic risk factors and preclinical organ damage in overweight/obese children: the CARITALY study. Nutr Metab Cardiovasc Dis. 2015;25(5):489–494.
- Panagiotopoulos C, Davidson J, Raghuram K. A Physician handbook for metabolic monitoring for youth with mental illness treated with second-generation antipsychotics. BC Mental Health & Addiction Services; 2010; [cited 2021 Apr 6]. Available from: http://www.bcchildrens.ca/mental-health-services-site/Documents/physicianhandbookformetabolicmonitoring.pdf
- Saari A, Sankilampi U, Hannila M, et al. New Finnish growth references for children and adolescents aged 0 to 20 years: length/height-for-age, weight-for-length/height, and body mass index-for-age . Ann Med. 2011;43(3):235–248.
- Flynn JT, Kaelber DC, Baker-Smith CM, et al. Clinical practice guideline for screening and management of high blood pressure in children and adolescents. Pediatrics. 2017;140:e20171904.
- Cook S, Weitzman M, Auinger P, et al. Prevalence of a metabolic syndrome phenotype in adolescents: findings from the third national health and nutrition examination survey, 1988. Arch Pediatr Adolesc Med. 2003;157(8):821–827.
- Owens S, Galloway R. Childhood obesity and the metabolic syndrome. Curr Atheroscler Rep. 2014;16(9):436.
- Styne DM, Arslanian SA, Connor EL, et al. Pediatric obesity-assessment, treatment, and prevention: an endocrine society clinical practice Guideline. J Clin Endocrinol Metab. 2017;102(3):709–757.
- Peplies J, Jimenez-Pavon D, Savva SC, et al. Percentiles of fasting serum insulin, glucose, HbA1c and HOMA-IR in pre-pubertal normal weight European children from the IDEFICS cohort. Int J Obes. 2014;38(S2):S39–S47.
- Melamed OC, LaChance LR, O'Neill BG, et al. Interventions to improve metabolic risk screening among children and adolescents on antipsychotic medication: a systematic review. J Child Adolesc Psychopharmacol. 2021;31(1):63–72.
- Nyboe L, Lemcke S, Moller AV, et al. Non-pharmacological interventions for preventing weight gain in patients with first episode schizophrenia or bipolar disorder: a systematic review. Psychiatry Res. 2019;281:112556.
- Pozzi M, Ferrentino RI, Scrinzi G, et al. Weight and body mass index increase in children and adolescents exposed to antipsychotic drugs in non-interventional settings: a meta-analysis and meta-regression. Eur Child Adolesc Psychiatry. 2020.
- Behiry EG, El Nady NM, AbdEl Haie OM, et al. Evaluation of TG-HDL ratio instead of HOMA ratio as insulin resistance marker in overweight and children with obesity. EMIDDT. 2019;19(5):676–682.