
 ?Mathematical formulae have been encoded as MathML and are displayed in this HTML version using MathJax in order to improve their display. Uncheck the box to turn MathJax off. This feature requires Javascript. Click on a formula to zoom.
Abstract
This paper proposes a mechanism called the mode-switching model that is presented as an alternative to the fault-valve model. This mechanism is relevant to open-flow, low-porosity, fluid-saturated systems deforming by pressure solution creep. As opposed to most constitutive models discussed in the geological literature, the yield envelope is capped at high normal stresses, as demonstrated by experimental studies. A low-permeability rock has relatively high pore fluid pressure for a given input fluid flux. This increases the dissolution rate for quartz that in turn leads to a higher-permeability rock, low fluid pressure for the same flux and decreased quartz solubility and deposition, returning to a low permeability. This cycle continues indefinitely so long as the rock mass is stressed, a fluid flux is applied, and pressure solution operates. The high fluid pressure drives the Mohr stress circle to the tensile end of the yield envelope resulting in crack-seal and extensional veins. The low fluid pressure drives the Mohr stress circle to the cap end of the yield envelope resulting in laminated veins in rocks undergoing mineral reactions with large net volume losses coupled with solute transfer. Failure at the cap end of the yield envelope results in displacement discontinuities inclined at high angles to σ1. Previously, these orientations have been taken to represent reactivated normal faults, an integral component of the fault-valve process. In the model presented, the yield surface prohibits the system ever reaching super-lithostatic pressures. The process of effective stress-driven switching between tensile and cap ends of the yield envelope arises from competition between dissolution and deposition, and is independent of any seismic events, fault reactivation or the episodic breaching of an impermeable seal. It provides a unifying, self-consistent concept for the interpretation of joints, faults and veins in hydrothermal systems.
The open-ended Mohr–Coulomb yield surface is replaced by a capped yield surface, closed at high normal stresses.
Failure can occur with decreased fluid pressures resulting in non-Andersonian orientations of failure discontinuities such as veins at high angles to σ1.
Pressure solution in open-flow hydrothermal systems leads to alternations of failure modes at the tensile and cap ends of the yield surface with no need for a seal.
Stress-driven oscillations in failure modes, resulting in episodic fluid flow and episodic formation of Andersonian and non-Andersonian failure modes, are an aseismic alternative to fault-valve behaviour.
KEY POINTS
Introduction
The fault-valve model (Sibson et al., Citation1988; Sibson, Citation2020) has become an intrinsic part of many mineral exploration models (McCuaig & Hronsky, Citation2014). Cyclical and coupled changes in stress and fluid pressure states, with associated transitory fluid flow events during seismic cycles, are referred to as fault-valve behaviour (Sibson et al., Citation1988; Sibson, Citation2020). Intrinsic to such a concept is the seismic cycle so that the whole process is driven by tectonic forcing and depends on failure defined by a failure envelope (generally assumed to be open-ended Mohr–Coulomb). The original formulation was predicated on the observation that mineralisation was associated with a steeply dipping reverse fault envisaged to be at a high angle to the maximum compressive stress, σ1 (Sibson et al., Citation1988). Since such a fault orientation is not consistent with Andersonian fault mechanics (Anderson, Citation1905, Citation1951), it was proposed that the apparent reverse fault must be a reactivated earlier normal fault. Much subsequent literature is devoted to the mechanics of fault reactivation and the pore fluid pressures needed for reactivation (Cox, Citation2010; Sibson, Citation1985) where super-lithostatic fluid pressures are postulated. In the model presented in this paper, the yield surface prohibits the system ever reaching super-lithostatic pressures.
Also intrinsic to the fault-valve model is that a periodically reactivated fault cross-cuts an ‘impermeable’ seal below which the fluid pore pressure is continuously replenished (perhaps by devolatilisation reactions of some kind) in the sealed compartment. This results in the effective stress evolving to produce episodic failure resulting in seismic events and rupture of the seal with consequent release of fluid from the compartment. It is proposed that mineralisation is associated with this release of fluid. Since the solubility of gold is insensitive to pressure (Zhong et al., Citation2015), some mechanism other than pressure drop must be responsible for gold deposition; such mechanisms might be boiling or phase separation.
In this paper, we present an alternative to the fault-valve model that has the same geometrical features and episodic behaviour as the fault-valve model but which does not require reactivation of a normal fault or rupturing of a ‘seal’ during a seismic event. This model, which we label the mode-switching model, is the natural consequence of the stressing of an open-flow, fluid-saturated porous rock mass at a temperature where the kinetics of mineral dissolution and deposition processes are significant. The model has been presented earlier (Hobbs & Ord, Citation2022), and in this paper we elaborate on some details and consequences of the model. This paper differs from Hobbs and Ord (Citation2022) in that the details of the dissolution/deposition mechanism are spelt out along with those of permeability and fluid pressure evolution.
The simple model we present consists of an open flow hydrothermal system deforming by ‘pressure solution creep’. By this, we mean the slow, steady, permanent deformation of a fluid-saturated rock by deformation-driven dissolution at grain boundaries and the transfer of the solute to another part of the system. This material may precipitate at kinetically favourable sites, which are ideally unstrained surfaces. In the model, the dissolution of material is assumed to increase the connected porosity while the precipitation of material decreases the connected porosity. Other deformation mechanisms, such as grain boundary sliding or cracking of grains, may operate, but we do not consider them specifically and assume they do not contribute to changes in connected porosity. This is clearly an oversimplification, but inclusion of these mechanisms would greatly increase the scope of this paper. As such, the paper is concerned only with elastic deformation at the microscale. Again, an extended version of the paper should include the contribution to the strain energy of the material from plastic deformation (Wintsch & Dunning, Citation1985) and the influence of chemistry upon fracturing (Laubach et al., Citation2019; Schimmel, Citation2020).
The model presented here depends on the addition of a ‘cap’ to the classical Mohr–Coulomb failure envelope. Such a cap was first proposed by Drucker et al. (Citation1957) to describe dilatant behaviour associated with strain hardening in pressure-sensitive material such as soils, rocks and concrete (see Chen & Baladi, Citation1985, for a detailed history of the subject). It was not initially designed to describe compaction deformations but has gained popularity in the geological literature through an application to compaction bands (Fossum & Fredrich, Citation2000; Holcomb et al., Citation2007; Rudnicki, Citation2004). The cap model is applicable to the deformation of any material that changes volume during deformation (Collins & Kelly, Citation2002). The mechanisms of volume change may be quite varied including pore collapse, crushing of grains, volume increase owing to dilatant deformation, brecciation and mineral reactions involving both positive and negative ΔV. The concept is not restricted to brittle deformations.
We begin with a discussion of capped yield envelopes and their relevance to the non-Andersonian orientation of some deformation discontinuities, to the influence of σ2 on these orientations and to the nature of vein formation, particularly laminated veins. We then consider the dissolution deposition cycle and details of the mode-switching model. Finally, discussion leads to a conclusion that the capped yield envelope concept, coupled to pressure solution creep, provides a unifying self-consistent approach for cyclic yielding and fluid flow, and for the kinematics of brittle rocks undergoing solution creep.
Mechanical behaviour with a capped yield surface
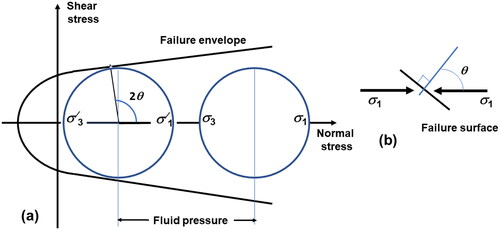
One classical and rigorous way of representing yield (for example, Bons et al., Citation2012) is shown in in Mohr-space (shear stress vs normal stress). A variety of different vein structures can form in this way (Bons et al., Citation2012) including crack-seal structures in particular (Späth et al., Citation2022). Failure occurs when the Mohr circle for stress touches the failure envelope. This can occur if the pore fluid pressure is increased. If failure occurs, then the angle between the normal to the failure plane and σ1 is θ as shown in . It follows from the geometry of the yield envelope that θ is greater than 45°. If the stress difference (σ1–σ3) is small, then failure occurs at the far left-hand side of the failure envelope, and a ‘tension’ fracture occurs parallel to σ1. This overall geometry results in Andersonian fracture/vein systems where (Anderson, Citation1905, Citation1951).
Figure 1. Open-ended failure envelope. (a) Open-ended failure envelope in Mohr stress space. Failure can occur by increasing the pore fluid pressure on discontinuities with a normal inclined at θ to σ1 as shown in (b). and
are effective stresses (that is,
±Pfluid,
±Pfluid).
However, this classical view of the yield envelope assumes that the material can support infinite normal and shear stresses. For materials that can undergo a volume change, the failure envelope is capped as shown in . Experiments and discussions to support such a cap include Aydin et al. (Citation2006), Collins and Kelly (Citation2002), Dimaggio and Sandler (Citation1971), Fossum et al. (Citation1995), Fossum and Fredrich (Citation2000), Holcomb et al. (Citation2007), Lubarda et al. (Citation1996), Ma (Citation2014 and references therein), Oka et al. (Citation2011), Rudnicki (Citation2004), Saksala (Citation2010), Sheldon et al. (Citation2006), Wong et al. (Citation1997) and Wong and Baud (Citation2012) . Now the cap part of the yield envelope can be accessed by a decrease in pore fluid pressure where the failure plane normal forms at to σ1 (). We emphasise that the cap concept has been developed and experimentally verified for low-porosity rocks such as fractured granites (Ma, Citation2014; Ma et al., Citation2021) and shales (Oka et al., Citation2011) and is not solely intended to represent the compaction of high-porosity, brittle sedimentary rocks. Oka et al. (Citation2011) point out that there are at least two mechanisms of compaction: one involves collapse of porosity, and the other involves the crushing of grains. Alevizos et al. (Citation2017) have indicated yet another mechanism, namely collapse/expansion arising from mineral reactions with negative or positive ΔV (). Mineral reactions can also influence the slope of the yield envelope and its position (). Formally, following the thermodynamic treatment of Chen and Baladi (Citation1985) and Collins and Kelly (Citation2002), the cap model is applicable to any material (brittle, plastic or viscous) that changes its volume (positive or negative) during deformation and so is ideally suited for describing the behaviour of hydrothermal and metamorphic rocks undergoing mineral reactions synchronous with deformation that involve volume changes. The cap model is just as applicable to a Mohr–Coulomb material undergoing compaction as it is to a pyroxenite undergoing dislocation creep and converting to chlorite.
Figure 2. Yield envelope with a cap. (a) Failure envelope closed at high normal stresses by a cap. Failure can occur by decreasing the pore fluid pressure. In this example, failure occurs on planes normal to (b) General case. Failure occurs at the tensile end of the yield envelope for
Failure occurs at the cap end of the yield envelope for
These failure discontinuities have non-Andersonian orientations and are commonly interpreted as reactivated normal faults. (c) and (d) Representation of mineral reactions and other processes that result in volume change. (c) Expansion and contraction of the cap with positive and negative dilation or ΔV and hardening/softening behaviour. (d) Changes in friction angle, cohesion and tensile strength with hardening and softening processes.
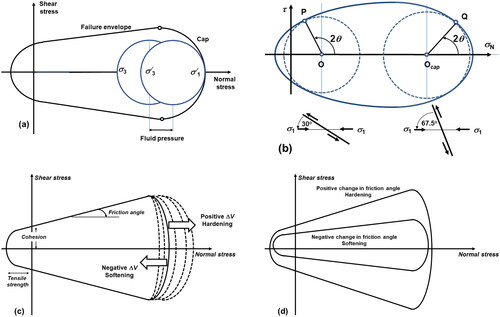
Yield can also be represented by drawing the yield surface in invariant p–q space (), where p is the mean stress, , and q is the von Mises stress,
, where
,
, and sij is the deviatoric stress. I1 is the first stress invariant, and J2 is the second deviatoric stress invariant (see Hill, Citation1950, p. 301; Houlsby & Puzrin, Citation2006, chapter 10). We have the transformation to Mohr space (Hill, Citation1950, p. 135):
Figure 3. Failure represented in invariant p–q space. (a) Yield envelope showing regions where different plastic failure modes occur. (b) The influence of σ2 on yield. The biaxial loading path has initial values of so that
The triaxial loading path has initial values of
with
so that
is the incremental strain-rate vector, which has been drawn normal to the yield surface for the two loading paths.
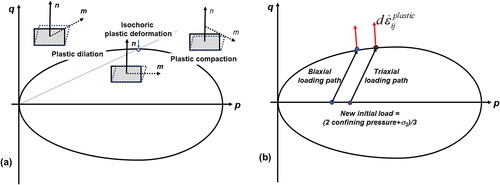
shows the various modes of failure in invariant space.
Representations in invariant space are commonly used in soil mechanics (Houlsby & Puzrin, Citation2006, chapter 10) but can readily be applied to both the rate-independent and rate-dependent deformation of solids. They are useful in representing the influence of loading path and of σ2 on yield; such an influence is not possible in a Mohr representation. In , two loading paths are shown with the same values of (σ1–σ3) initially, but different values of σ2 and hence different values of p initially. The two loading paths produce different points of yield on the yield envelope and hence different values of p and q at yield. In this case, the triaxial path results in higher strength than biaxial loading as reported in the literature (see Blenkinsop, Citation2023). With the configuration shown in , the orientations of the incremental strain-rate vectors are similar at each yield point, and so the orientations of failure discontinuities are similar, but not identical, for different values of σ2. It is conceivable that initial loading states could be selected to produce different orientations of the incremental strain-rate vectors. These would be especially so for high values of (σ1–σ3) and large differences in σ2. These details cannot be represented in Mohr space but need consideration in any discussion of deformation discontinuity orientations.
A cap model has been applied to consider the brittle–ductile transition (Lubarda et al., Citation1996; Wong et al., Citation1997; Wong & Baud, Citation2012) so that, at temperatures corresponding to the brittle–ductile transition, the tensile end of the yield envelope may represent brittle deformation, while the cap end may represent ductile–rate-sensitive deformation. Such a representation is useful in discussing plastic hardening for both brittle and rate sensitive materials and for interpretations of fabrics where both brittle and viscous deformation mechanisms are identified (Wintsch & Yeh, Citation2013).
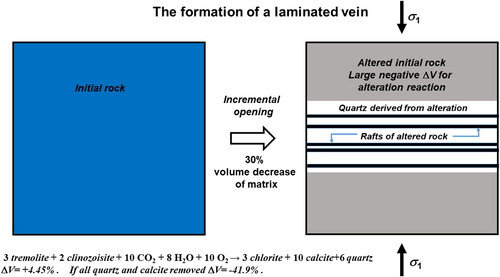
A cap model for yield is particularly important in discussing various types of failure discontinuities. Failure at the tensile end of the failure envelope is well discussed by Bons et al. (Citation2012). Failure modes at the cap end are commonly considered as compaction bands (Elphick et al., Citation2021; Fossen et al., Citation2007; Holcomb et al., Citation2007; Issen & Rudnicki, Citation2000; Olsson, Citation1999). However, Alevizos et al. (Citation2017) Regenauer-Lieb et al. (Citation2016) and Veveakis and Regenauer-Lieb (Citation2015) have extended the discussion to consider yielding at the cap when the fluid flow rate competes in magnitude with strain rate, and mineral reactions are accompanied by volume changes. For certain combinations of permeability, fluid flow rate and strain rate, compaction bands, discrete discontinuities (barren joints) and opening-mode veins can form. These discontinuities have non-Andersonian orientations with respect to the orientation of (). If the rock has high porosity and lacks fluid flow, then compaction bands form (, left panel). If the rock has low permeability and is fluid-saturated, but no mineral reactions occur that result in volume change, and the fluid flow rate is less than the strain rate, then sharp discontinuities (barren joints) form (, middle panel). If the rock has low permeability and is fluid-saturated, but mineral reactions occur that result in net volume decreases, and the fluid flow rate is greater than the strain rate, then laminated veins form (, right panel). These laminated veins are common in mineral deposits and commonly host high grades of gold. They invariably have internal, highly altered rafts of country rock, testimony to incremental opening, and stylolites and solution seams parallel to their boundaries, testimony to forming at a high angle to
Examples are given by Hobbs and Ord (Citation2022, and references therein). A model for the incremental opening of a laminated vein normal to
is shown in .
Figure 4. Different kinds of fracture at the cap end of the failure envelope. Left panel: failure in a porous material with no fluid. The discontinuities are compaction bands. Inset: compaction bands from Whakataki Formation, North Island, NZ (Regenauer-Lieb et al., Citation2021). Middle panel: failure in a low connected porosity material with no chemical reactions and fluid flow rate less than the strain rate. Inset: joint systems with pressure solution on one set. Ormiston Gorge, Central Australia. Right panel: failure in a low connected porosity material with chemical reactions and fluid flow rate greater than the strain rate. Inset: laminated vein with stylolites parallel to laminations. Bendigo, Australia (from Chace, Citation1949).
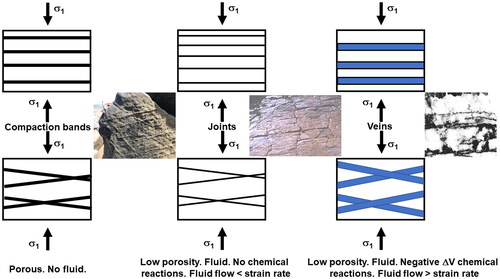
Figure 5. Model for the incremental opening of a laminated vein approximately normal to Left is the initial undeformed rock composed in this example of tremolite and clinozoisite; the rock mass is subjected to an influx of CO2, H2O and O2. Mineral reaction occurs during deformation producing chlorite, calcite and quartz and an associated volume increase of +4.45%. The mineral reaction proceeds incrementally governed by the rate of supply of fluids and in conjunction with deformation and solution transfer, which removes some or all the SiO2 and CaCO3. These dissolved materials deposit in an opening-mode vein forming at a high angle to
and to accommodate the volume change. The total potential volume decrease in the host material owing to solute transfer is 42%.
Mode switching model
Dissolution-deposition process
We first consider the dissolution-deposition process for unstressed quartz. The dissolution of unstressed quartz in the adjacent fluid (taken as pure water) is expressed as
(1)
(1)
where k+ is the dissolution rate constant. Also, the chemical potential of unstressed
dissolved in the fluid,
is
(2)
(2)
where
is the Helmholtz energy of unstressed
is the specific volume of unstressed
dissolved in the fluid, and
is the fluid pore pressure. As usual, the term specific refers to quantities per unit mass; in EquationEquation 2
(2)
(2) , the units of
are [m2 s−2] or [Joules kg−1], as are those of
and
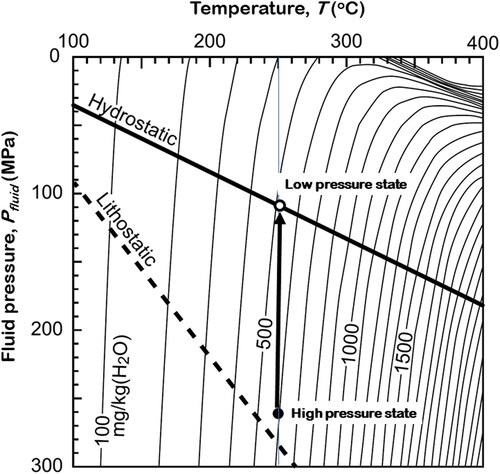
The driving force for the dissolution process is the local energy of the unstressed quartz expressed as the specific Helmholtz energy density, , and Pfluid defines the equilibrium solubility of quartz at a given temperature (). In the unstrained state, the specific Helmholtz energy is written (Houlsby & Puzrin, Citation2006, p. 43) as
(3)
(3)
where u0 is the specific internal energy, T is the temperature, and s0 is the specific entropy.
Figure 6. Equilibrium solubility of quartz in water (modified after Saishu et al., Citation2017). The hydrostatic and lithostatic lines are based on a geothermal gradient of 20 °C km−1 and a mean rock density of 2700 kg m−3. The indicated fluid pressure drop from the high to low pressure at 250 °C results in a potential quartz deposition equivalent to nearly 100 mg kg−1 of fluid.
From EquationEquation 1(1)
(1) , we have the rate of dissolution of SiO2 as:
(4)
(4)
and therefore
(5)
(5)
where
is the fugacity coefficient for H2O at pressure
, and
is the fugacity coefficient at a reference pressure
[SiO2] is taken as the activity of quartz in solution at constant T and
Thus, the rate of dissolution of quartz is proportional to the square of the fluid pressure at constant T and
The deposition of quartz from the fluid is expressed as
(6)
(6)
so that
(7)
(7)
The equilibrium concentration of Si(OH)4 in solution is a nonlinear function of Pfluid and of T as shown in , but over a restricted range of Pfluid (between hydrostatic and lithostatic) at constant T, the variation of this concentration is approximately a linear function of Pfluid. We write, for isothermal conditions,
(8)
(8)
where α is a proportionality constant. Thus, over the restricted range we are interested in, the deposition rate for quartz is linearly dependent on the fluid pressure.
We now turn to the dissolution-deposition process for stressed quartz. The process known as pressure solution consists of dissolution of material at places where the Helmholtz energy arising from strain is high and transfer of that material into a nearby fluid where it may be transported by advection and/or diffusion in the fluid. The thermodynamics of the process was first discussed by Gibbs (Citation1876) and elaborated upon by Cahn (Citation1980, Citation1989), Kamb (Citation1961) and Sekerka and Cahn (Citation2004).
The precise process of dissolution of a stressed solid in an adjacent fluid is described in Gibbs (Citation1961, p. 196) and reiterated by Cahn (Citation1989). We denote the energy of N moles of the stressed solid by E (Joules), their entropy by S (Joules K−1), the volume by V and the temperature by T. Then, following Gibbs (Citation1961, equation 388),
(9)
(9)
where µ (Joules per mole) is the chemical potential of the solid dissolved in the fluid.
When these N moles of the stressed solid are removed from the solid and dissolved in the fluid at constant entropy and volume, E is the energy loss of the solid, and is the energy gain of the fluid. The entropy of the piece composed of N moles is added to the fluid, and TS is the gain in heat by the fluidFootnote1. In a closed unstressed system, the process described by EquationEquation 1
(1)
(1) reaches equilibrium, and the fluid, at equilibrium, is saturated at the equilibrium solubility of
shown as a function of Pfluid and T in . In a stressed system, equilibrium is never attained as long as the stress is applied, and the fluid continues to be supersaturated until deposition of unstrained solid on suitable surfaces occurs or, in open systems, the dissolved material is removed from the system and deposited on suitable surfaces.
In the strained state, EquationEquation 1(1)
(1) still holds, but EquationEquation 2
(2)
(2) is replaced by an identical equation in form (Gibbs, Citation1961, equation 396; Kamb, Citation1961, Equationequation 1
(1)
(1) ) namely,
(10)
(10)
where
is the chemical potential of stressed
dissolved in the fluid,
is the Helmholtz energy of stressed
is the specific volume of strained
, and
remains as the fluid pressure for both the strained and unstrained states. Gibbs pointed out that the solution becomes supersaturated and, given the opportunity, precipitates on some other kinetically favourable surface (Frolov & Mishin, Citation2010). The process of transport of material from strained sites to deposition sites is known as solute transfer.
It is fundamental to note that EquationEquation 10(10)
(10) is commonly written
where
is the normal stress on a fluid/solid interface in one dimension. This is algebraically correct in one dimension where
but is not applicable to a general state of stress in three dimensions where EquationEquation 10
(10)
(10) is the correct expression. Exchanging
for
obscures the true physics behind the dissolution of a stressed solid, a process driven by the increased energy of the stressed solid, not solely by the normal stress on an interface, which is one component of the total stress on the solid. The fluid pressure defines the equilibrium solubility of quartz, which is the same for stressed and unstressed quartz. It plays no other role. At no stage ever do Gibbs or Kamb use or imply the expression
As Gibbs (Citation1961, pp. 196–197) pointed out, the dissolution process for stressed solid is a non-equilibrium process, since the solution in EquationEquation 10(10)
(10) is supersaturated with respect to Si(OH)4. The dissolved silica will deposit on any site that is kinetically favourable. The kinetics of the deposition process is considered by Ganor et al. (Citation2005) and given as
(11)
(11)
where
is the Gibbs energy for the reaction (6), and R is the gas constant. The quartz that is deposited is initially strain-free.
There have been various attempts to derive a constitutive law for materials undergoing deformation by pressure solution (see Gratier et al., Citation2013, table 2.3 for many examples) assuming various geometrical and physical models for the process, but independently of the precise physics, dimensional analysis suggests that such a constitutive law for three-dimensional small elastic strains, is of the form:
or,
(12)
(12)
Here, is a scalar expression of the strain rate,
where
is the deformation rate. We have written the Helmholtz energy density as the scalar product of stress and strain. Expressions in terms of the elastic moduli for general stress and strain states are given by Houlsby and Puzrin (Citation2006, p. 78). We have also used
instead of simply k+, as is the usual assumption in the literature, since it is the rate of dissolution of quartz that is important in influencing the strain rate and not just the reaction rate. EquationEquation 12
(12)
(12) is of the same form as derived by Paterson (Citation1995), Rutter (Citation1976), Shimizu (Citation1997, Citation1995) and others (Gratier et al., Citation2013, table 2.3), except that those authors assumed that only a uniaxial stress contributes to the energy driving dissolution and not the total Helmholtz energy. The distinction is important, since neglecting the strain dependence introduces an error of order ≈10−3, the maximum value of the elastic strain. Dependence on grainsize and grain boundary structure is included in the dimensionless geometrical factor, A. Elaborations on this part of this model have been made by Menzel et al. (Citation2022), Paterson (Citation1995) and van den Ende et al. (Citation2019). However, if the stress depends on grainsize or shape, then an exponential dependence of strain rate on stress can be introduced (Gratier et al., Citation2013). The elastic bulk modulus, G, is included to ensure the equation is dimensionally correct; neglect of a factor such as G introduces an error ≈1011 and makes the constitutive relation dimensionally incorrect (common published versions of EquationEquation 12
(12)
(12) write an expression such as
where
is the molar volume and R is the gas constant, to ensure the correct dimensions; see Gratier et al., Citation2013, table 2.3). EquationEquation 12
(12)
(12) , in the absence of a grainsize/shape stress dependence, predicts a linear dependence of strain rate on stress and upon the dissolution rate, as do Paterson, Shimizu and many other models. The introduction into EquationEquation 12
(12)
(12) of a dependence of A, ψ and k on time arising from the evolution in grain geometry, stress and/or dissolution mechanisms introduces the possibility of EquationEquation 12
(12)
(12) being nonlinear in time as discussed by Gratier et al. (Citation2013, section 3.4.4). Another modification, not considered in common discussions of pressure solution, is the possibility that k+ depends on stress through a stress dependence of the activation enthalpy for dissolution, as is common in most stressed chemical reactions (Zhurkov, Citation1984). This introduces a nonlinear dependence of strain rate on stress through EquationEquation 12
(12)
(12) but does not alter the pressure dependence of dissolution. This does, however, mean that the dissolution rate is favoured by high stresses, which intensify the dissolution rate at low fluid pressures.
Thus, for a constant strain rate, the stress is inversely proportional to the dissolution reaction rate, which in turn is a function of the square of the fluid pressure, pH, fluid chemical composition and temperature (Dove & Rimstidt, Citation1994; Fournier & Potter, Citation1982; Manning, Citation1994). Here we consider only the dependence on fluid pressure. The dependence of dissolution rate on fluid pressure arises from expressions such as EquationEquation 5(5)
(5) above, where the dissolution rate for quartz is proportional to the square of Pfluid. A decrease in fluid pressure results in a decreased solubility of quartz and so precipitation of quartz () leading to decreased permeability. Importantly, decreased pressure also results in a decreased dissolution rate that, through EquationEquations 5
(5)
(5) and Equation12
(12)
(12) , results in an increase in stress. The decrease in fluid pressure drives the Mohr circle to the cap end of the failure envelope, and this, coupled with high stress, results in failure at the cap. The inverse is also true so that an increase in fluid pressure results in increased solubility and hence increased permeability. An example of increased permeability from pressure solution is given by Schenk and Urai (Citation2004). Increases in fluid pressure also lead to a decrease in the stress. The coupling between decreased stress and increased fluid pressure leads to a (decreased
increased) fluid pressure cycle as captured in .
Figure 7. Mode-switching cycle. Starting with a rock of low permeability, an imposed fluid flux results in relatively high fluid pressure (EquationEquation 13(13)
(13) ). This results in high rates of quartz solubility (EquationEquation 5
(5)
(5) ) leading to dissolution and higher permeability. This increase in permeability for the same fluid flux leads to low fluid pressure, decreased solubility and deposition, and the cycle repeats. In the high-fluid-pressure part of the cycle, the Mohr stress circle is moved to the tensile end of the yield envelope and the incremental opening of crack seal veins. In the low-fluid-pressure part of the cycle, the Mohr stress circle is moved to the cap end of the yield envelope and the incremental opening of laminated veins.
![Figure 7. Mode-switching cycle. Starting with a rock of low permeability, an imposed fluid flux results in relatively high fluid pressure (EquationEquation 13(13) ∇P2fluid=K1K2∇P1fluid+ρfluidg(1−K1K2)(13) ). This results in high rates of quartz solubility (EquationEquation 5(5) ∂[SiO2]∂t=−k+[SiO2](γH2OPH2Oγ0H2OP0H2O)2(5) ) leading to dissolution and higher permeability. This increase in permeability for the same fluid flux leads to low fluid pressure, decreased solubility and deposition, and the cycle repeats. In the high-fluid-pressure part of the cycle, the Mohr stress circle is moved to the tensile end of the yield envelope and the incremental opening of crack seal veins. In the low-fluid-pressure part of the cycle, the Mohr stress circle is moved to the cap end of the yield envelope and the incremental opening of laminated veins.](/cms/asset/cdd4817b-eaea-4f4a-b9b6-2cb39d7969be/taje_a_2218452_f0007_c.jpg)
Details of the mode switching model
Mode-switching behaviour arises naturally in a stressed, open-flow, fluid-saturated porous rock mass at a temperature and pressure where the kinetics of stress-induced mineral dissolution and deposition processes are favoured. The rock mass automatically oscillates between a low-stress–high-fluid-pressure, low-permeability state and a high-stress–low-fluid-pressure, high-permeability state controlled by competition between dissolution and precipitation. This results in oscillations between crack-seal veins forming at the tensile end and laminated veins forming at the cap end of the yield surface. In a rock mass with a relatively impermeable but strong layer, cyclical and coupled changes in stress and fluid pressure states, with associated transitory fluid flow events, occur as in the fault-valve model but for a completely different reason.
The mode-switching behaviour depends, fundamentally, on Darcy’s law applied to a material with fixed fluid flux and changes in permeability between K1 and K2 (see Zhao et al., Citation2008, pp. 10–15):
(13)
(13)
where
are the fluid pressure gradients associated with permeabilities K1 and K2, ρfluid is the density of the fluid, and g is the acceleration owing to gravity. Hence, if K1 = 0.1K2, then
Thus, if
is lithostatic (1.7 × 10⁴ Pa m−1), then
is 1.07 × 10⁴ Pa m−1, which is just above a hydrostatic gradient (104 Pa m−1). Here, we assume ρrock = 2700 kg m−3 and g = 10 m s−2. The mode-switching cycle consists of the following ():
Low-permeability rocks subjected to a fluid flux,
and with permeability, K1, have a fluid pressure gradient,
If this permeability changes to K2 by pressure solution, then the fluid pressure gradient is changed to
shows the results of applying EquationEquation 13(13)
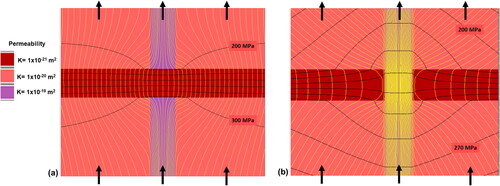
(13) along with the cycle shown in . A stressed cube of rock with permeability 10−19 m2 has a horizontal layer of permeability 10−20 m2 and a vertical fault of permeability 10−18 m2. A vertical fluid flux is imposed at the base of the model, and the same flux leaves the top of the model. This flux is proposed to arise from devolatilisation reactions in the lower crust or mantle according to the process outlined by Phillips (Citation1991, pp. 135–139). In , the low-permeability layer is cemented and cross-cuts the high permeability fault. The resulting streamline and fluid pressure distributions are shown in .
Figure 8. Model with two layers and a vertical high-permeability fault. A constant fluid flux is applied at the base, and the same flux leaves the top of the model. Black contours are for the resulting fluid pressure; yellow lines are streamlines. The permeabilities of various parts of the model are indicated in the legend. The low-permeability layer is stronger than other units. Calculated using the finite difference code FLAC (Itasca Consulting Group, Inc, Citation2008). Contour interval in (a) model: 2 × 10⁷ Pa. Contour interval in (b) model: 1 × 10⁷ Pa.
Continuity of mass demands that the streamlines are continuous across the model independently of any permeability changes. At each point, the fluid flux (with units m3 m−2 s−1) is equal to the imposed fluid flux, The fluid particle velocity (with units m−2 s−1) at each point, v, is
, where
is the connected porosity. If we take the permeability to be related to the porosity by the Carman–Kozeny relation (Hobbs & Ord, Citation2015, p. 385), then K is proportional to
For small porosities, K is close to proportional to
This means that an increase in permeability of 100 is equivalent to an increase in connected porosity of 4.64, and hence the fluid velocity decreases by 4.64 in passing from the permeable fault channel to the lower-permeability layer in , although the fluid flux remains the same in each.
Zhao et al. (Citation2008, section 2.2) point out that in a layered system with imposed fluid flux, the lowest-permeability layer in the system acts as a valve, which controls fluid flow and fluid pressure gradients throughout the system. In , the horizontal layer acts as this valve. In , the layer truncates the vertical fault channel, and the pressure gradient within that layer is homogeneous in space. The fluid pressure contours bend outside the layer owing to the defocussing and focussing effects of the vertical channel. Once the layer is breached by dissolution, as in , the fluid pressure gradient within the low-permeability layer becomes inhomogeneous, since the fluid pressure contours must be continuous from one region to another. The fluid pressure gradient within the channel, from EquationEquation 13(13)
(13) , is now 100 times less than that initially in the low-permeability layer. This means the fluid pressure is lower below the layer and the mid-point of the breach, and is higher above the layer and above the mid-point of the breach. Thus, the rate of dissolution is higher above the layer than below the layer, and the situation above the layer favours failure at the tensile end of the yield envelope, whereas that below the layer favours failure at the cap end of the yield envelope. The fluid pressure evolution modelled in is independent of scale.
It should be noted that the imposed stress does not change during these switching events. It is the effective stress that oscillates. Also note that the fluid pressure oscillations have a magnitude of the order of 100 Mpa. This is less than the fluid pressure changes proposed, for example, for pressure evolution in the failure mode models given in Cox (Citation2010, figure 4) drawn for a depth of 10 km.
Discussion
A summary of the dissolution/mineral reaction/transport process is presented in . The fault-valve model depends on the episodic reactivation of steep faults at a high angle to a horizontal This (Sibson et al., Citation1988) requires the episodic generation of super-lithostatic fluid pressures. Such pressures are generated below an impermeable seal by some form of metamorphic devolatilisation presumably by a process similar to that of Phillips (Citation1991, pp. 135–139). These pressures are increased apparently without inducing a fluid pressure gradient, which would otherwise lead to upward flow and hence continuity problems at the impermeable seal. Note though that the Phillips process produces super-hydrostatic fluid pressure gradients (and hence upward flow) from the start of devolatilisation. Once lithostatic fluid pressures are achieved, the seal is ruptured (resulting in seismic behaviour), and fluids are released into the lower-pressured region above the seal. Decompression then results in boiling or phase separation with resulting gold deposition. The details of the relations between a yield surface and continuity relations for fluids across the impermeable seal are not spelt out; in other words, the magnitude of the fluid pressure is not constrained by a yield envelope, and details of changes in the fluid pressure gradient and the effects of such changes are not specified. This last point is important, since modelling of the fault-valve process by Sheldon and Ord (Citation2005) indicates that breaching of the ‘seal’ can result in unexpected changes in the pattern of fluid flow.
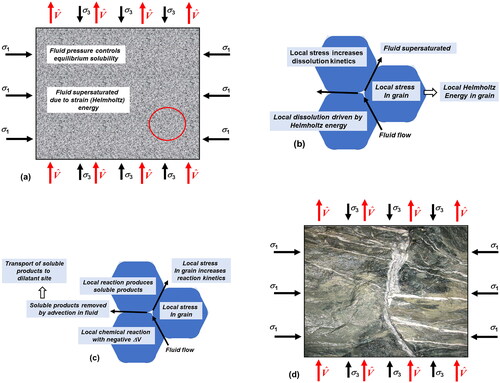
Figure 9. Summary of dissolution/mineral reaction/transport process. (a) Material subjected to a stress state, σij and a Darcy fluid flux, imposed at the base with an outward flux at the top. The fluid pressure, which controls the equilibrium solubility of the solute, is defined by the imposed flux and the local permeability. (b) Details of circled area in red of (a). Stress concentrations arise at grain contacts. This results in increased Helmholtz energy at contacts, which drives dissolution. The stress concentrations also increase the rate of dissolution through the influence of the work done by the stress on the enthalpy for dissolution. (c) Details of circled area in red of (a). Simultaneously with dissolution, mineral reactions are preferred at sites of increased stress owing to changes in the enthalpy of the reaction. These reactions, for hydrothermal alteration, generally have a negative ΔV. (d) Soluble products from dissolution and mineral reactions are transported to adjacent dilatant site resulting in vein formation. These may be extensional veins (approximately parallel to σ1) if the effective stress touches the tensile end of the yield surface or laminated veins with stylolites and solution seams (approximately normal to σ1) if the effective stress touches the cap end of the yield surface. These veins accommodate the volume change arising from the negative ΔV of reaction. (d) Supplied by Tom Blenkinsop.
We have proposed a model, similar in overall behaviour to the fault-valve model, but which is self-consistent with respect to coupled mechanical/fluid pressure behaviour. This proposed model depends on the yield envelope being capped (as supported by experimental work) with stress-driven dissolution deposition processes leading to alternations of failure at the tensile and capped ends of the yield envelope. The fluid pressure is constrained by the yield envelope never to reach super-lithostatic values, since yield is reached long before lithostatic values are attained. No impermeable layer is necessary, and no relationship to seismicity is directly implied but is not excluded. As shown in , a relatively low-permeability layer can be breached by this process, and there is an associated fluid pressure drop, but there is always continuity of fluid pressure and of fluid flux across the low-permeability layer during the dissolution
deposition cycle. Such continuity is demanded by the law of conservation of mass.
In this mode-switching model, the steep-dipping fault in the fault-valve model () is interpreted as a failure discontinuity at the cap end of the yield envelope. As such, it is associated with laminated veins forming at a high angle to This relationship to the deforming stresses is consistent with observed formation of boudins in the veins. There is no need to postulate that these features are associated with reactivation of an earlier normal fault. The differential stress at this stage is relatively high because of the dependence of the silica dissolution rate in Equationequation 12
(12)
(12) on the square of the fluid pressure in Equationequation 5
(5)
(5) . The crack-seal veins form near parallel to
at another stage of the dissolution
deposition cycle when the fluid pore pressure is high, the effective differential stress is low, and failure occurs at the tensile end of the yield envelope. This relationship to the deforming stresses is consistent with observed buckling of the crack-seal veins.
Figure 10. Interpretation of the Sibson (Citation2020) model of Val d’Or geometry in terms of a mode-switching model. Adapted from Sibson (Citation2020).
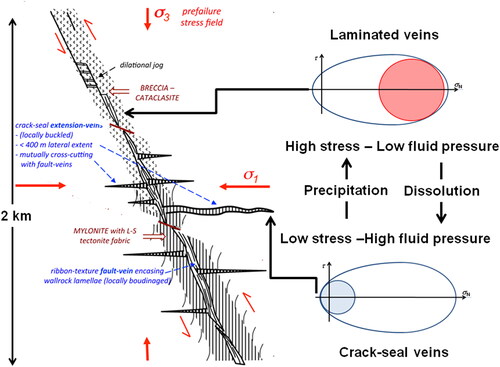
A complete description of the dynamics of the dissolution deposition cycle requires consideration of the coupled mass and energy budgets of the system. In particular, coupling to the temperature changes that accompany the process needs to be considered. Some aspects of such coupling are in Hobbs and Ord (Citation2018), Ord and Hobbs (2018) and Poulet et al. (Citation2014). The dissolution of quartz is endothermic, and the deposition is exothermic, as are the deformation and the mineral reactions that lead to negative ΔV and laminated vein formation. These endothermic
exothermic processes compete and lead to fluctuations in fluid pressure, so they play important roles in the dynamics of the overall process. In addition, reactions such as that depicted in absorb fluids and so compete with the supply of fluid for the pressure solution/transfer processes. Poulet et al. (Citation2014) discuss the relation of such coupled processes to the slow earthquake cycle, and so there is probably a link to seismicity and aseismic slip through such coupling processes.
We hope that this paper will stimulate detailed studies on structures such as shown in . Detailed analysis of vein geometries, microstructures and history coupled with an understanding of the volume changes occurring during hydrothermal alteration will enable the model proposed here to be tested and modified if necessary.
Conclusions
We have discussed the implications of adding a cap to the yield envelope for fluid-saturated rocks where dissolution creep is active. The addition of a cap, supported by experimental work, ensures that the deforming rock can only support finite shear and normal stresses. Failure at the cap results in compaction bands for high-porosity rocks but results in opening-mode discontinuities forming at high angles to compression in low-permeability rocks with synchronous mineral reactions involving a net negative volume change. These opening-mode structures appear as laminated veins with vein parallel stylolites and solution seams in contrast to opening-mode veins that form normal to stylolites at the tensile end of the yield envelope. Failure at the cap in fluid-saturated low-permeability rocks results in shear discontinuities at high angles to compression, commonly interpreted as reactivated normal faults in the fault-valve model. Consideration of failure modes at the cap end of the yield envelope makes such an interpretation unnecessary.
Details of the pressure solution creep process are outlined, pointing out that the process depends not only on the Helmholtz energy of the stressed solid but also on the rate of dissolution of SiO2. This dissolution rate depends on the square of the fluid pressure. Hence in a fluid-saturated, stressed solid with an imposed fluid flux, the rate of dissolution depends on any fluctuations in fluid pressure, which in turn are produced by changes in permeability. Changes in permeability are induced by changes in the dissolution rate. Hence a cycle is set up whereby the rock mass automatically oscillates between a low-stress–high-fluid-pressure, low-permeability state and a high-stress–low-fluid-pressure, high-permeability state controlled by competition between dissolution and precipitation. This process is labelled mode switching and is an alternative to the fault-valve process. The mode-switching cycle involves switching between reverse slip on discontinuities in orientations that are non-Andersonian at high angles to compression and the operation of opening-mode discontinuities at a low angle to compression. Mode switching does not depend on fluids breaching a permeability ‘seal’ and is intrinsically aseismic.
The capped yield envelope concept, coupled to pressure solution creep, provides a unifying self-consistent approach for cyclic yielding and fluid flow, and for the kinematics of brittle rocks undergoing solution creep. It is also a fundamental concept for describing the deformation of hydrothermal and metamorphic rocks undergoing synchronous volume changes such as dilational deformation and/or mineral reactions with positive or negative ΔV.
Acknowledgements
The authors thank Thomas Poulet for discussions on the influence of σ2 on yield. Bob Wintsch and Janos Urai supplied constructive reviews that greatly improved the paper. Janos Urai died in a climbing accident in Belgium on 28 May 2023. This makes his review of this paper particularly important. We would like to thank Janos for his friendship over many years and his magnificent contributions to structural geology.
Disclosure statement
No potential conflict of interest was reported by the authors.
Data availability statement
Data sharing is not applicable to this article, as no new data were created or analysed in this study.
Notes
1 The system is commonly considered to be immersed in a bath where the gain in heat is dissipated. In a hydrothermal system where the rates of processes are relatively fast, this heat may contribute to a temperature, and hence pressure, increase in the fluid (see Ord & Hobbs, Citation2018).
References
- Alevizos, S., Poulet, T., Sari, M., Lesueur, M., Regenauer-Lieb, K., & Veveakis, M. (2017). A framework for fracture network formation in overpressurized impermeable shale: Deformability vs diagenesis. Rock Mechanics and Rock Engineering, 50(3), 689–703. https://doi.org/10.1007/s00603-016-0996-y
- Anderson, E. M. (1905). The dynamics of faulting. Transactions of the Edinburgh Geological Society, 8(3), 387–402. https://doi.org/10.1144/transed.8.3.387
- Anderson, E. M. (1951). The dynamics of faulting. Oliver and Boyd.
- Aydin, A., Borja, R. I., & Eichhubl, P. (2006). Geological and mathematical framework for failure modes in granular rock. Journal of Structural Geology, 28(1), 83–98. https://doi.org/10.1016/j.jsg.2005.07.008
- Blenkinsop, T. (2023). Failure modes in hydrothermal ore systems. Australian Journal of Earth Sciences, 70(7), 947–957. https://doi.org/10.1016/j.jsg.2012.07.005
- Bons, P. D., Elburg, M. A., & Gomez-Rivas, E. (2012). A review of the formation of tectonic veins and their microstructures. Journal of Structural Geology, 43, 33–62. https://doi.org/10.1016/j.jsg.2012.07.005
- Cahn, J. W. (1980). Surface stress and the chemical equilibrium of small crystals: I. The case of the isotropic surface. Acta Metallurgica, 28(10), 1333–1338. https://doi.org/10.1016/0001-6160(80)90002-4
- Cahn, J. W. (1989). The physical chemistry of stressed solids. Berichte Der Bunsengesellschaft Für Physikalische Chemie, 93(11), 1169–1173. https://doi.org/10.1002/bbpc.19890931105
- Chace, F. M. (1949). Origin of the Bendigo saddle reefs with comments on the formation of ribbon quartz. Economic Geology, 44(7), 561–597. https://doi.org/10.2113/gsecongeo.44.7.561
- Chen, W. F., & Baladi, G. Y. (1985). Soil plasticity. Elsevier.
- Collins, I. F., & Kelly, P. A. (2002). A thermomechanical analysis of a family of soil models. Géotechnique, 52(7), 507–518. https://doi.org/10.1680/geot.2002.52.7.507
- Cox, S. F. (2010). The application of failure mode diagrams for exploring the roles of fluid pressure and stress states in controlling styles of fracture-controlled permeability enhancement in faults and shear zones. Geofluids, 10, 217–233. https://doi.org/10.1111/j.1468-8123.2010.00281.x
- Dimaggio, F. L., & Sandler, I. S. (1971). Material model for granular soils. Journal of the Engineering Mechanics Division, 97(3), 935–950. https://doi.org/10.1061/JMCEA3.0001427
- Dove, P. M., & Rimstidt, J. D. (1994). Silica water interactions. In P. J. Heaney, C. T. Prewitt & G. V. Gibbs (Eds.), Reviews in Mineralogy. Silica: Physical behavior, geochemistry and materials applications (vol. 29, pp. 259–308). Mineralogical Society of America.
- Drucker, D. C., Gibson, R. E., & Henkel, D. J. (1957). Soil mechanics and work-hardening theories of plasticity. Transactions of the American Society of Civil Engineers, 122(1), 338–346. https://doi.org/10.1061/TACEAT.0007430
- Elphick, K., Sloss, C., Regenauer-Lieb, K., & Schrank, C. (2021). Distribution, microphysical properties, and tectonic controls of deformation bands in the Miocene subduction wedge (Whakataki Formation) of the Hikurangi subduction zone. Solid Earth., 12(1), 141–170. https://doi.org/10.5194/se-12-141-2021
- Fossen, H., Schultz, R. A., Shipton, Z. K., & Mai, K. (2007). Deformation bands in sandstone: A review. Journal of the Geological Society, 164(4), 755–769. https://doi.org/10.1144/0016-76492006-036
- Fossum, A. F., Fredrich, J. T. (2000). Cap plasticity models and compactive and dilatant pre-failure deformation. In J. Girard, M. Liebman, C. Breeds & T. Doe (Eds.), Pacific Rocks 2000, Proceedings of the 4th north american rock mechanics symposium (pp. 1169––1176.). A. A. Balkema.
- Fossum, A. F., Senseny, P. E., Pfeifle, T. F., & Mellegard, K. D. (1995). Experimental determination of probability distributions for parameters of a Salem limestone cap plasticity model. Mechanics of Materials., 21(2), 119–137. https://doi.org/10.1016/0167-6636(95)00002-X
- Fournier, R. A., & Potter, R. W. III, (1982). An equation correlating the solubility of quartz in water from 25 °C to 900 °C at pressures up to 10,000 bars. Geochimica et Cosmochimica Acta, 46(10), 1969–1973. https://doi.org/10.1016/0016-7037(82)90135-1
- Frolov, T., & Mishin, Y. (2010). Effect of nonhydrostatic stresses on fluid-solid equilibrium: I. Bulk thermodynamics. Physical Review B, 82(17), 174113. https://doi.org/10.1103/PhysRevB.82.174113
- Ganor, J., Huston, T., J., & Walter, L. M. (2005). Quartz precipitation kinetics at 180 °C in NaCl solutions—Implications for the usability of the principle of detailed balancing. Geochimica et Cosmochimica Acta, 69(8), 2043–2056. https://doi.org/10.1016/j.gca.2004.09.026
- Gibbs, J. W. (1876). On the equilibrium of heterogeneous substances. Transactions of the Connecticut Academy, 3, 108–2482.
- Gibbs, J. W. (1961). The scientific papers of J. Willard Gibbs. In H. Andrews Bumstead & R. Gibbs Van Name (Eds.), Thermodynamics (Vol. 1, pp. 434). Dover Publications.
- Gratier, J-P., Dysthe, D. K., & Renard, F. (2013). The role of pressure solution creep in the ductility of the Earth’s upper crust. Advances in Geophysics, 54, 47–179.
- Hill, R. (1950). The mathematical theory of plasticity. Oxford University Press.
- Hobbs, B. E., & Ord, A. (2015). Structural Geology: The Mechanics of Deforming Metamorphic Rocks. Elsevier.
- Hobbs, B. E., & Ord, A. (2018). Episodic modes of operation in hydrothermal gold systems: Part II. A model for gold deposition. In K. Gessner, T. G. Blenkinsop & P. Sorjonen-Ward (Eds.), Characterization of ore-forming systems from geological, geochemical and geophysical studies (pp. 147–164). Geological Society. https://doi.org/10.1144/SP453.15
- Hobbs, B. E., & Ord, A. (2022). Failure modes in fluid saturated brittle rocks: Failure modes and mode-switching. Geological Magazine, 159(11-12), 2002–2019. https://doi.org/10.1017/S0016756822000516
- Holcomb, D., Rudnicki, J. W., Issen, K. A., & Sternlof, K. (2007). Compaction localization in the Earth and the laboratory: State of the research and research directions. Acta Geotechnica, 2(1), 1–15. https://doi.org/10.1007/s11440-007-0027-y
- Houlsby, G. T., & Puzrin, A. M. (2006). Principles of Hyperplasticity. Springer.
- Issen, K., & Rudnicki, J. (2000). Conditions for compaction bands in porous rock. Journal of Geophysical Research: Solid Earth, 105(B9), 21529–21536. https://doi.org/10.1029/2000JB900185
- Itasca Consulting Group, Inc. (2008). FLAC—Fast Lagrangian Analysis of Continua, Ver. 6.0. Minneapolis.
- Kamb, W. B. (1961). The thermodynamic theory of nonhydrostatically stressed solids. Journal of Geophysical Research, 66(1), 259–271. https://doi.org/10.1029/JZ066i001p00259
- Laubach, S. E., Lander, R. H., Criscenti, L. J., Anovitz, L. M., Urai, J. L., Pollyea, R. M., Hooker, J. N., Narr, W., Evans, M. A., Kerisit, S. N., Olson, J. E., Dewers, T., Fisher, D., Bodnar, R., Evans, B., Dove, P., Bonnell, L. M., Marder, M. P., & Pyrak‐Nolte, L. (2019). The role of chemistry in fracture pattern development and opportunities to advance interpretations of geological materials. Reviews of Geophysics, 57(3), 1065–1111. https://doi.org/10.1029/2019RG000671
- Lubarda, V. A., Mastilovic, S., & Knap, J. (1996). Brittle-ductile transition in porous rocks by cap model. Journal of Engineering Mechanics, 122(7), 633–642. https://doi.org/10.1061/(ASCE)0733-9399(1996)122:7(633)
- Ma, J. (2014). Coupled flow deformation analysis of fractured porous media subject to elastic-plastic damage [unpublished PhD thesis]. The University of NSW. pp. 224.
- Ma, Z., Li, Y., Gamage, R. P., Zhang, G., & Zhang, C. (2021). Probing the mechanical properties of granite from a microscopic perspective. Geothermal Resources Council Transactions, 45, 978–993.
- Manning, C. E. (1994). The solubility of quartz in H2O in the lower crust and upper mantle. Geochimica et Cosmochimica Acta, 58(22), 4831–4839. https://doi.org/10.1016/0016-7037(94)90214-3
- McCuaig, T. C., & Hronsky, J M A. (2014). The mineral system concept: The key to exploration targeting. In K. D. Kelly, & H. C. Golden (Eds.), Building exploration capability for the 21st Century (pp. 153–175). Society of Economic Geologists, Inc. Special Publication.
- Menzel, M. D., Urai, J. L., Ukar, E., Hirth, G., Schwedt, A., Kovács, A., Kibkalo, L., & Kelemen, P. B. (2022). Ductile deformation during carbonation of serpentinised peridotite. Nature Communications, 13(1), 3478. https://doi.org/10.1038/s41467-022-31049-1
- Oka, F., Kimoto, S., Higo, Y., Ohta, H., Sanagawa, T., & Kodaka, T. (2011). An elasto-viscoplastic model for diatomaceous mudstone and numerical simulation of compaction bands. International Journal for Numerical and Analytical Methods in Geomechanics, 35(2), 244–263. https://doi.org/10.1002/nag.987
- Olsson, W. A. (1999). Theoretical and experimental investigation of compaction bands in porous rock. Journal of Geophysical Research: Solid Earth, 104(B4), 7219–7228. https://doi.org/10.1029/1998JB900120
- Ord, A., & Hobbs, B E. (2018). Episodic modes of operation in hydrothermal gold systems: Part I. Deformation, mineral reactions and chaos. In K. Gessner, T. G. Blenkinsop & P. Sorjonen-Ward (Eds.), Characterization of ore-forming systems from geological, geochemical and geophysical studies (pp. 121–146). Geological Society. https://doi.org/10.1144/SP453.14
- Paterson, M. S. (1995). A theory for granular flow accommodated by material transfer via an intergranular fluid. Tectonophysics, 245(3-4), 135–151. https://doi.org/10.1016/0040-1951(94)00231-W
- Phillips, O. M. (1991). Flow and reactions in permeable rocks. Cambridge University Press.
- Poulet, T., Veveakis, M., Regenauer-Lieb, K., & Yuen, D. A. (2014). Thermo-poro-mechanics of chemically active creeping faults. 3: The role of serpentinite in episodic tremor and slip sequences, and transition to chaos. Journal of Geophysical Research: Solid Earth, 119(6), 4606–4625. https://doi.org/10.1002/2014JB011004
- Regenauer-Lieb, K., Hu, M., Schrank, C., Chen, X., Clavijo, S. P., Kelka, U., Karrech, A., Gaede, O., Blach, T., Roshan, H., & Jacquey, A. B. (2021). Cross-diffusion waves resulting from multiscale, multi-physics instabilities: Theory. Solid Earth., 12(4), 869–883. https://doi.org/10.5194/se-12-869-2021
- Regenauer-Lieb, K., Poulet, T., & Veveakis, M. (2016). A novel wave-mechanics approach for fluid flow in unconventional resources. The Leading Edge, 35(1), 90–97. https://doi.org/10.1190/tle35010090.1
- Rudnicki, J. W. (2004). Shear and compaction band formation on an elliptic yield cap. Journal of Geophysical Research, 109(B3), B03402. https://doi.org/10.1029/2003JB002633
- Rutter, E. H. (1976). The kinetics of rock deformation by pressure solution. Philosophical Transactions of the Royal Society of London, 283, 203–219.
- Saishu, H., Okamoto, A., & Otsubo, M. (2017). Silica precipitation potentially controls earthquake recurrence in seismogenic zones. Scientific Reports, 7(1), 13337. https://doi.org/10.1038/s41598-017-13597-5
- Saksala, T. (2010). Damage–viscoplastic consistency model with a parabolic cap for rocks with brittle and ductile behavior under low-velocity impact loading. International Journal for Numerical and Analytical Methods in Geomechanics, 34(10), 1041–1062. https://doi.org/10.1002/nag.847
- Schenk, O., & Urai, J. L. (2004). Microstructural evolution and grain boundary structure during static recrystallization in synthetic polycrystals of Sodium Chloride containing saturated brine. Contributions to Mineralogy and Petrology, 146(6), 671–682. https://doi.org/10.1007/s00410-003-0522-6
- Schimmel, M. T. W. (2020). Stress-cycling data uniaxial compaction of quartz sand in various chemical environments. Utrecht University. https://doi.org/10.24416/UU01-VM3Z6I
- Sekerka, R. F., & Cahn, J. W. (2004). Solid-liquid equilibrium for non-hydrostatic stress. Acta Materialia, 52(6), 1663–1668. https://doi.org/10.1016/j.actamat.2003.12.010
- Sheldon, H. A., & Ord, A. (2005). Evolution of porosity, permeability and fluid pressure in dilatant faults post-failure: Implications for fluid flow and mineralization. Geofluids, 5(4), 272–288. https://doi.org/10.1111/j.1468-8123.2005.00120.x
- Sheldon, H. A., Barnicoat, A. C., & Ord, A. (2006). Numerical modelling of faulting and fluid flow in porous rocks: An approach based on critical state soil mechanics. Journal of Structural Geology, 28(8), 1468–1482. https://doi.org/10.1016/j.jsg.2006.03.039
- Shimizu, I. (1995). Kinetics of pressure solution creep in quartz: Theoretical considerations. Tectonophysics, 245(3-4), 121–134. https://doi.org/10.1016/0040-1951(94)00230-7
- Shimizu, I. (1997). The nonequilibrium thermodynamics of intracrystalline diffusion under nonhydrostatic stress. Philosophical Magazine A, 75(5), 1221–1235. https://doi.org/10.1080/01418619708209853
- Sibson, R. H. (1985). A note on fault reactivation. Journal of Structural Geology, 7(6), 751–754. https://doi.org/10.1016/0191-8141(85)90150-6
- Sibson, R. H. (2020). Preparation zones for large crustal earthquakes consequent on fault-valve action. Earth, Planets and Space, 72(1), 31. https://doi.org/10.1186/s40623-020-01153-x
- Sibson, R. H., Robert, F., & Poulsen, K. H. (1988). High-angle reverse faults, fluid pressure cycling, and mesothermal gold-quartz deposits. Geology, 16(6), 551–555. https://doi.org/10.1130/0091-7613(1988)016<0551:HARFFP>2.3.CO;2
- Späth, M., Urai, J. L., & Nestler, B. (2022). Incomplete crack sealing causes localization of fracturing in hydrothermal quartz veins. Geophysical Research Letters, 49(15), e2022GL098643. https://doi.org/10.1029/2022GL098643
- den Ende, M. P. A., Niemeijer, A. R., & Spiers, C. J. (2019). Influence of grain boundary structural evolution on pressure solution creep rates. Journal of Geophysical Research: Solid Earth, 124(10), 10210–10230. https://doi.org/10.1029/2019JB017500
- Veveakis, M., & Regenauer-Lieb, K. (2015). Cnoidal waves in solids. Journal of the Mechanics and Physics of Solids, 78, 231–248. https://doi.org/10.1016/j.jmps.2015.02.010
- Wintsch, R. P., & Dunning, J. (1985). The effect of dislocation density on the aqueous solubility of quartz and some geological implications. A theoretical approach. Journal of Geophysical Research, 90(B5), 3649–3657. https://doi.org/10.1029/JB090iB05p03649
- Wintsch, R. P., & Yeh, M-W. (2013). Oscillating brittle and viscous behavior through the earthquake cycle in the Red River Shear Zone: Monitoring flips between reaction and textural softening and hardening. Tectonophysics, 587, 46–62. https://doi.org/10.1016/j.tecto.2012.09.019
- Wong, T. F., & Baud, B. (2012). The brittle-ductile transition in porous rock: A review. Journal of Structural Geology, 44, 25–53. https://doi.org/10.1016/j.jsg.2012.07.010
- Wong, T-F., David, C., & Zhu, W. (1997). The transition from brittle faulting to cataclastic flow in porous sandstones: Mechanical deformation. Journal of Geophysical Research: Solid Earth, 102(B2), 3009–3025. https://doi.org/10.1029/96JB03281
- Zhao, C., Hobbs, B. E., & Ord, A. (2008). Convective and Advective Heat Transfer in Geological Systems. Springer.
- Zhong, R., Brugger, J., Chen, Y., & Li, W. (2015). Contrasting regimes of Cu, Zn and Pb transport in ore-forming hydrothermal fluids. Chemical Geology, 395, 154–164. https://doi.org/10.1016/j.chemgeo.2014.12.008
- Zhurkov, S. N. (1984). Kinetic concept of the strength of solids. International Journal of Fracture, 26(4), 295–307. https://doi.org/10.1007/BF00962961